Summary
This study involved a comprehensive review and analysis of fifteen 2-m diameter pool fire tests (fueled by heptane, Bakken crude oil, and diluted bitumen or dilbit) that were conducted by Sandia National Laboratories (Sandia) as part of test report TP 15465, “Rail tank cars exposed to fire: Analysis of thermal conditions in a railcar engulfed in a crude oil fire (Series 1-3 Tests) – March 24, 2021”. Sandia’s time-averaged experimental results were reviewed and verified, then modified as necessary. The experimental data were then analysed in greater detail. The fire characteristics from tests of different fuels involving the same experimental test conditions were also compared, as were the measurements of the thermal exposure of an engulfed cylindrical object representing a rail tank car inside the fire.
Background
As part of TP 15465, three (3) series of 2 m diameter pool fire tests were conducted at Sandia National LaboratoriesFootnote 1. Series 1 tested heptane, Series 2 tested Bakken crude oil, and Series 3 tested diluted bitumen or dilbit. The objective of these experiments was to characterize, at 1/10th scale, the thermal environment surrounding a simulated rail tank car (called a calorimeter) engulfed in the pool fire, while investigating effects of varying the fuel type, fuel supply temperature (20 °C or 60 °C), method of fuel feed (maintained at a constant depth or allowed to burn down), presence of the calorimeter, and height of the calorimeter above the fuel (centred 0.5 m or 1 m above the bottom of the fuel pan). The measurement parameters included the fuel burning rate, heat release rate, flame height, temperatures and heat flux. A significant amount of data processing and analysis had been conducted by Sandia for all three test series; however, a follow-on opportunity, in the form of the present study, existed to independently verify Sandia’s results and to extend the understanding and potential impact of the tests by analysing the data in greater detail.
Objectives
The objective of this study was to assess the difference in the thermal conditions to which a calorimeter was exposed depending on the hydrocarbon fuel source for the pool fire.
Methods
A detailed analysis of the Sandia experimental crude oil fire data was performed by:
- verifying the time-averaged results (averaged due to their fluctuating nature) of the thermal measurements presented in the Sandia test reportFootnote 2
- examining changes in the fuel temperature distribution (and other corresponding data) in order to gain insight into the burning behaviour of the tested fuels
- comparing corresponding tests involving the same experimental test conditions to enhance understanding of the test results
Results
Verification of time-averaged results in Sandia Test Report
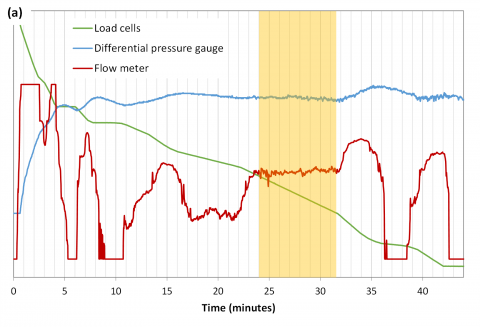
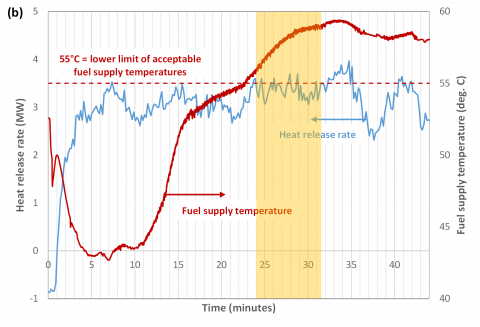
In the Sandia reportFootnote 2, each measurement parameter was averaged over a time interval due to their fluctuating nature. The time interval used to average the measured data in each of the Series 1 and 2 tests was different for each measurement parameter, making it difficult to draw conclusions about a particular test and to compare between tests. In the present work, a single time-averaging period that could be applied to all measurement parameters was therefore identified for each test of Series 1 and 2. Figure 1 (a) and (b) shows an example of how steady state periods were chosen, then consistently applied for all other variables.
Figure 1. Example of consistent time-averaging period for Test 2.4 (Bakken) shown in yellow highlight.
For Series 1, the use of the identified time-averaging period resulted in less than 4% difference from Sandia’s values for all measurement parameters except the heat flux from the directional flame thermometers (DFTs), as discussed below. For Series 2, the use of the identified time-averaging period generally resulted in less than 7% difference from Sandia’s values.
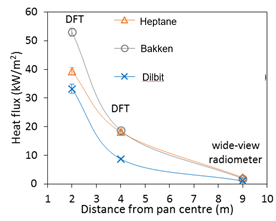
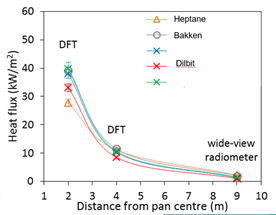
The main adjustment made to Series 1 and 2, based on a review of Sandia’s data, was to recalculate the values of total heat flux to the DFTs using the same method as Series 3, providing a consistent basis for comparison between all test series. This resulted in differences in total heat flux of 30-40% for Series 1 data and 2-40% for Series 2 data. Figure 2 shows the significance of this difference - while Sandia’s results suggested a difference existed between fuel types and the resulting heat flux to DFT, NRC’s results show this difference is minimal.
(a)
(b)
Figure 2. Heat flux to directional flame thermometer (DFT) from Sandia's results (a) and NRC's results (b).
Further, the time intervals used by Sandia to average the heat release rate (HRR) data were found to require correction due to an invalid assumption about the sampling rate used by the HRR measurement system, resulting in up to 5% error in the time-averaged HRR values presented in the Sandia test report Series 1 and 2Footnote 2.
For Series 3, the Sandia test reportFootnote 2 used time-averaged values calculated by integrating the data from 0 to 25 minutes after the start of the fire test and then dividing by 25 minutes. These values thus included the period of fire growth immediately after ignition and were typically associated with larger standard deviations because the fires did not burn steadily. In the present analysis, multiple shorter time-averaging periods were selected based on steady state test conditions to permit quantification and analysis of the changes in dilbit burning behaviour. In general, Sandia’s parameter values compared reasonably well to the range of values determined using the shorter time-averaging periods.
Examination of burning behaviour and fuel temperature distribution
As the reference fuel, the heptane tests showed how a pure, single-component fuel burns. Because the pan was pre-filled with fuel prior to ignition, there was an initial temperature stratification in the pool, which gradually diminished until the entire pool was at a uniform temperature near the fuel boiling point. This temperature was then maintained until the fuel completely burned down.
The Bakken crude oil appeared to experience initial preferential burning of the lighter ends (up to C9), as seen through a ~10% increase in heat release rate early during the test in which the fuel was allowed to burn down without replenishment. Partway through this test, a simultaneous increase in heat release rate, decrease in temperatures immediately above the fuel surface, and increase in temperatures in the upper part of the fire plume were observed, which could potentially be explained by the thermal cracking of heavier ends in the crude oil releasing additional fuel vapours.
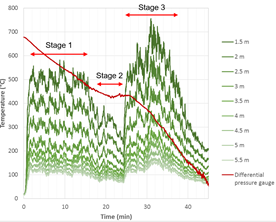
In general, the dilbit tests exhibited three distinct stages of burning (Figure 3).
Figure 3. Three stages of burning for dilbit (test 3.4 shown).
The first stage was characterised by moderately high levels of heat release rate and flame height, as well as plume temperature, surface emissive power and heat flux at heights above the calorimeter. It appeared to correspond to fuel temperatures below approximately 150°C and the vapourization of the lighter ends (up to C9). This was followed by a second stage with noticeably lower levels of the same parameters, that seemed to correspond to fuel temperatures increasing to approximately 300-350 °C (with the possible existence of localized hot spots greater than 400°C) and the burning of components in the C10-C24 range. Thermal cracking of the heavier ends (C25+) was likely involved in this stage. Finally, the third stage showed levels of heat release rate, flame height, plume temperature, surface emissive power and heat flux (at heights above the calorimeter) that were similar to or higher than those in the first stage. It appeared to correspond to fuel temperatures greater than 350°C and the burning of the lighter hydrocarbons produced by thermal cracking. The three stages of burning appeared to be consistent with a distillation-type burning process for the dilbit, which is a blended mixture of condensate diluent with light constituents (C4 to C9, with a peak at C5), and bitumen with heavy constituents (C25+).
Test comparisons
Among the tests without the calorimeter, the heptane fire had the highest burning rate and flame height, followed by the Bakken fire and then the dilbit fire. Compared to the heptane fire, the Bakken fire exhibited steeper decreases in plume temperature and narrow-view heat flux with increasing height, consistent with the shorter flame height. Compared to the Bakken fire, the dilbit fire exhibited much lower magnitudes in temperature at each elevation along the plume axis due to the shorter flame height, but only slightly lower levels of surface emissive power across the height of the plume.
The presence and placement of the calorimeter inside the pool fire and the resulting effect on flame behaviour was of interest as it illustrated how a tank car may interact with a pool fire. Among the tests with the calorimeter at 1 m height, the heptane fire had the highest burning rate and flame height, followed by the Bakken fire and then the dilbit fire. In the heptane fire, similar levels of combustion (i.e. local heat release) appeared to occur both above and below the calorimeter, resulting in uniform levels of total heat flux around the calorimeter surface. In the Bakken fire, because the ends of the calorimeter were less fully engulfed in flame, the total heat flux to the top of the calorimeter was lower than to the bottom in the left and right measurement planes. The available data was insufficient (due to thermocouple failure) to draw conclusions about the centre measurement plane. In the dilbit fire, most of the combustion occurred below the calorimeter, resulting in higher total heat flux to the bottom of the calorimeter than to the top in all measurement planes. Overall, the calorimeter received the lowest levels of total heat flux in the heptane fire because this fire was less optically thick (due to less soot production) than either of the crude oil fires.
Among the tests with the calorimeter at 0.5 m height, the dilbit fire appeared to have a lower burning rate than the Bakken fire, in addition to a lower flame height. Much of the combustion seemed to occur above the calorimeter in the Bakken fire, but below the calorimeter in the dilbit fire. This was consistent with where the highest total heat flux to the calorimeter was measured in each test. In the Bakken fire, the total heat flux was higher to the top of the calorimeter along the centre measurement plane than to the bottom, whereas in the dilbit fire, the total heat flux generally appeared to be higher towards the bottom of the calorimeter.
The tests with the calorimeter at 1 m height were compared to a similar test with the same pool diameter conducted by Sandia using Strategic Petroleum Reserve (SPR) crude oilFootnote 3. The burning rate and heat release rate of the SPR fire were reasonably similar to those of the Bakken fire. Measurements of narrow-view heat flux (surface emissive power) were similar among the SPR, dilbit and Bakken fires, indicating that this parameter was not greatly affected by differences in crude oil composition. The total heat flux to the bottom of the calorimeter was similar among the SPR, dilbit and Bakken fires, but the heat flux profiles in the SPR test were more uniform around the surface of the calorimeter, likely due to the calorimeter in the SPR test being shorter in length and thus more fully engulfed by the fire along its measurement planes.
Additional comparisons were made between the Series 1, 2 and 3 tests and two other sets of pool fire experiments previously conducted at Sandia. One comparison focused on the effect of changing the scale of the fire from 2 m to 5 m diameter using the same crude oil (Bakken). Although it was difficult to compare the 2 m and 5 m diameter fire tests because of differences in atmospheric conditions (the 5 m fire test was conducted outdoors), the surface emissive power was found to be similar, indicating that both fires had similar optical thickness and lending credibility to the use of 2 m diameter fires to simulate larger-scale scenarios. The spatially-averaged total heat flux to the calorimeter was also similar when the calorimeter was placed in similar relative locations (i.e. similar ratio of calorimeter elevation to pool diameter) inside the fire.
The other comparison focused on the effect of changing the fuel type from crude oil to other hydrocarbon fuels using the same-sized (2 m diameter) fire. The heptane fire was found to be similar to the Jet Propellant 8 (JP-8) fire in both burning rate and flame height, while the Bakken and dilbit fires had lower burning rates and flame heights. This could be expected because heptane is a pure fuel and JP-8 a highly refined aviation fuel, while Bakken is a crude oil and dilbit a mixture of heavy bitumen and lighter condensate. All four fuels are known to produce sooty flames when burning as a liquid pool fire and thus provided a useful basis for comparison.
Conclusions
The time-averaged results calculated in this study were generally in good agreement with those in the Sandia test reportFootnote 2. The main exception was the values of total heat flux to the DFTs in the heptane and Bakken tests. The dilbit data were analysed in greater detail here than in the Sandia reportFootnote 2, using multiple time-averaging periods of shorter duration, to provide better insight into the unsteady burning behavior of this fuel. Table 1 shows select fire properties for each series from the Sandia report, but with added detail for dilbit’s distinct three stage burning.
| Property | Series 1 (Heptane) | Series 2 (Bakken) | Series 3 (Dilbit) |
|---|---|---|---|
|
Burn Behaviour |
Steady |
Steady |
Sandia: Steady
NRC: Multi-Stage |
|
Flame Height (m) |
5.6-6.8 |
4.3-4.5 |
Sandia: 3.4-3.5
NRC: Phase 1: 3.8 Phase 2: 3.4 Phase 3: 3.7 |
|
Average HRR (MW) |
4.4-5.4 |
3.2-3.8 |
Sandia: 3.7*
NRC: 4.475* |
|
Average Heat Flux to Calorimeter (kW/m2) |
58 |
96 |
Sandia: 72
NRC: Phase 1: 78 Phase 2: 79 Phase 3: 93 |
|
Average Calorimeter Exterior Temp. (ºC) |
816, 864 |
881-993 |
Sandia: 773-870
NRC: Phase 1: 856 Phase 2: 859 Phase 3: 891 |
The heptane tests represented the burning behavior of a pure, single-component fuel. The Bakken tests indicated likely preferential burning of the lighter ends early during the test, and possible thermal cracking of the heavier ends later during the test. The dilbit tests exhibited three stages of burning, which appeared to be consistent with a distillation-type burning process.
In the tests with and without the calorimeter at 1 m height, the heptane fire had the highest burning rate and flame height, followed by the Bakken fire and then the dilbit fire. However, the calorimeter received the lowest levels of total heat flux in the heptane fire because this fire was less optically thick (due to less soot production) than either of the crude oil fires.
Comparison of the tests with the calorimeter at 1 m height to a similar test conducted by Sandia using SPR crude oilFootnote 3 showed no clear effect of crude oil composition on the narrow-view heat flux (surface emissive power) or on the total heat flux to the bottom of the calorimeter
Future action
Recommendations for areas of future potential research based on this study are:
- verify when thermal cracking would begin to occur in the fuel pool and whether localized hot spots could exist to promote higher rates of cracking
- analyse the residue samples collected from the Bakken and dilbit tests to see if their characteristics and composition are consistent with the findings from the present study
- investigate effects on the development of a fuel-rich, non-combusting vapour zone immediately above the fuel surface, caused by the presence of the calorimeter and by changes in its elevation
- investigate effects of a changing lip height of the fuel pan on fire characteristics
- investigate levels of soot production when burning crude oils of differing composition
- experimentally simulate, at 1/10th scale, a typical fire scenario involving the rail tank car sitting upright on the ground inside the fire, for comparison with the present results
- investigate effects of scaling on the fire characteristics prior to applying the results from the present work to a realistic fire scenario
References
TP 15480E
ISBN: 978-0-660-37902-9 (PDF)
978-0-660-37903-6 (paper)
Catalogue Number: NR24-86/2021E-PDF
Acknowledgements
This analysis was funded by Transport Canada and conducted by the National Research Council of Canada. The experimental testing was conducted by Sandia National Laboratories as part of TP 15465.
Contact
To obtain a copy of the report, please contact us:
TDG Scientific Research Division
TC.TDGScientificResearch-RecherchescientifiqueTMD.TC@tc.gc.ca
Keywords
Crude oil fire, heptane fire, dilbit fire, pool fire, rail tank car, calorimeter, Bakken, dilbit, Bakken fire, heat release rate, heat flux
