Summary
This work developed and validated a proof of concept of numerical models of crude oil pool fires.
Background
Since 2016, the National Research Council Canada (NRC) has been collaborating with Transport Canada (TC) to study fire incidents involving rail tank cars carrying crude oil. These studies involved conducting experiments of an object engulfed in 2-m diameter crude oil pool fires using a 1/10th scale calorimeter, as a proxy for a rail tank car in a pool fire. To extrapolate the findings from these experiments and to gain further insight into these fires, the NRC constructed a numerical model for crude oil pool fires. Stage 1 investigated the feasibility of using two (2) open-source modelling tools, Fire Dynamics Simulator (FDS) and Open Source Field Operation and Manipulation (OpenFOAM) to simulate crude oil fires.Footnote 1 Both tools showed promising results in terms of numerical fire simulations using parallel computation.
This summary highlights the findings from Stage 2. Numerical models in OpenFOAM and FDS were validated against experimental results from the 1/10th scale experiments conducted indoors by the NRC at Sandia National Laboratories (SNL) using 11 validation parameters at approximately 100 locations in the numerical domain. The six (6) simulations corresponded to three (3) fuels (heptane, Bakken and dilbit crude oils) in two (2) scenarios, one (1) with and one (1) without the calorimeter in the domain.
Objectives
The purpose of this work was to develop and validate numerical models for crude oil fires. These models, once further validated, could be used to:
- extrapolate the findings from scaled-down experiments to full-scale fire incidents
- simulate pool fires for crude oils that have not been used in pool fire experiments
- simulate other fire incident scenarios involving rail tank cars
- provide high resolution thermal boundary conditions to other research groups working on the tank car structure or the crude oil inside the tank car
Methods
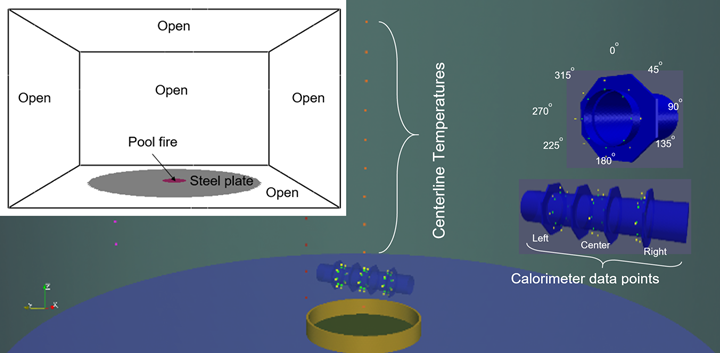
Figure 1.Domain and data points
Details about the CFD tools (OpenFOAM and FDS) such as the governing equations solved, sub models used, discretization methodology, structure of input file(s), and modelling steps can be found in Footnote 1. The detailed results of the numerical simulations and validation against experimental results are presented and discussed in the full validation report for this Stage 2 work.
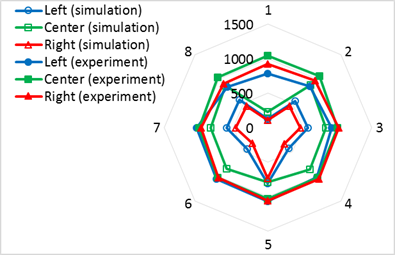
Six (6) simulations were conducted using OpenFOAM and FDS. Each simulation was a numerical model of a test from the NRC-SNL experimentsFootnote 2. The total mass flux of fuel was imposed in the simulations from the experimental value. Different mixtures of heptane (C7H16) and acetylene (C2H2) were used as surrogates to simulate Bakken and dilbit in a simplified way. The domain and data points at which validation parameters are measured are shown in Figure 1, above. The outer boundary conditions (BCs) of the domain are shown in the top left side of the figure. The calorimeter data points are arranged around the calorimeter (at 0°, 45°, 90°, 135°, 180°, 225°, 270°, and 315°) in three (3) plans (left, center, and right). Specific dimensions of the domain and mesh cell sizes are listed in Table 1. Results of a grid sensitivity analysis are in the main report.
Table 1. Domain dimensions and mesh sizes
| Domain | Dimensions (m) / shape | |
|---|---|---|
| Software | OpenFOAM | FDS |
| Outer boundaries | 12(D)×8(H) / cylindrical | 20(L) ×20(W) × 12(H) / rectangular |
| Fuel | 2(D) / circle | 2(D) / circle |
| Calorimeter | 0.33(D) ×1.8 (L) / cylindrical | 0.3×0.3×1.8 / rectangular |
| Mesh | Cell size (m) | |
| Flame zone | 0.02 | 0.05 |
| Transition zone(s) | 0.04, 0.08 | 0.1 |
| Outer zone | 0.16 | 0.2 |
The parameters used to validate the numerical models are centerline temperature, exterior to calorimeter temperature, radiative fraction, heat flux to calorimeter, calorimeter temperature, heat release rate (HRR), soot yield, temperature contours, wide angle heat flux, narrow angle heat flux and flame height.
Results
Sample results from the Bakken simulations are presented in this research summary. Table 2 summarizes the range of numerical results of all validation parameters from OpenFOAM and FDS compared to experimental results.
Table 2. Results summary for the Bakken with calorimeter simulations (OpenFOAM (OF) and FDS)
| Validation Parameter | Numerical Range | Experimental Range | |
|---|---|---|---|
| Software | OF | FDS | |
| Centerline temp. (°C) | 233-972 | 331-866 | 236-978 |
| Exterior to calorimeter temp. (°C) | 555-1135 | 113-900 | 790-1070 |
| Radiative fraction | 44% | 39% | 47% |
| HF to calorimeter (kW/m2) | 76-178 | 11.2-111 | 64-136 |
| Calorimeter temp. (°C) | 479-1196 | 362-1161 | 796-1031 |
| HRR (MW) | 3.77 | 3.95 | 3.6 |
| Soot yield | 15% | - | Not reported |
| Temp. contours (K) | 750-1150 | - | 750-1150 |
| Wide angle HF (kW/m2) | 2.6-6.5 | 1.5-2.5 | 1.9-2.4 |
| Narrow angle HF (kW/m2) | 30-143 | - | 15.2-90 |
| Flame height (m) | 1.6 | 4.8 | 4.46 |
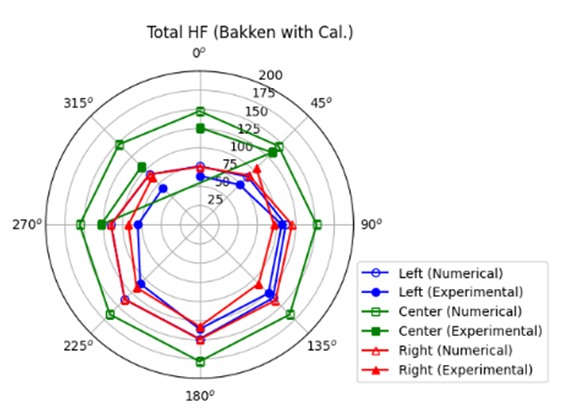
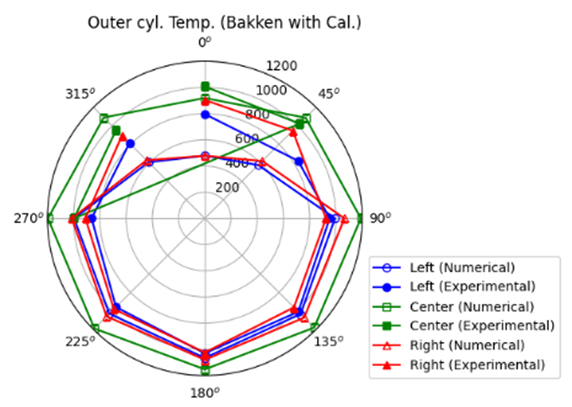
For both OpenFOAM and FDS, considering the stochastic nature of fires, there was generally good agreement, in terms of range between the numerical model and the experimental results for the centerline temperature, exterior to calorimeter temperature, radiative fraction, heat flux to the calorimeter, calorimeter temperature, and HRR. The distribution of exterior temperatures, calorimeter temperatures and heat flux to the calorimeter deviated more from the experimental results in the FDS model compared to the OpenFOAM results. The main reason is the limited ability to model curved surfaces in FDS. A selection of the parameters is presented in Figures 2 to 6.
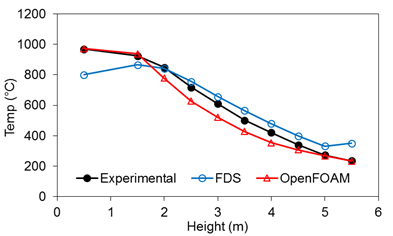
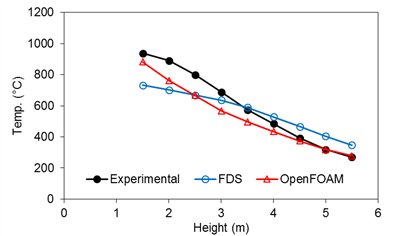
Figure 2 shows the average flame temperature at the centerline and above the pool fire from the experiments and simulations of OpenFOAM and FDS.
Figure 2. Centerline temperature (Bakken): a) with calorimeter b) without calorimeter
Figures 3a, 3b and 3c compare the Bakken OpenFOAM numerical and experimental results for the exterior to calorimeter temperature, heat flux to the calorimeter, and outer surface calorimeter temperature distributions, respectively, on the left, central and right planes.
Figure 3. a) Exterior temperature (°C) b) Heat flux (kW/m2) c) Outer cylinder temperature (°C) (Bakken)
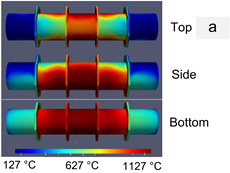
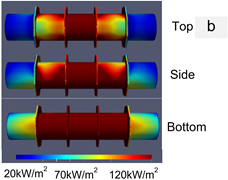
Figures 4a and 4b present the top, side and bottom view of the calorimeter temperature distribution and heat flux distribution from the Bakken simulation in OpenFOAM. Results are consistent with the observations in Figures 3b and 3c.
Figure 4. a) Calorimeter temperature distribution (°C). b) Heat flux (kW/m2) distribution (Bakken)
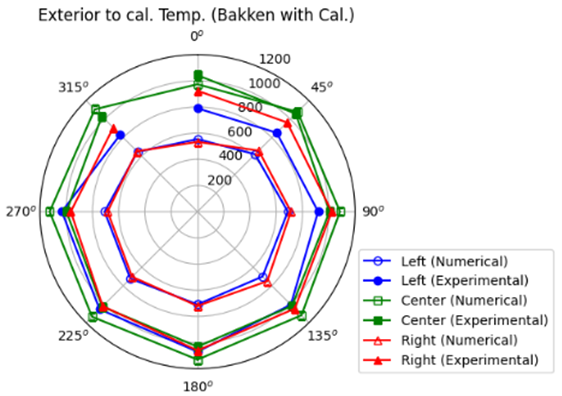
Figure 5 compares the FDS numerical and experimental exterior cylinder temperature cross sectional results for the Bakken fuel.
Figure 5. Exterior temperature (°C) (Bakken)
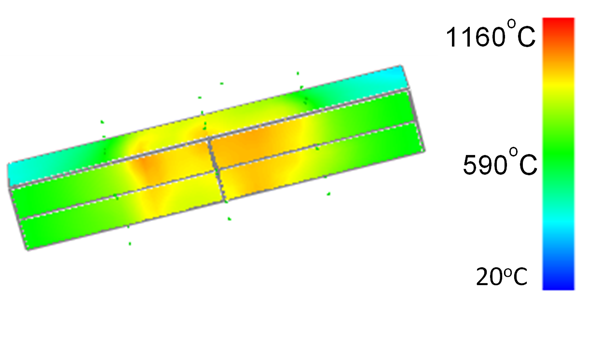
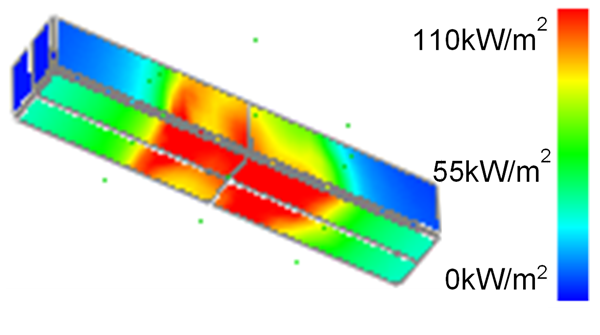
Figure 6 presents the temperature and heat flux distribution for the calorimeter from the Bakken simulation in FDS.
Figure 6. a) Calorimeter temperature distribution, and b) Heat flux distribution (Bakken), with bottom plane of calorimeter oriented towards reader
Each of these parameters are discussed and compared further in the report.
Conclusions
Numerical modelling using OpenFOAM and FDS was able to replicate the NRC-Sandia experiments of the crude oil pool fires. Results from OpenFOAM were in good agreement with the experimental results when comparing the important parameters. Results from FDS were also in good agreement with the experimental data, however, FDS cannot model curved shapes and therefore OpenFOAM was deemed to be the software of choice for any future work. Generally, any discrepancies between the numerical and experimental results could be explained by considering experimental uncertainties, the absence of the thermal mass of the calorimeter from the numerical model, the absence of small physical details from the numerical model or propagated uncertainties of input parameters (such as uncertainty in the burning rate).
The exterior to calorimeter temperature, heat flux to the calorimeter and calorimeter surface temperature, were underestimated by the FDS model. This was attributed to the cuboid geometry of the calorimeter, the absence of baffles in the simulations and the absence of a heat transfer model for the calorimeter.
The wide range of data points and parameters used to validate the numerical models and the general agreement with experimental results, provide good confidence in the ability of the numerical model to predict important parameters affecting a tank car subjected to a crude oil pool fire.
Future action
Key recommendations on possible future actions based on the present study are as follows:
- develop and validate a pyrolysis model for Bakken and dilbit crude oils to predict their burning rate and soot yield. A predictive model will calculate the burning rate independently from the fire size and will better simulate the transient behaviour of dilbit fires
- communicate with other projects, which are modeling the crude oil behaviour inside the tank and structural integrity of the tank, regarding the high-resolution boundary conditions obtained from the numerical fire simulations
- extrapolate the findings from small scale and intermediate scale experiments and numerical models to large scale fire incidents by simulating large scale fire scenarios
References
Report: Numerical Fire Modeling of Crude Oil Spills: Validation Report
Authors: I. Gomaa, N. Elsagan, D. Duong, Y. Ko (NRC)
TP 15471
ISBN: 978-0-660-38586-0
Catalogue Number: T44-3/21-2021E-PDF
Acknowledgements
This project was funded by Transport Canada and conducted by the National Research Council Canada.
The authors would like to thank Professor Jennifer Wen, University of Warwick, UK, for sharing the source codes for the combustion, soot and radiation sub-models.
Contact
To obtain a copy of the report, please contact us:
TDG Scientific Research Division
TC.TDGScientificResearch-RecherchescientifiqueTMD.TC@tc.gc.ca
Keywords
Pool fires, Numerical simulations, Modeling validation, OpenFOAM, FDS, Crude oil fire.
