About the Programs
Over the last ten years th the Asia-Pacific Gateway and Corridor Initiative (APGCI) and Gateways and Border Crossings Fund (GBCF) have improved Canada’s trade-related transportation infrastructure so that goods and people can get to their destinations more quickly and reliably.
The APGCI has focused on the movement of goods between Canada and Asia. Since 2007, most of the $1.17 billion in federal funding has been strategically invested in infrastructure projects in British Colombia’s Lower Mainland, Prince Rupert and other parts of western Canada. In addition to Transport Canada, five other federal departments and agencies have been involved in delivering APGCI.
The goal of the GBCF has been to improve the flow of goods and people between Canada and the rest of the world, with a focus on projects in Ontario, Quebec and Atlantic Canada. Since 2008, $1.3 billion of federal investment has been strategically invested to support infrastructure projects at Canada-United States border crossings, the core national highway system, ports, airports and intermodal facilities.
The federal government shared the costs of the projects with funding recipients such as provincial, territorial and municipal governments, and private firms.
About the Evaluation
The evaluation looked at the ongoing need for trade-related infrastructure programs. It also reported on the results of individual infrastructure projects as well as their collective impact. Finally, the evaluation looked at how efficiently the two Gateway programs have been delivered and provided lessons for future initiatives.
What we found
- Completed infrastructure projects have resulted in less congestion and more capacity at some of Canada’s ports, airports, roadways, and rail terminals, and quicker border crossing times.
- Collectively, the completed network of infrastructure projects has resulted in goods getting to markets from their point of origin more quickly.
- Both programs have been able to leverage significant money from partners to cover the costs of infrastructure projects. Nearly 70% of total project costs for APGCI and 66% of total project costs for GBCF have come from partners.
- Both programs were delivered efficiently. There were a number of lessons learned:
- For infrastructure funding programs, it is essential for the federal government to bring together and work with various stakeholders and interests.
- Selecting projects on the basis of merit, and using research and objective panels to inform investment decisions were also viewed as successful practices.
- There is an ongoing need to tackle challenges related to transportation and trade.
- Both programs align well with the federal government’s responsibilities and priorities.
How Canada's gateway initiatives improve the flow of trade at western ports
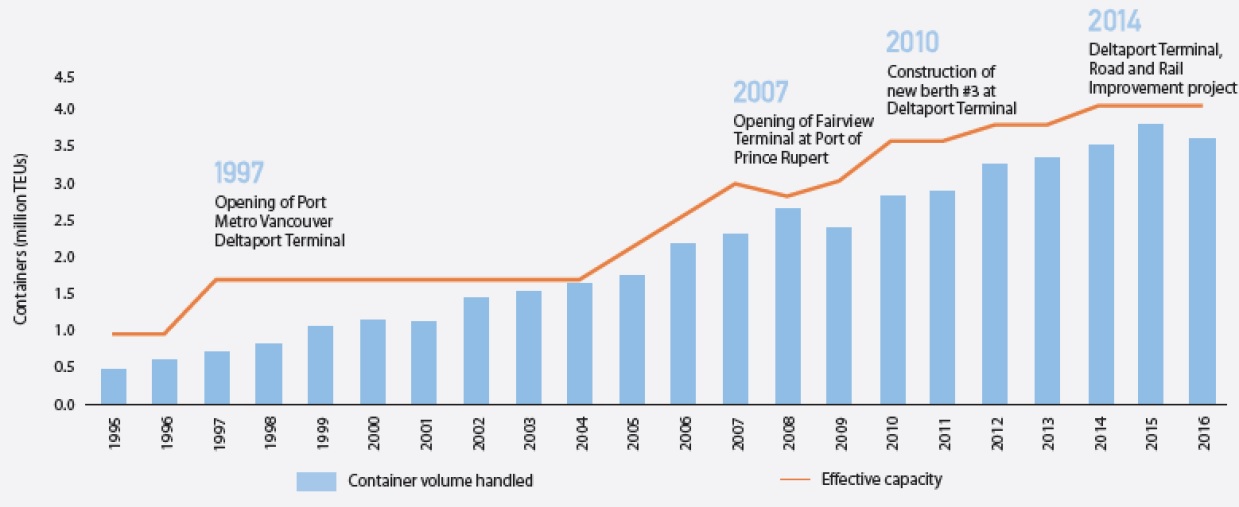
Investments under the Asia-Pacific Gateway and Corridor Initiative (APGCI) and the Gateways and Border Crossings Fund (GBCF) have increased the capacity of Canada's two western Ports (the Port of Vancouver and the Port of Prince Rupert) to handle higher volumes of container freight and cargo traffic.
The volume of cargo containers western ports can now handle has increased by about 630% over 20 years
The effective capacity of the western ports' terminals to handle containers increased by 330% over 20 years.
Since 1995, Transport Canada has provided more than $37 million to the ports of Metro Vancouver and Prince Rupert. Funding and investments by the federal government and other stakeholders have contributed to the increase in the two ports' capacity to handle more cargo traffic.
Canada's west coast ports: Container terminal operating capacity and cargo handling volume
Text version
The graph illustrates the past, current and future capacity and throughputs at the Port Metro Vancouver (PMV) container terminals from 1995 to 2026. The design capacity at the PMV terminals was 1.1 million TEUs in 1995-1996, 2.0 million TEUs in 1997-2004, 2.5 million TEUs in 2005, 3.1 million TEUs in 2006-2007, 2.8 million TEUs in 2008, 3.1 million TEUs in 2009, 3.7 million TEUs in 2010-2013, 3.9 million TEUs in 2014, 4.1 million TEUs in 2015, and 4.3 million TEUs in 2016. It is expected that the capacity will be 4.2 million TEUs in 2017, 4.8 million TEUs in 2018-2023, and 7.2 million TEUs in 2024-2026. The container throughputs at the PMV terminals were 0.5 million TEUs in 1995, 0.6 million TEUs in 1996, 0.7 million TEUs in 1997, 0.8 million TEUs in 1998, 1.1 million TEUs in 1999, 1.2 million TEUs in 2000, 1.1 million TEUs in 2001, 1.5 million TEUs in 2002-2003, 1.7 million TEUs in 2004, 1.8 million TEUs in 2005, 2.2 million TEUs in 2006, 2.3 million TEUs in 2007, 2.5 million TEUs in 2008, 2.2 million TEUs in 2009, 2.5 million TEUs in 2010-2011, 2.7 million TEUs in 2012, 2.8 million TEUs in 2013, 2.9 million TEUs in 2014, and 3.1 million TEUs in 2015. In 2016, the estimated throughputs are 3.1 million TEUs.
