
Prepared by:
Multi-Modal & Road Safety Programs
Transport Canada
November 2023
Table of contents
- List of tables
- List of figures
- Executive summary
- Introduction
- Part 1 – Implementation and Status of the National Safety Code
- NSC Program Overview
- Description of NSC Standards
- NSC Funding and Contribution Agreements
- Changes to Performance Measures and Reporting Requirements
- 2019 Status of Jurisdictional Implementation of NSC Standards
- Variance from Full Implementation of the NSC by Jurisdiction
- 2019 Status of Safety Fitness Framework
- 2019 Status of Implementation of the MVTA
- 2019 Status of Jurisdictional Enforcement of the MVTA and NSC Standards
- Part I Summary
- Part 2 – Commercial Vehicle Safety Statistics
- Annex 1 – Abbreviations for Provinces and Territories
List of tables
- Table 1: National Safety Code standards
- Table 2: NSC implementation by jurisdiction 2019
- Table 3: NSC safety rating regime – 2019 status of implementation
- Table 4: CVSA inspections 2008/09–2018/2019
- Table 5: Facility audits 2005/06-2018/19
- Table 6: Data exchange (convictions sent) fiscal years 2011/12 – 2018/2019
- Table 7: Jurisdictional staffing levels 2012/13-2018/19
- Table 8: Collisions and casualties 2000-2019
- Table 9: Number of commercial vehicles and all other vehicles involved in reportable traffic collisions by vehicle type and severity, Canada, 2015–2019
- Table 10: Estimate of vehicle kilometers travelled, 2013-2019
- Table 11: Number of commercial vehicles involved in single-vehicle collisions
- Table 12: Road user casualties in collisions involving commercial vehicles and all other vehicles by injury severity and vehicle type, Canada, 2015–2019
List of figures
- Figure 1: Number of CVSA roadside inspections in Canada per fiscal year before and after the 2009/10 removal of targets
- Figure 2: Number of facility audits conducted on extra-provincial motor carriers in Canada per fiscal year after the 2009/10 removal of targets
- Figure 3: Road crash victims 2000-2019: fatalities
- Figure 4: Road crash victims 2000-2019: serious injuries
- Figure 5: Road crash victims 2000-2019: total injuries
- Figure 6: Fatalities v. traffic and gross domestic product, 2002-2019
- Figure 7: Road fatalities, 2015-2019
- Figure 8: Number of commercial vehicles involved in reportable collisions, 2015-2019
- Figure 9: Number of commercial vehicles involved in reportable collisions, 1992-2019
- Figure 10: Number of commercial vehicles involved in fatal collisions, 2015-2019
- Figure 11: Number of commercial vehicles involved in fatal collisions, 1992-2019
- Figure 12: Number of commercial vehicles involved in injury collisions, 2015-2019
- Figure 13: Number of commercial vehicles involved in injury collisions, 1992-2019
- Figure 14: Number of commercial vehicles involved in property damage collisions, 2015-2019
- Figure 15: Number of commercial vehicles involved in property damage collisions, 1992-2019
- Figure 16: Number of vehicles involved in fatal heavy vehicle crashes by type of vehicle, 1992-2019
- Figure 17: Commercial vehicles involved in fatal collisions by type of vehicle, 2015-2019
- Figure 18: Number of vehicles involved in injury heavy vehicle crashes by type of vehicle, 1992-2019
- Figure 19: Commercial vehicles involved in injury collisions by types of vehicle, 2015-2019
- Figure 20: Commercial vehicles involvement rate by collision severity, 2015-2019
- Figure 21: Commercial vehicles collision involvement rate and resulting road casualties, 2015-2019
- Figure 22: Collision involvement rate of commercial vehicles with defects, 2015-2019
- Figure 23: Contributing factors in commercial vehicle fatal collisions, 2015-2019
- Figure 24: CMV driver condition, when condition is considered as “other than normal”, in 4.96% of CMV fatal crashes, for the 2015-2019 period – NCDB
- Figure 25: LDV driver condition, when condition is considered as “other than normal”, in 22.7% of overall fatal crashes, for the 2015-2019 period – NCDB
- Figure 26: CMV driver actions, when considered as “not driving properly”, in 27.2% of fatal CMV crashes, for the 2015-2019 period – NCDB
- Figure 27: LDV driver actions, when considered as “not driving properly”, in 50.2% of overall fatal crashes, for the 2015-2019 period – NCDB
- Figure 28: Estimate of vehicle kilometers travelled by category of heavy truck, 2015-2019
- Figure 29: Estimate of vehicle kilometers travelled by category of heavy truck, 2005-2019
- Figure 30: Estimated involvement rate of heavy trucks in fatal collisions per 100 million VKT, 2005-2019
- Figure 31: Estimated involvement rate of heavy trucks in injury collisions per 100 million VKT, 2005-2019
- Figure 32: Number of single CMV crashes (all crashes), 1992-2019
- Figure 33: Rate of single-vehicle CMV crashes to overall CMV crashes, 1992-2019
- Figure 34: Total casualties in collisions involving commercial vehicles, 1992-2019
- Figure 35: Total casualties in collisions involving commercial vehicles, 2015-2019
- Figure 36: Fatalities in collisions involving commercial vehicles, 1992-2019
- Figure 37: Fatalities in collisions involving commercial vehicles, 2015-2019
- Figure 38: Fatalities of CMV occupants and other road users involved in CMV collisions, 2015-2019
- Figure 39: Fatalities of vulnerable road users involved in CMV collisions, 2015-2019
- Figure 40: CMV occupants' fatalities in road crashes, 2015-2019
- Figure 41: CMV occupant fatalities by categories of CMV, 2015-2019
- Figure 42: Injuries in collisions involving commercial vehicles, 1992-2019
- Figure 43: Injuries in collisions involving commercial vehicles, 2015-2019
- Figure 44: Injuries of CMV occupants and other road users involved in CMV collisions, 2015-2019
- Figure 45: Injuries of vulnerable road users involved in CMV collisions, 2015-2019
- Figure 46: CMV occupants' injuries resulting from road crashes, 2015-2019
- Figure 47: CMV occupant injuries resulting from road crashes by category of CMV, 2015-2019
Executive summary
This is the 13th Annual Report to Parliament on Commercial Vehicle Safety in Canada. As per the mandate set out in Section 25 (1) of the Motor Vehicle Transport Act (MVTA), the report: (1) reviews the progress of the implementation of the rules and standards respecting the safe operation of extra-provincial truck and bus undertakings; and (2) reviews available statistical information regarding trends of highway accidents in Canada involving motor vehicles operated by extra-provincial truck and bus undertakings. This edition of the report covers the year 2019. Detailed regulatory information and safety data are presented, and trend assessments are conducted.
Part I of the report presents the regulatory update and focusses on the implementation of the National Safety Code (NSC) standards and the Safety Fitness Framework (SFF), which is embodied in the MVTA. Part II presents the motor carrier safety assessment. Note that the regulatory update is based on fiscal years (in this case 2018/19), and that the safety assessment is based on calendar years (2019). Also, since it is not possible to differentiate between extra and intra-provincial undertakings in collision statistics, the data presented in the safety assessment include all trucks and buses that fall under the regulatory oversight of the NSC.
Part I
The NSC is a comprehensive set of 16 standards that provide minimum operational and performance requirements for all important aspects of commercial vehicle, driver and motor carrier safety, with the objectives of reinforcing truck and bus safety, promoting efficiency in the motor carrier industry, and ensuring the implementation of consistent safety standards across Canada. It is applicable to trucks with a Registered Gross Vehicle Weight (RGVW) in excess of 4,500 kg and buses with a designated seating capacity of more than 10 persons, including the driver.
The critical objective of the MVTA and the NSC is that similar safety (collision) and compliance (inspection and conviction) performance must result in similar safety ratings in each jurisdiction. Through successive contribution programs, the federal government has provided funding to the provinces and territories (P/Ts) to administer the NSC and monitor motor carrier safety performance in Canada. The period under review in this report includes the contribution agreements between Transport Canada and the P/Ts for fiscal year 2015/16 to 2019/20.
The funding agreements for this period differ from earlier agreements in that they do not include pre-defined performance measures with regards to enforcement of the NSC, primarily number of roadside inspections and facility audits. The obligation for P/Ts to report on the number of inspections and facility audits conducted on intra-provincial motor carriers was also removed. Enforcement data for the first ten years under this new regime do not reveal any significant changes.
On the basis of data reported by the P/Ts through a survey conducted by Transport Canada (TC), the report details minor and more significant deviations from NSC standards across the country. For example, it is noted that even though NSC standards are meant to apply to all commercial vehicles that weigh more than 4,500 kg (whether they are considered as intra- or extra-provincial), AB, SK and YK have not implemented this general requirement. As a result, in these provinces, safety programs and regulations are not the same for intra- and extra-provincial motor carriers. While the NSC weight threshold for extra-provincial motor carriers is set at 4,500 kg, in AB and YK and at 5,000 kg in SK, in these three jurisdictions the threshold for intra-provincial motor carriers is set at 11,794 kg or more.
With regard to hours of service regulations, the data shows that AB and SK have yet to implement provincial hours of service rules that align with the National Safety Code. In those two provinces, the federal regulations apply to extra-provincial carriers only and different regulations apply to intra-provincial carriers.
Regarding the safety fitness framework, the data presented indicate that a fairly consistent safety rating system has been implemented by the P/Ts across Canada. The only change reported in 2019 is that NL is now receiving and using data from the U.S. in their safety rating system.
Finally, reviews of jurisdictional level of enforcement of the MVTA and NSC standards are included under Part I. Enforcement data is presented and analysed, and inferences are made with regard to the potential impacts of the removal of performance measures and of some reporting requirements in the latest two contribution agreements. Overall, the evidence indicates that the level of enforcement effort after 10 years under the new reporting requirements has remained stable. The number of facility audits conducted have remained rather constant under the new agreements, even though no comparison can be made with the situation under the old regime, given concurrent changes in reporting requirements. Furthermore, in the year 2018/19, there were 34,163 more CVSA inspections conducted in Canada compared to 2008/09, which was the last year under the old regime. This represents a 13% increase following the removal of performance targets. The evidence therefore supports the notion that a relatively robust, stable and dynamic safety fitness framework has been implemented by the P/Ts.
Part II
The second part of the report reviews crash statistics with a special focus on crashes involving heavy vehicles under the regulatory oversight of the NSC. The number of vehicles involved in various categories of crashes are presented, as well as single vehicle crashes, driver conditions and actions at the time of the crash and casualties resulting from heavy vehicle crashes. Crash rates, estimated on the basis of an econometric forecasting model are also discussed.
Globally, the safety assessment indicates positive downward trends for a wide variety of safety indicators related to heavy vehicles crashes. Most importantly, the lowest number of fatalities since 1992 was recorded in 2019 with a count of 353, 48% less than the highest count of 675 observed in 1997. Looking at the 2015-2019 period, there is a general decreasing trend, although the number of fatalities increased in 2017. With regards to injuries, there is again a significant positive trend since 1992. Looking at the 2015-2019 period, there was a drop in 2016, two consecutive years of mild increases in 2017 and 2018, followed by another significant drop in 2019, with a total 10,807 injured, the lowest count since 1992.
Estimates of exposure suggest an overall increase in heavy trucks VKT for the 2013-2019 period. This increase occurred after the economic downturn of 2008 and 2009 and it is mainly related to tractor-trailer transportation activities. The model further suggests that this increase in exposure did not translate into a deterioration of safety performance. In fact, fatal and injury crash rates calculated on the basis of the model and National Collision Database (NCDB) data have both been decreasing between 2005 and 2019 (55.8% for fatal crashes and 57.4% for injury crashes).
With regards to crash contributing factors as assessed by police officers at crash scenes, NCDB data shows that, for the 2015-2019 period, vehicle defects were associated with less than 4% of crashes. Driver actions, and to a lesser extent driver condition, were identified as more significant contributing factors. While the numbers are low and driver conditions was considered as “not normal” in only 5% of fatal commercial vehicle (CMV) crashes, fatigue and alcohol were identified as key contributing factors for those crashes. It is important to note however that fatigue is seriously underreported in this type of database. With regards to driver actions, when drivers were considered as “not driving properly”, in 27.2% of fatal CMV crashes, inattention and speeding were the top contributors.
In sum, NCDB data for the 2015-2019 period reveals that inattention (which relates to both fatigue and distraction) and driving too fast (which relates to high-risk driving behaviors), are key crash contributing factors for heavy vehicle fatal crashes in Canada. This is consistent with the comprehensive assessment detailed in the final report of the Human Factors and Motor Carrier Safety Task ForceFootnote 1 from the Canadian Council Motor Transport Administrators (CCMTA)
Introduction
Section 25 (1) of the Motor Vehicle Transport Act, 1985, C.29 (3rd Supp.) requires the federal Minister of Transport to prepare an annual report and table it before each House of Parliament on any of the first fifteen days on which that House is sitting after the Minister completes it. The report shall contain the following:
- The available statistical information respecting trends of highway accidents in Canada, involving motor vehicles operated by extra-provincial truck and bus undertakings; and
- The progress of the implementation of the rules and standards respecting the safe operation of extra-provincial truck and bus undertakings.
The requirement is to focus on extra-provincial truck and bus undertakings. Motor carriers are identified as extra-provincial if they transport goods and passengers in more than one province or territory (P/T) or internationally, whereas they are identified as intra-provincial (also known as “local”) if their operations are limited to the boundaries of one jurisdiction and therefore fall under the jurisdiction of a province or territory. It is however not possible to differentiate between extra and intra-provincial truck and bus undertakings when reporting on the implementation of the various safety standards since they usually apply equally to both and since the data is not broken down as such.
Similarly, collision data is reported for extra- and intra-provincial truck and bus undertakings as well as for non-commercial vehicles for comparison purposes. The term commercial vehicle refers to a truck with a Registered Gross Vehicle Weight (RGVW) in excess of 4,500 kg or a bus with a designated seating capacity of more than 10 persons, including the driver.
The report is structured in two broad sections. Part I focuses mainly on the National Safety Code (NSC) and the national Safety Fitness Framework (SFF). It provides descriptions of these two core elements of motor carrier safety oversight in Canada as well as progress reports on their implementation for the year 2019. Part I also describes the efforts made by the P/Ts to enforce the revised Motor Vehicle Transport Act (MVTA) and to apply the NSC standards for this period.
Part II is a review of road safety statistics. Note that because of the nature of the data, Part I is based on the 2018/19 fiscal year and Part II on the 2019 calendar year. Apart from the information presented in table 1, the report is written as if back in time, in this case at the end of 2019, and does not discuss subsequent developments or measures taken, which will be addressed in the reports covering future years.
Part 1 – Implementation and Status of the National Safety Code
NSC Program Overview
Motor carrier safety in Canada is a joint responsibility between the federal government and the P/Ts. The federal government has responsibility for extra-provincial truck and bus transport; however, under the MVTA, the P/Ts enforce federal regulations for extra-provincial carriers on behalf of the federal government and have sole responsibility for intra-provincial operations.
The NSC program was developed in 1987-88 by the federal, provincial and territorial governments. This regulatory regime focuses on oversight of safety performance instead of economic controls which are typically based on market entry and exit, route, and commodities as well as fees and services.
The NSC is a comprehensive set of 16 standards that provides minimum operational and performance requirements for all important aspects of commercial vehicle, driver, and motor carrier safety, with the objectives of reinforcing truck and bus safety, promoting efficiency in the motor carrier industry, and ensuring the implementation of consistent safety standards across Canada. It applies to drivers and carriers operating commercial vehicles exceeding an RGVW of 4,500 kg (except buses, which are defined by a designated seating capacity of more than 10, regardless of RGVW) and is intended for both extra and intra-provincial operations.
The NSC standards are developed by the Canadian Council of Motor Transport Administrators (CCMTA), which is the key national institution dealing with motor carrier regulation, through committees of federal, provincial and territorial governments, industry and associate members. Transport Canada (TC) and the P/Ts are equal members of CCMTA, however the standards are implemented, and legislation enforced by the provincial and territorial governments.
TC has co-funded the consistent and harmonized implementation of the NSC since 1987 through a series of contribution programs. TC's purpose in this area is mainly to improve motor carrier safety in Canada by facilitating the consistent implementation, by P/T governments, of the 16 standards under the NSC.
The amended MVTA of 2006 continues to allow provincial and territorial governments to enforce federal regulations on federal motor carriers on behalf of the federal government. These governments are in turn responsible for ensuring that their safety rating systems comply with the requirements of the NSC.
The federal role is to provide funds, administrative support, and advice to the P/Ts in order to assist in the implementation and enforcement of the NSC. TC also has responsibility for monitoring the performance and the impact of the NSC program and for promoting national consistency in the application of the standards, as well as international harmonization.
Description of NSC Standards
Table 1 below identifies the NSC standards, indicates whether they are under review by CCMTA, when they were last amended, notes whether they are subject to a Canada/US reciprocity agreement and provides a description of their key elements.
|
# |
Name |
Description |
|---|---|---|
|
1 |
Single Driver Licence Concept - 1988 Canada/US Commercial Driver Licence (CDL) Reciprocity Agreement – 1989 |
Prohibits a driver from holding more than one driver's licence. In addition, administrative procedures have been established to ensure driving infractions are assigned to a single licence and record. A series of checks must also be conducted along with incorporating the driver record from a previous jurisdiction. |
|
2 |
Knowledge and Performance Tests (Drivers) – Revised 2020 Canada/US CDL Reciprocity Agreement – 1989 |
Establishes a process for standardized written and road testing of commercial drivers. It also identifies the key elements that will be evaluated by government officials charged with administering the tests. Note: Since 1988, jurisdictions have updated their individual requirements by upgrading knowledge tests to prevent fraud and enhance road tests. In addition, air brake training became mandatory. |
|
3 |
Driver Examiner Training Program – Revised 2020 Canada/US CDL Reciprocity Agreement – 1989 |
A standard designed to upgrade the skills and knowledge of driver examiners and ensure they are consistent across Canada. |
|
4 |
Driver Licensing Classification – Revised 2020 Canada/US CDL Reciprocity Agreement – 1989 |
Establishes a uniform classification and endorsement system for driver licences and ensures that a licence issued in one province/territory is recognized in all provinces/territories. |
|
5 |
Self-Certification Standards and Procedures – 1988 |
Outlines the criteria for permitting carriers and driver training schools to train and test commercial drivers. Note: Not implemented in smaller jurisdictions due to the lack of demand arising from smaller carrier, driver, and fleet populations. This does not detract from national uniformity of requirements. |
|
6 |
Determining Driver Fitness in Canada – Revised 2021 Revised annually by CCMTA Canada/US Medical Reciprocity Agreement – 1998 |
The CCMTA Medical Standards for Drivers sets the medical criteria used to establish whether drivers (all classes) are medically fit to drive. Requires commercial drivers to undergo periodic medical examinations. |
|
7 |
Carrier and Driver Profiles – Revised 2002 Part of safety fitness framework |
Provides jurisdictions with a record of driver and carrier performance in terms of compliance with safety regulations. Supports enforcement activity to remove unsatisfactory drivers and carriers from service and identifies the type of information which must be maintained on each commercial driver and vehicle. |
|
8 |
Short-Term Suspension – 1988 |
Describes the criteria for suspending a driver's licence on a short-term (24 hour) basis when a peace officer has reasonable and probable grounds to believe the driver's ability is affected by alcohol or drugs. |
|
9 |
Hours of Service – Revised 2022 Federal regulations were implemented January 1, 2007, revised 2010. Matching jurisdictional regulations were implemented in 2007 by most jurisdictions |
Limits the number of hours a commercial driver can be on duty and operate a commercial vehicle. It outlines the requirement for to track hours of service, describes the various cycles of operation and sets out driver and carrier record-keeping requirements. |
|
10 |
Cargo Securement – Amended 2013 Revised annually. |
Outlines the minimum requirements for securing loads. Latest version is product of joint Canada/US research and standards harmonization effort. |
|
11 |
Maintenance and Periodic Inspection (PMVI) – Revised every 5 years Updated in 2020. Canada/US Reciprocity Agreement – 1991 |
Outlines minimum requirements for maintenance and periodic inspections of the 3 million commercial vehicles operated by motor carriers in Canada. |
|
12 |
CVSA On-Road Inspections Updated annually |
Outlines the criteria for CVSA on-road inspections conducted by provincial and territorial commercial driver and vehicle enforcement inspectors. |
|
13 |
Trip Inspection – Revised 2009 Implemented in 2006 |
Prescribes daily trip inspection requirements on carriers. Intent is to ensure early identification of vehicle problems and defects, and to prevent the operation of vehicles with conditions that are likely to cause or contribute to a collision or vehicle breakdown. |
|
14 |
Safety Rating – Revised 2009 Implemented federally January 1, 2006, with matching rules in provinces. Canada/US Reciprocity Agreement – 1994/2008 |
Establishes the motor carrier safety rating framework by which each jurisdiction assesses the safety performance of motor carriers. |
|
15 |
Facility Audits – Revised 2003 Part of safety fitness framework Canada/US Reciprocity Agreement – 1994/2008 |
Outlines the audit process used by jurisdictions to determine a carrier's level of compliance with all applicable safety standards. |
|
16 |
Entry Level Training (Class 1) (New, January 2020) |
A standard designed to ensure that Class 1 commercial truck drivers are properly and consistently trained before they are licensed. |
NSC Funding and Contribution Agreements
The NSC funding program is one of the ways TC works with the P/Ts to address motor carrier safety in Canada. TC's contribution is aimed at the development, revision, implementation, administration, and enforcement of NSC standards, as well as monitoring motor carrier safety performance. Overall, since 1987, the federal contribution under the NSC programs has been in excess of $140 million. The period under review in this report, focussed on the year 2019, is included in the 2015/16-2019/20 program ($22.2 million).
TC also contributes $60,000 a year to update enforcement training materials and the curriculum that assists Canadian jurisdictions to remain compliant with the roadside inspection standards of the Commercial Vehicle Safety Alliance (CVSA). This contribution is made through a renewed contract administered by the CCMTA. These funds are added to P/T resources in their respective motor carrier safety programs and are critical to smaller jurisdictions, allowing them to participate in the development and consistent implementation of nationally established safety rules applying to the truck and bus industry in Canada.
The consistent implementation of the NSC standards is the main objective of the contribution programs. However, the implementation of the revisions that are made to the standards, and which are agreed to by CCMTA, is not a condition for funding per se. The specific focus of the 2015/16-2019/20 contribution programs remains the implementation of the SFF, which requires the P/Ts to assign motor carriers a rating based on safety performance by incorporating collision, conviction and inspection data, as well as facility audit results, in a consistent, harmonized manner.
The SFF is embodied in revised NSC standards 7 (driver and carrier profiles), 14 (safety ratings) and 15 (facility audits) that were included into federal legislation under the revised MTVA in 2006. The P/Ts have agreed that these three standards will apply to all motor carriers (private/for-hire, extra and intra-provincial) so that similar safety and compliance performance result in a similar safety rating in each jurisdiction.
Changes to Performance Measures and Reporting Requirements
Removal of enforcement targets
Research has established that roadside inspections and facility audit activities have a positive impact on reducing collisions. Consequently, and consistent with the results and recommendations of an evaluation of the NSC that was conducted in 2003, the 2004/08 contribution agreements with the jurisdictions included requirements specifying the minimum number of roadside inspections and facility audits to be conducted every year.
However, for the 2009/10-2014/15 and 2015/16-2019/20 funding programs, these enforcement targets were removed at the P/Ts' request. P/Ts argued that mandatory audit target levels focused only on federally regulated motor carriers:
- diverted enforcement resources away from local motor carriers;
- did not allow them flexibility in deploying expensive audit resources and may have created inequities by diverting scarce resources to extra-provincial motor carriers that were not necessarily perceived to be at risk for future accidents and convictions, in comparison to local motor carriers that may have had a higher number of collisions or poorer compliance records;
- made the safety rating regime rigid and not sufficiently driven by accident, inspection and conviction data contained in the safety rating systems deployed in each jurisdiction.
As a result, and given the federal government's confidence in the P/Ts' commitment to maintain a sufficient level of enforcement, Transport Canada agreed to remove the performance targets. If the number of CVSA inspections and facility audits increase or remain relatively stable, then the enforcement level and TC's monitoring ability would likely not be impacted. However, a sharp drop in absolute number of audits or changes in the number or the types of CVSA inspections being conducted could create issues relative to the equity of enforcement of the NSC and MVTA requirements.
Therefore, it is important to monitor the number of roadside inspections and facility audits conducted by the P/Ts. Analysis of these enforcement data trends are instrumental in assessing the impact of this new approach. Pages 19-26 of this report present data up until 2019 and a summary statement is made on pages 27-28. As will be shown, at this time, the data does not indicate any significant nor systematic decrease in enforcement further to the removal of targets.
Changes in reporting requirements
Requirements to report on number of inspections and facility audits related to motor carriers are intended to ensure a relatively consistent and level enforcement playing field for extra-provincial motor carriers operating in Canada. Agreements prior to 2009 contained requirements for jurisdictions to report on the number of inspections and facility audits conducted on all (intra- and extra-provincial) motor carriers. However, for the 2009/10-2014/15 and 2015/16-2019/20 agreements, the reporting requirements were streamlined. Consequently, to continue to be eligible for TC funding, the P/Ts are currently required to report, by year:
- the total number of new safety fitness and active certificates issued by jurisdiction for extra-provincial truck and bus operators by year;
- the number of facility audits conducted on extra-provincial motor carriers;
- the total number of safety ratings assigned by category (i.e., satisfactory, satisfactory un-audited, conditional and unsatisfactory) to extra-provincial motor carriers;
- the total number of active intra-provincial motor carriers, but not the total number of safety ratings assigned by category to intra-provincial motor carriers, or the number of facility audits conducted on intra-provincial motor carrier.
Further to these changes in reporting requirements, TC remains in a position to monitor the split between extra- and intra-provincial motor carriers operating in each jurisdiction, since the total number of extra and intra-provincial motor carriers is still reported, allowing for historical analysis.
However, in the past, the statistics describing the intra-provincial safety rating categories were also reported, which provided a basis for evaluating where the focus of jurisdictional efforts was directed, relative to the safety fitness framework, between extra and intra-provincial motor carriers. It is possible that TC's ability to evaluate whether the safety fitness framework is being equitably applied to both intra- and extra-provincial motor carriers could be impacted by the change in reporting requirements. This potential issue is being monitored.
Some important provisions remain unchanged in the 2009/10-2014/15 and 2015/16-2019/20 funding agreements with regards to enforcement. The agreements still require the P/Ts to report, by year:
- the total number of accidents, inspections and convictions they exchange (transmit and receive) to and from other jurisdictions through the Inter-provincial Records Exchange (IRE) maintained by the CCMTA;
- the total number of full-time enforcement personnel dedicated to performing CVSA inspections and staff conducting facility audits. This data is used by TC to ensure relative consistency and equity in the application of the NSC and MVTA requirements to both extra- and intra-provincial motor carriers across Canada; and
- the total number of CVSA inspections levels 1 through 5. The different CVSA inspections are characterized by the thoroughness by which the drivers' paperwork and vehicle is inspected. Typically, level 1 inspections are more comprehensive and are more labour intensive and costly to deliver than other inspections under the CVSA program. Given that it is not possible, at roadside, to distinguish between extra- and intra-provincial drivers and vehicles, contrary to the above-mentioned issue relative to facility audits, these statistics include both.
Also unchanged in the latest agreements is the obligation for extra-provincial carriers to obtain a Safety Fitness Certificate issued by their base plate jurisdiction (where they are registered) and for each of the P/Ts to recognize the certificates issued by other jurisdictions as being valid. All the P/Ts have undertaken to assign safety ratings to their base plated carriers and to evaluate safety performance in a consistent manner.
2019 Status of Jurisdictional Implementation of NSC Standards
Table 2 and associated notes indicate that the P/Ts have undertaken the bulk of the work to implement NSC standards and MVTA requirements. NU is not included in the table because no roads currently join the territory to other parts of Canada. As such, commercial activity in NU is solely intra-provincial and not a federal responsibility.
|
NSC Standard |
TC |
BC |
AB |
SK |
MB |
ON |
QC |
NB |
NS |
PE |
NL |
YT |
NT |
|---|---|---|---|---|---|---|---|---|---|---|---|---|---|
|
General Requirements 1: 4,500kg> 2: Unique Identifier 3: Weight 4: Exemptions Footnote 1 5: Intra/extra |
MVTA Y Y Y Y Extra only |
Y Y 5000 (M) Footnote 2 Same |
Y Y 4500 (S) Some Footnote 3 Diff. |
Y Y 5000 (S) Some Footnote 4 Diff. |
Y Y 4500 Some Same |
Y Y 4500 Some Same |
Y Y 4500 Some Same |
Y Y 4500 N Same |
Y Y 4500 Some Same |
Y Y 4500 Some Same |
Y Y 4500 N Same |
Y Y 4500 Some Footnote 3 Diff |
Y Y 4500 Some Same |
|
Safety Certificate Operating Authority Footnote 5 |
MVTA |
Y Bus |
Y Bus Footnote 6 |
Y Bus |
Y Bus |
Y Bus |
Y Bus |
Y Bus Footnote 7 |
Y Bus |
Y Bus |
N Y Bus |
Y Bus |
Y |
|
Financial Responsibility Minimum $1,000,000 Dangerous Goods $2,000,000 Endorsement |
MVTA |
Y Y Y |
Y Y Y |
Y Y Y |
Y Y Y |
Y Y Y |
Y Y Y |
Y Y Y |
Y Y Y |
N N N(M) Footnote 8 |
Y Y Y |
Y Y Y |
Y Y N (M) Footnote 8 |
|
NSC 1 Single Driver Licence Concept |
N/A |
Y |
Y |
Y |
Y |
Y |
Y |
Y |
Y |
Y |
Y |
Y |
Y |
|
NSC 2 Knowledge and Performance Tests |
N/A |
Y |
Y |
Y |
Y |
Y |
Y |
Y |
Y |
Y |
Y |
Y |
Y |
|
NSC 3 Driver Examiner Training Program |
N/A |
Y |
Y |
Y |
Y |
Y |
Y |
Y |
Y |
Y |
Y |
Y |
Y |
|
NSC 4 Classified Driver Licensing System |
N/A |
Y |
Y |
Y |
Y |
Y(M) Footnote 9 |
Y |
Y |
Y |
Y |
Y |
Y |
Y |
|
NSC 5 Self Certification and Procedures Footnote 10 |
N/A |
Y |
Y |
Y |
Y |
Y |
Y |
N/A |
Y |
N/A |
N/A |
N/A |
Y |
|
NSC 6 CCMTA Medical Standards for Drivers – Frequency Footnote 11 |
N/A |
Y |
Y (M) |
Y |
Y(M) |
Y |
Y(M) |
Y |
Y |
Y |
Y |
Y |
Y |
|
NSC 7 Carrier/Driver Profiles |
MVTA |
Y |
Y |
Y |
Y |
Y |
Y |
Y |
Y |
Y |
Y |
Y |
|
|
NSC 8 Short Term Suspension |
N/A |
Y |
Y |
Y |
Y |
Y |
Y |
Y |
Y |
Y |
Y |
Y |
Y |
|
NSC 9 Hours of Service Footnote 13 |
Y Jan 1/07 |
Y March 1/07 Footnote 15 |
Y(S) |
Y(S) |
Y June 1/07 |
Y Jan 1/07 |
Y June 15/07 |
Y June 30/07 |
Y Dec/09 |
Y Jan 1/07 |
Y Jan 1/07 |
Y May 1/08 |
Y Jan 1/09 |
|
NSC 10 Cargo Securement Footnote 15 |
N/A |
Y |
Y |
Y |
Y |
Y |
Y |
Y |
Y |
Y |
Y |
Y |
Y |
|
NSC 11 Commercial Vehicle Maintenance and Periodic Inspection requirements Footnote 16 |
NA |
Y |
Y |
Y |
Y |
Y |
Y |
Y |
Y |
Y |
Y |
Y |
N (M) Footnote 17 |
|
NSC 12 CVSA On-Road Inspections |
N/A |
Y |
Y |
Y |
Y |
Y |
Y |
Y |
Y |
Y |
Y |
Y |
Y |
|
NSC 13 Trip Inspection Footnote 18 |
N/A |
TBD |
Y Jul 1/09 |
Y Motorcoach 2012 Footnote 19 |
Y July 1/08 |
Y (M) July 1, 2018 |
Y Nov 2016 |
TBD |
Y Feb 1, 2018 |
Y April 1/09 |
Y July 1 2012 |
Y Aug 1/08 |
Y Dec 2011 |
|
NSC 14 Safety Rating System and Procedures |
MVTA |
Y (M) |
Y |
Y |
Y |
Y |
Y |
Y |
Y |
Y |
Y |
Y |
Y |
|
NSC 15 Facility Audit |
MVTA |
Y |
Y |
Y |
Y |
Y |
Y |
Y |
Y |
Y |
Y |
Y |
Y |
|
Key: Y = Regulatory requirements in place Notes: |
|||||||||||||
Variance from Full Implementation of the NSC by Jurisdiction
While it has been a general objective of the NSC that intra- and extra-provincial motor carriers are treated in like manner, each jurisdiction under the original NSC agreement is free to set different regulatory rules and record keeping requirements for truck and bus companies that operate wholly within their province or territory. Deviations to the NSC therefore do exist in the country and it is one of the core mandates of the annual reports to Parliament to document them. Table 2 presents detailed information relative to how the NSC standards were implemented in Canada in 2019 and identifies variations with the standards, whether they are minor or significant, as well as cases where intra- and extra-provincial carriers are treated differently. The table was circulated to the P/Ts and updated based on their input. As such, a deviation remains recorded from the previous year's report unless a jurisdiction specifically indicates that it has been removed.
Many of the variances are minor and have existed for a number of years. Some jurisdictions may be inclined to leave them in place until more substantial amendments are made to their regulations.
The NSC standards are dynamic and are periodically reviewed and updated to address contemporary issues in the motor carrier industry in Canada. Variances can occur due to different jurisdictional legislative priorities and obtaining resources to implement changes of revised NSC standards. Thus, in any given year, there can be higher or lower variances in consistency relative to the full implementation of the NSC. Historically, however, jurisdictions have typically moved to eliminate those inconsistencies over a longer time frame. As shown below, deviations can be related to general requirements or provisions of the NSC framework or they can be related to specific NSC standards.
Variances with Regard to General Provisions of the NSC
The NSC standards are meant to apply to all commercial vehicles that weigh more than 4,500 kg, whether they are considered as intra- or extra-provincial. Table 2 shows that except for BC, AB, SK and YK, the P/Ts have implemented this general requirement. BC varies only slightly from the NSC requirement; this is tied to the fact that the registration and insurance system are being maintained by a different agency. This deviation is therefore considered to be minor and unlikely to be changed.
In the case of AB, YK and SK, the NSC weight threshold for extra-provincial motor carriers is set at 4,500 kg (AB, YK) and 5,000 kg (SK). However, in AB and YK the NSC weight threshold applies to all intra-provincial motor carriers at 11,794 kg or more, while in SK the application of NSC standards to intra-provincial motor carriers was set at 11,000kg until 2014, when it was increased to 11,794 like in AB and YK.
This means that in AB, SK and YK the full NSC applies only to intra-provincial vehicles that are over these weight thresholds. Vehicles below these thresholds, which operate wholly within these provinces, are exempted from the application of numerous NSC standards (e.g. hours of service rules, trip inspection and annual inspection, the safety rating program, etc.). While this variance is significant, these vehicles generally do not travel outside these provinces.
Variances with Regard to Specific NSC Standards
The 2019 data indicate that most jurisdictions continue to exempt some types of vehicles from the NSC program in their local regulations. These include municipal and farm vehicles, ambulances, fire trucks, hearses and some vehicles used in specific trades (e.g., plumbers). Since these vehicles are typically used locally, these deviations to NSC requirements do not generally affect extra-provincial truck and bus operations.
Three jurisdictions (AB, SK and YK) continue to treat extra- and intra-provincial carriers differently in their regulations. BC exempts trucks with GVWR of 11,794 kg or less from requirements to comply with the hours of service (HoS) regulations. By policy, BC does not enforce HoS requirements on commercial motor vehicles between 5,000 and 11,794 kg for both intra- and extra-provincial carriers.
Nearly every P/T has implemented the financial responsibility (insurance) and application process requirements of the MVTA and the NSC. PE and NT have yet to complete and implement outstanding regulatory requirements as of 2019.
In 2019, AB introduced a pre-entry program which eliminated temporary Safety Fitness Certificates (SFC). AB is now requiring that federally and provincially regulated carriers complete a SFC course and pass a test prior to acquiring a certificate. Carrier must also complete a new carrier compliance review within 12 months of operation. AB has also now included a SFC renewal process and streamlined the requirements for bus operators to obtain an operating authority.
With regard to the Commercial Vehicle Drivers Hours of Service Regulations, table 2 indicates that 11 of 13 jurisdictions had implemented revised provincial rules by the end of 2019. AB and SK have yet to implement provincial hours of service rules that mirror federal regulations. In those two provinces, the federal regulations apply to extra-provincial carriers only and different regulations apply to intra-provincial carriers.
Table 2 confirms incremental progress on the implementation of the revised trip inspection standard. As of 2019, only two provinces (BC and NB) had yet to implement the revised standard.
In 2019, the Entry Level Training (ELT) working group was created within CCMTA. The group was established to develop a national minimum entry level training program for commercial truck drivers in Canada. The work would build on recently completed updates on NSC standards #2, 3 and 4, as well as work done in AB, SK, MB and ON on their respective programs. The ELT working group reported at the CCMTA annual meeting that key national stakeholders were notified about the work and invited to provide comments on the development of a new ELT NSC standard that will form the basis for ELT in Canada.
2019 Status of Safety Fitness Framework
Table 3 presents the 2019 jurisdictional status regarding the implementation of the amended MVTA (2006) and the NSC standards included in the safety rating system. A note that the amended MVTA continued the focus of the 1987 amendments to the Act, when economic regulation of the industry was replaced by a focus on safety. The 2006 amendments consolidated the focus on safety fitness and were intended to create a nationally consistent safety fitness framework for motor carriers. In brief, the amendments require extra-provincial carriers to have a safety fitness certificate, which is to be issued by provincial authorities consistently throughout the country, on the basis of NSC 14 – Safety Rating, creating a uniform national safety regime.
The table indicates that the P/Ts have made further incremental progress to reduce the variances in safety rating requirements that were noted by Knowles in 2004 in an evaluation of the state of readiness of Canadian jurisdictions to implement the revised MVTAFootnote 2. Table 3 is discussed in the next section addressing the implementation of the general provisions of the revised MVTA.
|
MVTA Components Footnote 1 |
TC |
BC |
AB |
SK |
MB |
ON |
QC |
NB |
NS |
PE |
NL |
YT |
NT |
|---|---|---|---|---|---|---|---|---|---|---|---|---|---|
|
1) General |
MVTA |
Y |
Y |
Y |
Y |
Y |
Y |
Y |
Y |
Y |
Y |
Y |
Y |
|
2) Identifies poor operators |
N/A |
Y |
Y |
Y |
Y |
Y |
Y |
Y |
Y |
Y |
Y |
Y |
Y |
|
3) Adopted four stage intervention model Footnote 2 |
N/A |
Y(M) Footnote 3 |
Y |
Y(M) Footnote 3 |
Y |
Y |
Y |
Y |
Y |
Y |
Y |
Y |
|
|
4) Base plate carriers only monitored |
N/A |
Y |
Y |
Y |
Y |
Y |
Y |
Y |
Y |
Y |
Y |
Y |
Y |
|
5) U.S. carriers in safety rating regime Footnote 4 |
N/A |
N |
N |
N |
N |
N |
N |
N |
N |
N |
N |
||
|
6) Applications/insurance provision |
N/A |
Y |
Y |
Y |
Y |
Y |
Y |
N(S) Footnote 6 |
Y |
Y |
Y |
Y |
|
|
7) All NSC Vehicles |
N/A |
Y |
Y(M) Footnote 7 |
Y(M) Footnote 7 |
Y |
Y |
Y |
Y |
Y |
Y |
Y |
Y (M) Footnote 7 |
Y |
|
8) All carriers evaluated on 24 month basis of data |
N/A |
Y(M) Footnote 8 |
Y(M) Footnote 8 |
Y(M) Footnote 8 |
Y |
Y |
Y |
Y |
Y |
Y |
Y |
Y |
Y |
|
9) All carrier collision, inspection and convictions exchanged |
N/A |
Y |
Y |
Y |
Y |
Y |
Y |
Y |
Y |
Y |
Y |
Y |
Y |
|
10) All facility audits per NSC Standard 15 |
N/A |
Y |
Y |
Y |
Y(M) Footnote 9 |
Y |
Y |
Y |
Y |
Y |
Y |
Y(M) Footnote 9 |
|
|
11) Assign/change safety ratings based on 4 rating categories |
MVTA |
Y(M) Footnote 10 |
Y(M) Footnote 10 |
Y |
Y |
Y(M) Footnote 10 |
Y(M) Footnote 12 |
Y |
Y |
Y |
|||
|
12) All elements of safety rating standard 14 Implemented (e.g. safety plans) |
N/A |
Y |
Y |
Y |
Y |
Y(M) Footnote 14 |
Y(M) Footnote 14 |
Y |
Y |
Y |
Y |
Y |
|
|
13) All collisions pointed per severity formula (e.g. 2, 4, 6 points) |
N/A |
Y |
Y |
Y |
Y |
Y |
Y |
Y |
Y |
Y |
Y |
Y |
Y |
|
14) Use CCMTA conviction equivalency table |
N/A |
Y(M) Footnote 17 |
Y |
Y |
Y |
Y |
Y |
Y |
Y |
Y |
Y |
Y |
Y |
|
15) At fault preventability of collisions Assessed |
N/A |
Y |
Y |
Y |
Y |
Y |
Y |
Y |
Y |
Y |
Y |
Y |
Y |
|
16) Receive and use U.S. data in safety rating system Footnote 15 |
N/A |
Y |
Y |
Y |
Y |
UNK |
UNK |
UNK |
UNK |
UNK |
N TBD Footnote 15 |
Y |
Y |
|
17) Exchanges carrier information electronically with other jurisdictions |
N/A |
Y |
Y |
Y |
Y |
Y |
Y |
Y |
Y |
Y |
Y |
Y |
|
|
Key: Y = Regulatory requirements in place Notes: |
|||||||||||||
2019 Status of Implementation of the MVTA
The previous annual report to Parliament presented a 7-year review covering the 2012-2018 periodFootnote 3. Detailed information on the various processes involved in the implementation of the MVTA and the SFF, as well as regional differences in the country, were presented in this review. This information is therefore not repeated here if no changes have occurred in 2019. The reader is referred to this earlier edition for a more comprehensive discussion.
Overall, table 3 indicates that the P/Ts have developed and implemented a generally consistent safety rating regime based on the MVTA amendments and that they are issuing safety ratings to their base plate motor carriers. The only noticeable change from 2018 to 2019 is that YT indicated that starting in 2019 they are now including U.S. data in their safety rating system.
CCMTA Safety Fitness Framework review
In 2017, industry raised the issue of potential inconsistencies across jurisdictions with regards to the SFF and how carriers are being rated based on their safety performance. Following-up on these discussions, in 2019 CCMTA conducted a review of how NSC standards # 7, 14, 15 are being applied throughout the country. As per the assessments conducted in Transport Canada's current and previous annual reports to Parliament, this review concluded that there are indeed variances in how each jurisdiction monitors carriers including, for example, the length of time events are kept on record and how facility audits are being conducted. It was however emphasized that all jurisdictions are identifying unsafe carriers, although through their own algorithms, and that there are no gross differences in how a carrier would be rated in each jurisdiction.
Progress with the development of Electronic Logging Devices
Electronic Logging Devices (ELDs) help to ensure that a commercial driver's work and rest hours are recorded accurately and reliably. These devices are intended to replace paper-based daily logs, which can be falsified or incomplete, and, in some cases, duplicated or missing.
Although research and consultative efforts on this issue can be traced back to 2005, the 2009-2019 period saw the most intense development taking place from the federal government as well as from the P/Ts, both individually and within CCMTA. This 10-year period was indeed critical for the development of the mandatory use of ELDs to enforce compliance with hours of service regulations in Canada.
On December 16, 2017, Transport Canada published the Regulations Amending the Commercial Vehicle Drivers Hours of Service Regulations (Electronic Logging Devices and Other Amendments) in the Canada Gazette Part 1. The final publication, in Canada Gazette Part 2, took place on June 12, 2019. The coming-into-force date was set to be 24-months after publication of Part 2, therefore on June 12, 2021.
While this regulatory work was taking place, a significant effort was also undertaken by provincial and federal representatives within CCMTA's ELD Technical Standard working group to develop the Canadian ELD Standard. This standard establishes minimum performance and design specifications for ELDs, which are largely based on U.S. technical requirements, but adapted to accommodate the Canadian HS regulations. Version 1.1 of the standard was published on December 9, 2019, and the standard is incorporated by reference in the final federal hours of service regulations.
Note that in order to provide a high level of confidence in the effectiveness of the ELDs, a third-party certification process was determined to be the most reliable method for ensuring that ELD models and software versions will be compliant with the Technical Standard and the regulations. To that end, in 2019 Transport Canada entered into an agreement with the Standards Council of Canada for the accreditation of certification bodies that ELD vendors will be using to certify ELD devices.
2019 Status of Jurisdictional Enforcement of the MVTA and NSC Standards
Enforcement of the NSC standards comprises two components: CVSA on-road inspections and facility audits. TC's funding to jurisdictions is tied in part to jurisdictions performing both components. This approach is taken because studies have demonstrated a positive impact on safety.
The elimination of the performance targets for CVSA inspections and facility audits and the streamlining of the reporting requirements may however impact TC's ability to assess equity between extra- and intra-provincial motor carriers and formulate an overall view of commercial vehicle safety in Canada.
It is possible that with less data to review, the picture will become more limited and fragmented than in past years. A mitigating variable is that P/Ts still report on CVSA inspections and the audits conducted on extra-provincial carriers, although no targets have been established. Future assessments will determine the extent of the impact.
The data presented below come from jurisdictional reports supplied to TC based on the revised reporting requirements contained in last two funding agreements.
CVSA On-Road Inspections
Research has repeatedly established that conducting roadside inspections of commercial vehicle drivers and vehicles has positive impacts on compliance rates and safety. Trained P/T inspectors conduct these inspections at roadside, weigh scales and motor carrier facilities based on inspection procedures and criteria created by CVSA, known as the North American Standard Inspection Program.
In Canada, the out-of-service (OoS) criteria developed by CVSA is specified in NSC standard 12 CVSA on-road inspections, which is updated annually. NSC 12 focusses on four key areas: driver, vehicle, dangerous goods and administrative compliance. CVSA inspections now include up to eight levels, however levels 1 to 5 are used on a more regular basis, with level 1 representing the most comprehensive inspection procedureFootnote 4.
Prior to the removal of CVSA inspection targets in 2008/09, the P/Ts were generally exceeding the targets, indicating fairly robust enforcement activities in all jurisdictions. As can be seen in table 4 and figure 1, this trend continues as the removal of targets did not result in a reduction of the total number of inspections. From a national perspective, there is in fact an upward trend after the removal of targets, as can be seen in figure 1.
Of note, the 331,511 inspections conducted in 2009/10 and the 320,982 conducted in 2010/11 exceed all other years where targets were in effect, with only the year 2005/06 having higher totals for CVSA inspections. As can be seen in table 4, there are only a few instances (yellow) where inspection numbers fall below the former targets levels, but the national picture is nevertheless trending upwards.
|
|
TargetsFootnote * |
08/09 |
09/10 |
10/11 |
11/12 |
12/13 |
13/14 |
14/15 |
15/16 |
16/17 |
17/18 |
18/19 |
|
|---|---|---|---|---|---|---|---|---|---|---|---|---|---|
|
BC |
22,545 |
27,786 |
27,382 |
26,089 |
27,762 |
31,865 |
29,454 |
25,556 |
22,996 |
22,098 |
23,305 |
23,071 |
|
|
AB |
21,724 |
30,986 |
32,013 |
36,720 |
32,119 |
32,771 |
30,156 |
30,913 |
25,947 |
28,124 |
28,367 |
27,694 |
|
|
SK |
8,555 |
11,438 |
17,860 |
15,218 |
13,052 |
9,943 |
11,462 |
13,904 |
13,963 |
15,808 |
12,617 |
8,425 |
|
|
MB |
6,445 |
6,680 |
7,494 |
6,189 |
4,837 |
3,541 |
3,841 |
4,876 |
3,804 |
3,804 |
7,125 |
6,610 |
|
|
ON |
77,153 |
90,288 |
104,120 |
95,513 |
102,807 |
102,651 |
110,345 |
120,960 |
119,548 |
113,412 |
142,782 |
96,969 |
|
|
QC |
26,943 |
56,928 |
100,440 |
96,320 |
35,408 |
65,204 |
73,620 |
79,328 |
95,029 |
85,058 |
97,620 |
106,027 |
|
|
NB |
5,642 |
25,422 |
28,991 |
29,808 |
26,714 |
25,729 |
26,013 |
24,962 |
20,117 |
11,710 |
12,973 |
11,664 |
|
|
NS |
3,961 |
7,801 |
7,502 |
10,145 |
10,618 |
7,987 |
9,578 |
8,971 |
9,390 |
9,354 |
10,908 |
11,624 |
|
|
PE |
1,036 |
2,381 |
2,160 |
1,677 |
1,759 |
1,521 |
1,154 |
1,779 |
1,267 |
1,239 |
1,361 |
1,277 |
|
|
NL |
1,243 |
1,265 |
1,748 |
1,986 |
1,765 |
1,636 |
1,157 |
1,047 |
1,333 |
1,941 |
1,349 |
1,411 |
|
|
YK |
562 |
657 |
909 |
782 |
892 |
801 |
629 |
770 |
605 |
682 |
627 |
704 |
|
|
NT |
1,584 |
644 |
892 |
535 |
635 |
1,021 |
834 |
840 |
1,120 |
741 |
935 |
963 |
|
|
Tot |
179,495 |
262,276 |
331,511 |
320,982 |
258,368 |
284,670 |
298,213 |
313,906 |
315,119 |
293,971 |
339,969 |
296,439 |
|
Figure 1: Number of CVSA roadside inspections in Canada per fiscal year before and after the 2009/10 removal of targets
Text description
| Year | Total |
|---|---|
| Target* | 179,495 |
| 05-06 | 347,256 |
| 06-07 | 306,908 |
| 07-08 | 302,275 |
| 08-09 | 262,276 |
| 09-10 | 331,511 |
| 10-11 | 320,982 |
| 11-12 | 258,368 |
| 12-13 | 284,670 |
| 13-14 | 298,213 |
| 14-15 | 313,906 |
| 15-16 | 315,119 |
| 16-17 | 293,971 |
| 17-18 | 339,969 |
| 18-19 | 296,439 |
RoadCheck 2019
Operation Roadcheck is a 72-hour safety inspection program undertaken yearly by Canadian, US and Mexican enforcement officers to promote motor carrier safety. The event is coordinated by CVSA in partnership with CCMTA member jurisdictions. Heavy vehicles are randomly selected for inspection according to procedures developed by CVSA. Brakes, steering, wheels, tires, frames and the manner in which loads were secured are inspected, as well as driver documentation for compliance with licensing and HoS rules.
The results do not account for vehicles waved through and considered ‘passed' due to the presence of a valid CVSA decal. Only vehicles without a valid CVSA inspection decal are inspected and reported on. The implication of this sampling method is that the results of Roadcheck in terms of OoS rates should not be extrapolated to the overall population of motor carriers.
CVSA presented high level results of Roadcheck 2019 at the CCMTA annual meeting. It was stated that 6,797 commercial vehicles were inspected across provinces and territories, resulting in a total out-of-service rate of 20.6%. Despite ongoing efforts, brake-related defects continue to comprise nearly half of all OoS violations cited during roadside inspections: this year's results showed 46.4% of OoS violations.
Facility Audits
Conducting a facility audit involves a certified auditor visiting a motor carrier's principal place of business in order to conduct comprehensive assessments. Audits are conducted on the basis of a procedure defined in NSC Standard # 15 Facility Audits. As stated in the standard, it consists of a detailed examination of specific records, interviews with safety personnel as well as data collected during CVSA inspections. Audits serve as a means of evaluating a carrier's safety compliance and performance with respect to the identification of violations. The results are used in conjunction with the carrier profile (see NSC Standard # 7 Carrier and Driver Profiles) to establish the carrier safety rating (NSC Standard # 14 Carrier Safety Rating). Audits must be quantifiable, uniformly delivered within each jurisdiction and compatible with other jurisdictions. They are conducted by trained jurisdictional staff.
Facility audits are used to assign a satisfactory, conditional (in most jurisdictions) or unsatisfactory rating. The results of an audit typically require motor carriers to implement steps to improve safety and compliance performance within set time frames. If safety and compliance performance does not improve or becomes worse, the P/T may declare the motor carrier unsatisfactory and revoke the safety certificate, which prevents the carrier from operating on Canadian roads.
Research has established that conducting facility audits has positive impacts on subsequent safety and compliance rates. It was for this reason that TC included minimum targets for audits in the contribution program with the P/Ts in former contribution agreements. However, as mentioned, as of 2009/10 the P/Ts are no longer required to meet these minimum audit targets and are no longer required to report on the number of audits conducted on intra-provincial motor carriers.
P/Ts have historically consistently met the annual audit targets specified in the previous TC funding agreements, conducting usually significantly more audits than the minimum required. This may be due to the safety rating system prompting jurisdictions to conduct audits based on collision, inspection and conviction data recorded against motor carriers in their respective carrier profiles.
Table 5 shows that, for the years under the former funding agreements, the number of audits peaked in 2005/06 at 2,258 and declined in the following years, down to 1,857 audits in 2007/08. Note that no comparison can be made with the subsequent years (starting 2009/10), which reflect the situation under the new contribution agreements, where no audit targets were set and where the P/Ts stopped reporting on the number of audits conducted on intra-provincial motor carriers. Given that both changes occurred simultaneously, it is not possible to assess the impact of target removal on the number of audits conducted. Table 5 however indicates that for those subsequent years (2009/10 to 2018/19), the nationally aggregated number of audits conducted on extra-provincial motor carriers remained fairly stable, suggesting that if the removal of targets had an effect, this effect has for now remained rather constant.
|
|
05/06 |
06/07 |
07/08 |
08/09 |
09/10Footnote * |
10/11 |
11/12 |
12/13 |
13/14 |
14/15 |
15/16 |
16/17 |
17/18 |
18/19 |
|---|---|---|---|---|---|---|---|---|---|---|---|---|---|---|
|
BC |
349 |
340 |
300 |
295 |
205 |
251 |
253 |
190 |
126 |
80 |
45 |
47 |
52 |
61 |
|
AB |
252 |
206 |
221 |
339 |
182 |
395 |
377 |
368 |
339 |
318 |
319 |
347 |
323 |
352 |
|
SK |
125 |
133 |
82 |
80 |
129 |
30 |
32 |
49 |
79 |
101 |
141 |
156 |
134 |
205 |
|
MB |
85 |
86 |
125 |
92 |
48 |
56 |
58 |
62 |
58 |
36 |
51 |
51 |
25 |
54 |
|
ON |
747 |
803 |
496 |
681 |
237 |
200 |
211 |
269 |
248 |
278 |
175 |
152 |
158 |
149 |
|
QC |
456 |
279 |
292 |
252 |
92 |
229 |
99 |
69 |
103 |
88 |
122 |
175 |
150 |
130 |
|
NB |
71 |
85 |
81 |
79 |
65 |
94 |
98 |
155 |
113 |
61 |
93 |
47 |
76 |
68 |
|
NS |
129 |
137 |
215 |
173 |
31 |
12 |
25 |
7 |
17 |
26 |
43 |
36 |
17 |
53 |
|
PE |
15 |
15 |
17 |
13 |
13 |
13 |
13 |
13 |
13 |
13 |
13 |
13 |
13 |
13 |
|
NL |
23 |
21 |
21 |
21 |
2 |
1 |
22 |
20 |
21 |
3 |
3 |
3 |
3 |
3 |
|
YK |
3 |
3 |
4 |
3 |
3 |
4 |
7 |
7 |
8 |
6 |
6 |
6 |
8 |
8 |
|
NT |
3 |
3 |
3 |
3 |
0 |
3 |
2 |
1 |
3 |
3 |
3 |
3 |
3 |
3 |
|
Tot |
2,258 |
2,111 |
1,857 |
2,031 |
1,007 |
1,288 |
1,197 |
1,210 |
1,128 |
1,013 |
1,014 |
1,036 |
962 |
1,099 |
As can be seen in table 5, there can be significant yearly variations in the number of audits conducted by the P/Ts; some showing decreasing trends while others are increasing. Nevertheless, as shown in figure 2, the nationally aggregated numbers remain rather stable. Globally there is a mild decreasing trend after the year 2012/13, partly explained by an actual spike in audits for the years 2010/11to 2013/14. Furthermore, table 5 data reveals that the decreasing trend is mainly reflective of one jurisdiction where the number of audits has dropped significantly and steadily since 2012/13, and another one where a milder decrease is noticeable after 2015/16. However, given that these decreases were initiated years after the removal of targets, it is safe to think that they are probably due to internal jurisdictional factors rather than target removal in the contribution agreements.
Figure 2: Number of facility audits conducted on extra-provincial motor carriers in Canada per fiscal year after the 2009/10 removal of targets
Text description
| Years | Facility audits (Total) |
|---|---|
| 09-10 | 1007 |
| 10-11 | 1,288 |
| 11-12 | 1,197 |
| 12-13 | 1,210 |
| 13-14 | 1,128 |
| 14-15 | 1,013 |
| 15-16 | 1,014 |
| 16-17 | 1,036 |
| 17-18 | 962 |
| 18-19 | 1,099 |
Data Exchange
The safety rating framework and the NSC funding contribution agreements require the P/Ts to exchange collision, inspection and conviction data. The data is used in determining safety ratings and disciplining motor carriers. The exchange of collision, inspection and conviction data is therefore critical to ensure the robustness, comprehensiveness and completeness of the safety rating established by each jurisdiction for motor carriers under its supervision.
The CCMTA Canadian Conviction Equivalency Code tables are a reference tool that establishes equivalency of offences across the P/T legislative and regulatory frameworks. This enables jurisdictions to take appropriate action based on a common understanding of the severity of the infraction.
Table 6 summarizes the 2012-2019 eight-year trend in the volume of exchange of conviction information between jurisdictions. The values in the table represent the total number of convictions sent to other P/Ts by each jurisdiction for each of these eight years.
|
Year |
2011/12 |
2012//13 |
2013/14 |
2014/15 |
2015/16 |
2016/17 |
2017/18 |
2018/19 |
|---|---|---|---|---|---|---|---|---|
|
Total |
59,201 |
62,607 |
62,385 |
75,902 |
86,911 |
100,561 |
73,359 |
75,049 |
P/Ts began using conviction information from other jurisdictions in their safety rating systems around 2002. The historical data indicates that the number of convictions exchanged remained relatively stable and consistent from 2005 to 2009. However, a significant increase in the number of convictions exchanged among jurisdictions occurred in the 2009/10 year. Then, as shown in table 6, there was an upwards trend in the volume of conviction data sent by jurisdictions during the 2011/12-2018/19 period. This is likely due to continuous enhancements made in individual jurisdictional systems to process the convictions. Overall, for the period, the data suggests that the safety fitness framework is functioning properly as more data is being exchanged and processed.
Jurisdictional Staffing Levels
The number of jurisdictional staff dedicated to enforcement activities can be used as an indicator of the level of effort, across the country, to support the SFF and to enforce motor vehicle safety regulations and NSC standards. The reporting requirements associated with the funding agreements specify that P/Ts have to report the number of roadside inspectors and facility auditors on staff. Table 7 summarizes the number of personnel involved in the on-road and audit enforcement of the MVTA from 2012/13 to 2018/19. Historically P/T staffing levels have fluctuated and are affected by retirements, government priorities and budgets relative to filling vacant positions. Data from past reports to Parliament indicate that P/T staffing of on-road (CVSA inspections) personnel peaked in 2008/09 with 1,203 enforcement officers, while a peak of 112 full time equivalent (FTE) staff performed audits of motor carriers in 2007/08.
Table 7 shows that staffing levels have remained relatively stable over these 7 years, although there has been a mild decreasing trend in the number of auditors. However, as discussed previously, the output of this workforce - the number of CVSA inspections and facility audits - remains fairly constant.
|
Years |
2012 - 2013 FTEs |
2013 -2014 FTEs |
2014 – 2015 FTEs |
2015-2016 FTEs |
2016-2017 FTEs |
2017-2018 FTEs |
2018-2019 FTEs |
|||||||
|---|---|---|---|---|---|---|---|---|---|---|---|---|---|---|
|
|
Road |
Audit |
Road |
Audit |
Road |
Audit |
Road |
Audit |
Road |
Audit |
Road |
Audit |
Road |
Audit |
|
BC |
180 |
17 |
175 |
17 |
184 |
16 |
179 |
14 |
176 |
13 |
186 |
13 |
149 |
14 |
|
AB |
132 |
9 |
104 |
9 |
94 |
9 |
95 |
9 |
94 |
9 |
100 |
9 |
97 |
9 |
|
SK |
22 |
3 |
30 |
4 |
42 |
5 |
48 |
6 |
47 |
6 |
35 |
6 |
27 |
6 |
|
MB |
42 |
8 |
42 |
8 |
42 |
7 |
42 |
7 |
42 |
7 |
42 |
6 |
42 |
6 |
|
ON |
306 |
33 |
288 |
29 |
303 |
28 |
290 |
28 |
281 |
27 |
280 |
27 |
280 |
27 |
|
QC |
252 |
19 |
252 |
19 |
258 |
17 |
245 |
18 |
237 |
20 |
275 |
15 |
270 |
17 |
|
NB |
36 |
3 |
46 |
3 |
49 |
3 |
54 |
3 |
43 |
3 |
44 |
3.5 |
44 |
3 |
|
NS |
45 |
3 |
38 |
3 |
38 |
2 |
43 |
3 |
43 |
3 |
41 |
2 |
49 |
2 |
|
PE |
11 |
1 |
11 |
1 |
12 |
1 |
13 |
1 |
11 |
1 |
11 |
1 |
11 |
1 |
|
NL |
14 |
1 |
15 |
1 |
15 |
1 |
29 |
7 |
34 |
7 |
34 |
6 |
34 |
1 |
|
YK |
3 |
.1 |
3 |
.1 |
3 |
.1 |
3 |
.1 |
3 |
.1 |
2 |
.1 |
3 |
1 |
|
NT |
10 |
1 |
8.5 |
1 |
9 |
1 |
10 |
1 |
9 |
.1 |
9 |
1 |
8 |
1 |
|
Total |
1,053 |
98.1 |
1,012.5 |
95.1 |
1,049 |
90.1 |
1,051 |
97.1 |
1,020 |
97.1 |
1,059 |
89.6 |
1,014 |
87.1 |
|
Key: FTEs = Full Time Employees Note: This table does not include staffing for administering other NSC standards. |
||||||||||||||
It is important to note that this table does not include all of the personnel that are used by jurisdictions to administer and enforce the MVTA and NSC standards. For example, all jurisdictions have staff that conduct knowledge and road tests, verify medicals and regulate the garages that perform annual inspections. Moreover, the table does not include the staff that process NSC/MVTA applications, perform policy analysis, or the IT resources in each jurisdiction that build the motor carrier monitoring systems and integrate the data used in assigning and rating motor carriers. The contribution agreements between TC and the jurisdictions do allow jurisdictions to recoup a small portion of staff costs for administering the regulations for extra-provincial motor carriers but only for those staff directly involved in CVSA roadside inspections and audit enforcement.
Part I Summary
The regulatory update presented in Part I is partly based on data reported by the P/Ts in a comprehensive survey conducted by Transport Canada. The review centers on three key components: the status of implementation of NSC standards in Canada, the national implementation of the MVTA safety fitness regime and enforcement efforts conducted by P/Ts in support of the NSC and the MVTA.
Table 2 provided comprehensive details on deviations from NSC standards across the country. Deviations can be related to general requirements of the NSC framework or to specific NSC standards. In terms of general requirements, for example, it is important to note that NSC standards are meant to apply to all commercial vehicles that weight more than 4,500 kg, whether they operate as intra- or extra-provincial motor carriers. In this regard, the data indicate that AB, SK and YK have not implemented this general requirement. As a result, in these provinces, safety programs and regulations are not the same for intra- and extra-provincial motor carriers.
In 2019, AB introduced a pre-entry program which eliminated temporary Safety Fitness Certificates (SFCs). AB is now requiring that federally and provincially regulated carriers complete a SFC course and pass a test prior to acquiring a certificate. Carrier must also complete a new carrier compliance review within 12 months of operation.
With regard to hours of service regulations, the data shows that AB and SK have yet to implement provincial hours of service rules that mirror the federal regulations. In those two provinces, the federal regulations apply to extra-provincial carriers only and different regulations apply to intra-provincial carriers.
Regarding the safety fitness framework, the data presented in table 3 indicate that a fairly consistent safety rating system has been implemented by the P/Ts across Canada. The only change reported in 2019 is that NL is now receiving and using data from the U.S. in their safety rating system.
Under the 2009/10-2014/15 and 2015/16-2019/20 funding agreements with the P/Ts, TC continues to focus on achieving a consistent safety fitness regime in all jurisdictions to ensure equity in treatment between extra and intra-provincial motor carriers. The overall assessment for 2019 is that the P/Ts have implemented safety rating regimes which, for the most part, are compatible with the MVTA and safety fitness requirements.
With respect to the absence of performance targets in the 2009/10-2014/15 and 2015/16-2019/20 funding agreements, the evidence indicates that the level of enforcement effort after 10 years under the new reporting requirements has remained stable. The number of facility audits conducted have remained rather constant under the new agreements, even though no comparison can be made with the situation under the old regime, given concurrent changes in reporting requirements. Furthermore, in the year 2017/18, there were 77,693 more CVSA inspections conducted in Canada compared to 2008/09, which was the last year under the old regime. This represents a 30% increase following the removal of performance targets. There is also no evidence to suggest that the P/Ts have elected to perform the less costly and time-consuming type of CVSA inspections. To the contrary, the evidence suggests that a relatively robust, stable and dynamic safety fitness framework has been implemented in the P/Ts.
It is possible that assessing the equity in application of the SFF to both extra-and intra-provincial carriers in the absence of reporting on intra-provincial audit results and safety ratings could be more challenging. However, the P/Ts are still reporting on audits conducted on extra-provincial motor carriers, which is TC's primary responsibility under the MVTA. The number of audits conducted on extra-provincial motor carriers has remained fairly stable over the last 10 years. The nationally aggregated data does indicate a mild downward trend from 2013/14 to 2017/18, however this is mainly explained by a peak in audits during the 2010/11-2012/13 period and a steady decrease observed in one jurisdiction since 2012/13, likely the result of internal issues rather than the removal of targets.
Going forward, TC will continue to monitor and assess what impact, if any, the removal of performance targets has on the safety fitness framework, with particular emphasis on extra-provincial motor carriers.
Part 2 - Commercial Vehicle Safety Statistics
Introduction
Part II of the report provides data on reportable traffic collisions in Canada. Trend information respecting the general driving population is first presented followed by an assessment of collisions involving commercial vehicles (CMVs), including buses, straight trucks and tractor-trailersFootnote 5.
All vehicle, driver and victim information are derived from Transport Canada's National Collision Database (NCDB), which is a compilation of police report records of reportable traffic collisions that occurred on public roads in Canada. Collision data is sent to Transport Canada by each jurisdiction on a calendar year basis. Therefore, in contrast with the regulatory updates that constitute the first part of this report, and which are based on fiscal years, the following safety statistics will mainly focus on the 2019 calendar year.
General Road Users' Collisions and Casualties
Canada's road safety record continues to improve, as can be seen in table 8 and figure 3, which provide a general view of the trend in collisions and casualties from 2000 to 2019. In table 8, the columns headed “Collisions” indicate the total number of casualty collisions (includes collisions with serious injuries and fatalities, excludes property damage only collisions) while the columns headed “Victims” indicate the total number of victims in terms of fatalities, serious injuries and total injuries from collisions.
Figures 3, 4 and 5 plot the information on victims from table 8 and illustrate the steady improvement trends in terms of fatalities, serious injuries and total injuries for the 2000-2019 timeframe.
|
|
Collisions |
Victims |
|||||||||||
|---|---|---|---|---|---|---|---|---|---|---|---|---|---|
|
FatalFootnote 1 |
Personal InjuryFootnote 2 |
FatalitiesFootnote 3 |
Serious InjuriesFootnote 4 |
Injuries (Total)Footnote 5 |
|||||||||
|
2000 |
2,548 |
153,290 |
2,904 |
15,581 |
222,848 |
||||||||
|
2001 |
2,415 |
149,023 |
2,758 |
15,296 |
216,542 |
||||||||
|
2002 |
2,583 |
153,832 |
2,921 |
15,894 |
222,665 |
||||||||
|
2003 |
2,487 |
150,493 |
2,777 |
15,110 |
216,123 |
||||||||
|
2004 |
2,438 |
145,150 |
2,735 |
15,572 |
206,104 |
||||||||
|
2005 |
2,551 |
145,559 |
2,898 |
15,792 |
204,701 |
||||||||
|
2006 |
2,586 |
142,517 |
2,871 |
16,044 |
199,976 |
||||||||
|
2007 |
2,455 |
138,615 |
2,753 |
14,410 |
192,745 |
||||||||
|
2008 |
2,193 |
127,571 |
2,431 |
12,851 |
176,394 |
||||||||
|
2009 |
2,007 |
123,449 |
2,216 |
11,955 |
170,770 |
||||||||
|
2010 |
2,021 |
123,615 |
2,238 |
11,796 |
172,081 |
||||||||
|
2011 |
1,849 |
122,350 |
2,023 |
10,940 |
167,741 |
||||||||
|
2012 |
1,848 |
122,834 |
2,075 |
11,104 |
166,727 |
||||||||
|
2013 |
1,772 |
120,371 |
1,951 |
10,662 |
164,525 |
||||||||
|
2014 |
1,675 |
114,617 |
1,841 |
10,445 |
156,557 |
||||||||
|
2015 |
1,693 |
117,857 |
1,887 |
10,835 |
160,806 |
||||||||
|
2016 |
1,738 |
116,583 |
1,900 |
10,573 |
158,854 |
||||||||
|
2017 |
1,698 |
112,714 |
1,861 |
10,104 |
152,773 |
||||||||
|
2018 |
1,754 |
109,580 |
1,939 |
9,463 |
149,065 |
||||||||
|
2019 |
1,623 |
104,169 |
1,762 |
8,917 |
140,801 |
||||||||
|
Key: Y = Regulatory requirements in place Notes: |
|||||||||||||
Figure 3: Road crash victims 2000-2019: fatalities
Text description
| Year | Fatalities (Total) |
|---|---|
| 2000 | 2,904 |
| 2001 | 2,758 |
| 2002 | 2,921 |
| 2003 | 2,777 |
| 2004 | 2,735 |
| 2005 | 2,898 |
| 2006 | 2,871 |
| 2007 | 2,753 |
| 2008 | 2,431 |
| 2009 | 2,216 |
| 2010 | 2,238 |
| 2011 | 2,023 |
| 2012 | 2,075 |
| 2013 | 1,951 |
| 2014 | 1,841 |
| 2015 | 1,887 |
| 2016 | 1,900 |
| 2017 | 1,861 |
| 2018 | 1,939 |
| 2019 | 1,762 |
Figure 4: Road crash victims 2000-2019: serious injuries
Text description
| Year | Serious injuries (Total) |
|---|---|
| 2000 | 15,581 |
| 2001 | 15,296 |
| 2002 | 15,894 |
| 2003 | 15,110 |
| 2004 | 15,572 |
| 2005 | 15,792 |
| 2006 | 16,044 |
| 2007 | 14,410 |
| 2008 | 12,851 |
| 2009 | 11,955 |
| 2010 | 11,796 |
| 2011 | 10,940 |
| 2012 | 11,104 |
| 2013 | 10,662 |
| 2014 | 10,445 |
| 2015 | 10,835 |
| 2016 | 10,573 |
| 2017 | 10,104 |
| 2018 | 9,463 |
| 2019 | 8,917 |
Figure 5: Road crash victims 2000-2019: total injuries
Text description
| Year | Injuries (Total) |
|---|---|
| 2000 | 222,848 |
| 2001 | 216,542 |
| 2002 | 222,665 |
| 2003 | 216,123 |
| 2004 | 206,104 |
| 2005 | 204,701 |
| 2006 | 199,976 |
| 2007 | 192,745 |
| 2008 | 176,394 |
| 2009 | 170,770 |
| 2010 | 172,081 |
| 2011 | 167,741 |
| 2012 | 166,727 |
| 2013 | 164,525 |
| 2014 | 156,557 |
| 2015 | 160,806 |
| 2016 | 158,854 |
| 2017 | 152,773 |
| 2018 | 149,065 |
| 2019 | 140,801 |
In 2019, 1,762 persons lost their lives on Canadian roads compared to 54, 17 and 72 in air, marine and rail respectively. These numbers emphasize that road transportation remains a serious health and safety issue for the Canadian population. Nevertheless, it is important to note that annual fatalities have dropped a significant 49.7% between 1992 and 2019. Notwithstanding a massive increase in the number of registered motor vehicles, Vehicle Kilometres Travelled (VKT) as well as GDP growth (see figure 6), it is worth noting that 1,739 fewer people lost their life on Canadian roads in 2019 compared to 1992.
Figure 6: Fatalities v. traffic and gross domestic product, 2002-2019
Text description
| Year | GDP | Traffic | Fatalities |
|---|---|---|---|
| 2002 | 1 | 1 | 1 |
| 2003 | 1.033373 | 0.992585 | 0.950702 |
| 2004 | 1.075426 | 0.997027 | 0.936323 |
| 2005 | 1.126378 | 1.011421 | 0.992126 |
| 2006 | 1.179796 | 1.03892 | 0.982883 |
| 2007 | 1.22674 | 1.058445 | 0.942485 |
| 2008 | 1.261505 | 1.037218 | 0.832249 |
| 2009 | 1.235669 | 1.06167 | 0.758644 |
| 2010 | 1.298523 | 1.069994 | 0.766176 |
| 2011 | 1.333561 | 1.074877 | 0.692571 |
| 2012 | 1.365496 | 1.084567 | 0.710373 |
| 2013 | 1.388391 | 1.122449 | 0.667922 |
| 2014 | 1.417618 | 1.103024 | 0.630264 |
| 2015 | 1.422676 | 1.170368 | 0.646012 |
| 2016 | 1.430859 | 1.231592 | 0.650462 |
| 2017 | 1.47858 | 1.241556 | 0.637111 |
| 2018 | 1.516409 | 1.257053 | 0.663814 |
| 2019 | 1.537784 | 1.299656 | 0.603218 |
Figure 7 shows that for the 2015-2019 period, general road user fatalities peaked in 2018 and then reached a low point in 2019. As illustrated in figure 3, this up and down pattern has been the norm for the past 20 years. Nevertheless, the key overarching trend is that there is a general decline in road fatalities, and this is also true for 2015-2019 period.
Figure 7: Road fatalities, 2015-2019
Text description
| Year | Road fatalities (Total) |
|---|---|
| 2015 | 1,887 |
| 2016 | 1,900 |
| 2017 | 1,861 |
| 2018 | 1,939 |
| 2019 | 1,762 |
In sum, as per the trend of the past 20 years, road casualties are overall decreasing notwithstanding increased exposure. This trend is concurrent with incremental safety initiatives undertaken by governments and industry, on the basis of sound scientific research, policy and countermeasures development.
Commercial Vehicle Involvement in Traffic Collisions
The next sections provide detailed information on commercial vehicle involvement in traffic collisions. The data presented is taken from the NCDB. The first section presents general collision trends involving commercial vehicles, presented together with an analysis of the evolution of heavy truck crashes based on exposure estimation derived from the Canadian Vehicle Survey (CVS).
The second section reviews NCDB data on commercial vehicle driver actions and conditions at the time of the crash as well as statistics related to single vehicle collisions, which have been linked to driver fatigue in the scientific literature. The final section provides information regarding the victims of collisions involving commercial vehicles.
Collisions Involving Commercial Vehicles 2015-2019
Table 9 provides a summary of commercial vehicles and all other vehicles involved in collisions, by crash severity and vehicle category, for the 2015-2019 period. Figures 8, 10, 12 and 14 illustrate this information for the 2015-2019 period and figures 9, 11, 13 and 15 show the same variables, but over a wider 27-year window (1992-2019).
In 2019 there were 375 commercial vehicles (including trucks and buses) involved in fatal collisions. As can be seen in figure 10, fatal CMV collisions fluctuated over the 2015-2019 period with a peak in 2017, creating a general increasing trend. The yearly average for the period was 386 commercial vehicles involved in fatal crashes, 6% less than the yearly average for the previous five-year period (2010-2014), which was of 410 vehicles involved. Figure 11 illustrates the fluctuation over the 1992-2019 period. Although it is not linear, the data reveals a general downward trend. In 1992, there were 525 commercial vehicles involved in fatal collisions, compared to 375 in 2019, which represents a 28.6% reduction. The year 2015 saw the lowest number of heavy vehicles involved in fatal collisions for the 26-year period, with 361 vehicles.
In 2019 there were 8,420 commercial vehicles involved in injury collisions. The average for the 2015-2019 period was 8,511 injury crashes, which is 9.2% less than the average for the previous five-year period (2010-2014) which was 9,375 vehicles. Figure 12 illustrates this downward trend in injury collisions for the 2015-2019 period. Table 9 data further reveal an increasing trend in property damage only (PDO) collisions for the 2015-2019 period (see figures 14 and 15). A note that this increasing trend in PDO collisions for commercial vehicles explains the increase in overall reportable collisions for the period (see figure 8).
|
|
|
2015 |
2016 |
2017 |
2018 |
2019 |
|---|---|---|---|---|---|---|
|
Fatal |
All Buses |
33 |
31 |
28 |
33 |
13 |
|
|
Straight Trucks > 4536 kg |
122 |
122 |
140 |
135 |
127 |
|
|
Tractor-Trailers |
206 |
220 |
264 |
220 |
235 |
|
|
Total Commercial Vehicles |
361 |
373 |
432 |
388 |
375 |
|
|
Non-Commercial Vehicles Involved With Commercial Vehicles |
343 |
377 |
376 |
357 |
367 |
|
|
Total Vehicles Involved in Collisions Involving Commercial Vehicles |
704 |
750 |
808 |
745 |
742 |
|
|
Total All Other Vehicles Involved |
2,044 |
2,166 |
2,042 |
2,180 |
1,975 |
|
|
Total All Vehicles Involved |
2,748 |
2,916 |
2,850 |
2,925 |
2,717 |
|
Injury |
All Buses |
1,895 |
1,783 |
1,673 |
1,688 |
1,668 |
|
|
Straight Trucks > 4536 kg |
3,781 |
3,561 |
3,739 |
3,766 |
3,836 |
|
|
Tractor-Trailers |
3,076 |
2,988 |
3,181 |
3,044 |
2,916 |
|
|
Total Commercial Vehicles |
8,752 |
8,332 |
8,593 |
8,498 |
8,420 |
|
|
Non-Commercial Vehicles Involved With Commercial Vehicles |
7,794 |
7,394 |
7,612 |
7,527 |
7,973 |
|
|
Total Vehicles Involved in Collisions Involving Commercial Vehicles |
16,546 |
15,726 |
16,205 |
16,025 |
16,393 |
|
|
Total All Other Vehicles Involved |
197,517 |
194,929 |
187,357 |
181,709 |
172,713 |
|
|
Total All Vehicles Involved |
214,063 |
210,655 |
203,562 |
197,734 |
189,106 |
|
PDO |
All Buses |
6,960 |
6,012 |
6,190 |
6,526 |
6,643 |
|
|
Straight Trucks > 4536 kg |
20,694 |
19,676 |
20,535 |
21,247 |
22,434 |
|
|
Tractor-Trailers |
13,703 |
12,899 |
13,994 |
14,665 |
14,415 |
|
|
Total Commercial Vehicles |
41,357 |
38,587 |
40,719 |
42,438 |
43,492 |
|
|
Non-Commercial Vehicles Involved With Commercial Vehicles |
32,253 |
30,158 |
31,585 |
32,880 |
34,256 |
|
|
Total Vehicles Involved in Collisions Involving Commercial Vehicles |
73,610 |
68,745 |
72,304 |
75,318 |
77,748 |
|
|
Total All Other Vehicles Involved |
764,068 |
736,196 |
760,114 |
771,905 |
776,812 |
|
|
Total All Vehicles Involved |
837,678 |
804,941 |
832,418 |
847,223 |
854,560 |
|
Total |
All Buses |
8,888 |
7,826 |
7,891 |
8,247 |
8,324 |
|
|
Straight Trucks > 4536 kg |
24,597 |
23,359 |
24,414 |
25,148 |
26,397 |
|
|
Tractor-Trailers |
16,985 |
16,107 |
17,439 |
17,929 |
17,566 |
|
|
Total Commercial Vehicles |
50,470 |
47,292 |
49,744 |
51,324 |
52,287 |
|
|
Non-Commercial Vehicles Involved With Commercial Vehicles |
40,390 |
37,929 |
39,573 |
40,764 |
42,596 |
|
|
Total Vehicles Involved in Collisions Involving Commercial Vehicles |
90,860 |
85,221 |
89,317 |
92,088 |
94,883 |
|
|
Total All Other Vehicles Involved |
963,629 |
933,291 |
949,513 |
955,794 |
951,500 |
|
|
Total All Vehicles Involved |
1,054,489 |
1,018,512 |
1,038,830 |
1,047,882 |
1,046,383 |
Figure 8: Number of commercial vehicles involved in reportable collisions, 2015-2019
Text description
| Year | Number of commercial vehicles involved in reportable collisions |
|---|---|
| 2015 | 50,470 |
| 2016 | 47,292 |
| 2017 | 49,744 |
| 2018 | 51,324 |
| 2019 | 52,287 |
Figure 9: Number of commercial vehicles involved in reportable collisions, 1992-2019
Text description
| Year | Number of commercial vehicles involved in reportable collisions |
|---|---|
| 1992 | 54,479 |
| 1993 | 52,694 |
| 1994 | 57,395 |
| 1995 | 54,771 |
| 1996 | 53,095 |
| 1997 | 54,963 |
| 1998 | 50,835 |
| 1999 | 51,080 |
| 2000 | 52,942 |
| 2001 | 51,170 |
| 2002 | 54,793 |
| 2003 | 59,393 |
| 2004 | 60,180 |
| 2005 | 62,697 |
| 2006 | 61,341 |
| 2007 | 66,521 |
| 2008 | 62,753 |
| 2009 | 53,607 |
| 2010 | 53,091 |
| 2011 | 54,551 |
| 2012 | 50,115 |
| 2013 | 52,510 |
| 2014 | 52,914 |
| 2015 | 50,470 |
| 2016 | 47,292 |
| 2017 | 49,744 |
| 2018 | 51,324 |
| 2019 | 52,287 |
Figure 10: Number of commercial vehicles involved in fatal collisions, 2015-2019
Text description
| Year | Number of commercial vehicles involved in fatal collisions |
|---|---|
| 2015 | 361 |
| 2016 | 373 |
| 2017 | 432 |
| 2018 | 388 |
| 2019 | 375 |
Figure 11: Number of commercial vehicles involved in fatal collisions, 1992-2019
Text description
| Year | Number of commercial vehicles involved in fatal collisions |
|---|---|
| 1992 | 525 |
| 1993 | 591 |
| 1994 | 572 |
| 1995 | 541 |
| 1996 | 504 |
| 1997 | 559 |
| 1998 | 502 |
| 1999 | 561 |
| 2000 | 555 |
| 2001 | 508 |
| 2002 | 543 |
| 2003 | 535 |
| 2004 | 565 |
| 2005 | 526 |
| 2006 | 549 |
| 2007 | 557 |
| 2008 | 478 |
| 2009 | 422 |
| 2010 | 418 |
| 2011 | 417 |
| 2012 | 403 |
| 2013 | 402 |
| 2014 | 411 |
| 2015 | 361 |
| 2016 | 373 |
| 2017 | 432 |
| 2018 | 388 |
| 2019 | 375 |
Figure 12: Number of commercial vehicles involved in injury collisions, 2015-2019
Text description
| Year | Number of commercial vehicles involved in injury collisions |
|---|---|
| 2015 | 8,752 |
| 2016 | 8,332 |
| 2017 | 8,593 |
| 2018 | 8,498 |
| 2019 | 8,420 |
Figure 13: Number of commercial vehicles involved in injury collisions, 1992-2019
Text description
| Year | Number of commercial vehicles involved in injury collisions |
|---|---|
| 1992 | 10,429 |
| 1993 | 10,549 |
| 1994 | 11,150 |
| 1995 | 10,535 |
| 1996 | 10,368 |
| 1997 | 10,605 |
| 1998 | 9,823 |
| 1999 | 9,956 |
| 2000 | 10,347 |
| 2001 | 9,963 |
| 2002 | 10,602 |
| 2003 | 11,116 |
| 2004 | 11,244 |
| 2005 | 11768 |
| 2006 | 11,254 |
| 2007 | 11,480 |
| 2008 | 10,718 |
| 2009 | 9,218 |
| 2010 | 9,545 |
| 2011 | 9,751 |
| 2012 | 9,141 |
| 2013 | 9,191 |
| 2014 | 9,250 |
| 2015 | 8,752 |
| 2016 | 8,332 |
| 2017 | 8,593 |
| 2018 | 8,498 |
| 2019 | 8,420 |
Figure 14: Number of commercial vehicles involved in property damage collisions, 2015-2019
Text description
| Year | Number of commercial vehicles involved in property damage collisions |
|---|---|
| 2015 | 41,357 |
| 2016 | 38,587 |
| 2017 | 40,719 |
| 2018 | 42,438 |
| 2019 | 43,492 |
Figure 15: Number of commercial vehicles involved in property damage collisions, 1992-2019
Text description
| Year | Number of commercial vehicles involved in property damage collisions |
|---|---|
| 1992 | 43,525 |
| 1993 | 41,554 |
| 1994 | 45,673 |
| 1995 | 43,695 |
| 1996 | 42,223 |
| 1997 | 43,799 |
| 1998 | 40,510 |
| 1999 | 40,563 |
| 2000 | 42,040 |
| 2001 | 40,699 |
| 2002 | 43,648 |
| 2003 | 47,742 |
| 2004 | 48,371 |
| 2005 | 50,403 |
| 2006 | 49,538 |
| 2007 | 54,484 |
| 2008 | 51,557 |
| 2009 | 43,967 |
| 2010 | 43,128 |
| 2011 | 44,383 |
| 2012 | 40,571 |
| 2013 | 42,917 |
| 2014 | 43,253 |
| 2015 | 41,357 |
| 2016 | 38,587 |
| 2017 | 40,719 |
| 2018 | 42,438 |
| 2019 | 43,492 |
Figure 16 below illustrates the contribution of NCDB categories of heavy vehicles as well as light duty vehicles (cars, pick-up trucks, sport utility vehicles) to heavy vehicle fatal crashes from 1992 to 2019.
Figure 16: Number of vehicles involved in fatal heavy vehicle crashes by type of vehicle, 1992-2019
Text description
| Year | Buses | Straight trucks | Tractor -trailers | Light duty vehicles |
|---|---|---|---|---|
| 1992 | 46 | 184 | 295 | 507 |
| 1993 | 37 | 212 | 342 | 598 |
| 1994 | 46 | 198 | 328 | 578 |
| 1995 | 31 | 168 | 342 | 535 |
| 1996 | 43 | 168 | 293 | 457 |
| 1997 | 33 | 189 | 337 | 495 |
| 1998 | 43 | 169 | 290 | 461 |
| 1999 | 33 | 169 | 359 | 558 |
| 2000 | 36 | 167 | 352 | 507 |
| 2001 | 33 | 163 | 312 | 448 |
| 2002 | 37 | 169 | 337 | 505 |
| 2003 | 38 | 172 | 325 | 495 |
| 2004 | 40 | 164 | 361 | 500 |
| 2005 | 29 | 187 | 310 | 469 |
| 2006 | 22 | 198 | 329 | 593 |
| 2007 | 37 | 194 | 326 | 483 |
| 2008 | 35 | 187 | 256 | 385 |
| 2009 | 29 | 167 | 226 | 397 |
| 2010 | 35 | 148 | 235 | 337 |
| 2011 | 30 | 164 | 223 | 371 |
| 2012 | 26 | 153 | 224 | 335 |
| 2013 | 38 | 137 | 227 | 334 |
| 2014 | 28 | 143 | 240 | 396 |
| 2015 | 33 | 122 | 206 | 343 |
| 2016 | 31 | 122 | 220 | 377 |
| 2017 | 28 | 140 | 264 | 376 |
| 2018 | 33 | 135 | 220 | 357 |
| 2019 | 13 | 127 | 235 | 367 |
Figure 17 focuses on the contribution of specific categories of heavy vehicles to fatal crashes, excluding light duty vehicles (LDV), for the 2015-2019 period. As can be seen, tractor-trailers are over-represented compared to straight-trucks and buses. However, as shown further below in table 10 and figure 28, it is estimated that in the 2015-2019 period tractor-trailers covered more than three times more VKT than straight trucks, which suggests that exposure is a significant factor in their over-representation in fatal crashes. In terms of trends, figure 17 shows a mild increasing trend for tractor- trailers, a rather stable situation for tractor trailers and a mild decrease for buses in 2019.
Figure 17: Commercial vehicles involved in fatal collisions by type of vehicle, 2015-2019
Text description
| Year | Buses | Straight trucks | Tractor -trailers |
|---|---|---|---|
| 2015 | 33 | 122 | 206 |
| 2016 | 31 | 122 | 220 |
| 2017 | 28 | 140 | 264 |
| 2018 | 33 | 135 | 220 |
| 2019 | 13 | 127 | 235 |
Figure 18 illustrates the contribution of NCDB categories of heavy vehicles as well as LDVs to heavy vehicle injury crashes from 1992 to 2019. As it was the case for fatal crashes, LDVs are over-represented in commercial vehicle injury crashes.
Figure 18: Number of vehicles involved in injury heavy vehicle crashes by type of vehicle, 1992-2019
Text description
| Year | Buses | Straight trucks | Tractor -trailers | Light duty vehicles |
|---|---|---|---|---|
| 1992 | 2,063 | 4,811 | 3,555 | 9,917 |
| 1993 | 2,032 | 4,790 | 3,727 | 9,831 |
| 1994 | 2,153 | 4,845 | 4,152 | 10,233 |
| 1995 | 2,043 | 4,601 | 3,891 | 9,858 |
| 1996 | 1,963 | 4,585 | 3,820 | 9,538 |
| 1997 | 1,907 | 4,575 | 4,123 | 9,706 |
| 1998 | 1,746 | 4,175 | 3,902 | 8,846 |
| 1999 | 1744 | 4153 | 4059 | 9031 |
| 2000 | 1,930 | 4,284 | 4,133 | 9,248 |
| 2001 | 1,857 | 4,314 | 3,792 | 9,019 |
| 2002 | 2,090 | 4,495 | 4,017 | 9,452 |
| 2003 | 2,139 | 4,746 | 4,231 | 9,940 |
| 2004 | 2,032 | 4,893 | 4,319 | 10,024 |
| 2005 | 2,147 | 5,202 | 4,419 | 10,188 |
| 2006 | 1,953 | 5,194 | 4,107 | 9,952 |
| 2007 | 2,126 | 5,322 | 4,032 | 10,004 |
| 2008 | 2,087 | 5,047 | 3,584 | 9,280 |
| 2009 | 2,058 | 4,209 | 2,951 | 8,105 |
| 2010 | 2,089 | 4,274 | 3,182 | 8,396 |
| 2011 | 2,111 | 4,285 | 3,355 | 8,338 |
| 2012 | 1,976 | 3,859 | 3,306 | 7,952 |
| 2013 | 1,898 | 3,841 | 3,452 | 8,063 |
| 2014 | 1,805 | 3,867 | 3,578 | 8,308 |
| 2015 | 1,895 | 3,781 | 3,076 | 7,794 |
| 2016 | 1,783 | 3,561 | 2,988 | 7,394 |
| 2017 | 1,673 | 3,739 | 3,181 | 7,612 |
| 2018 | 1,688 | 3,766 | 3,044 | 7,527 |
| 2019 | 1,668 | 3,836 | 2,916 | 7,973 |
Figure 19 illustrates the contribution of specific categories of heavy vehicles to injury crashes, excluding LDVs, for the 2015-2019 period. The situation depicted is different than the distribution of heavy trucks categories in the case of fatal crashes. Even though they have far less VKT exposure, straight trucks are more involved in injury collisions than tractor-trailers. In terms of trends, figure 19 reveals rather stable situations for all three categories.
Figure 19: Commercial vehicles involved in injury collisions by types of vehicle, 2015-2019
Text description
| Year | Buses | Straight trucks | Tractor -trailers |
|---|---|---|---|
| 2015 | 1,895 | 3,781 | 3,076 |
| 2016 | 1,783 | 3,561 | 2,988 |
| 2017 | 1,673 | 3,739 | 3,181 |
| 2018 | 1,688 | 3,766 | 3,044 |
| 2019 | 1,668 | 3,836 | 2,916 |
Figure 20 depicts the involvement rate of commercial vehicles by crash severity. As can be seen, CMVs are over-represented in fatal collisions. The resulting casualties are shown in figure 21. For the 2015-2019 period, while CMVs represented only 4.8% of total vehicles involved in road crashes, they were associated with 20.2% of road fatalities. This reality could be explained by CMVs' relative weight and mass compared to that of light-duty vehicles.
Figure 20: Commercial vehicles involvement rate by collision severity, 2015-2019
Text description
| Year | Fatal | Injury | PDO crashes |
|---|---|---|---|
| 2015 | 13.13 | 4.08 | 4.93 |
| 2016 | 12.79 | 3.95 | 4.79 |
| 2017 | 15.15 | 4.22 | 4.89 |
| 2018 | 13.26 | 4.27 | 5 |
| 2019 | 13.8 | 4.45 | 5.08 |
Figure 21: Commercial vehicles collision involvement rate and resulting road casualties, 2015-2019
Text description
| Year | Involvment rate | Fatalities | Injuries |
|---|---|---|---|
| 2015 | 4.7 | 20.7 | 7.14 |
| 2016 | 4.64 | 19.63 | 6.85 |
| 2017 | 4.78 | 21.65 | 7.2 |
| 2018 | 4.89 | 19.23 | 7.48 |
| 2019 | 4.99 | 20.03 | 7.67 |
Looking at crash contributing factors, figure 22 shows that vehicle defects are associated with less than 4% of fatal CMV crashes and that this situation appears to be improving over the 2015-2019 period.
Figure 22: Collision involvement rate of commercial vehicles with defects, 2015-2019
Text description
| Year | Fatal | Injury | PDO |
|---|---|---|---|
| 2015 | 3.81 | 2.18 | 2.74 |
| 2016 | 3.11 | 2.58 | 2.53 |
| 2017 | 0.96 | 2.45 | 2.51 |
| 2018 | 2.1 | 2.28 | 2.41 |
| 2019 | 1.36 | 2.13 | 2.33 |
Figure 23 reveals that CMV driver actions, and to a lesser extent driver condition, are both more significant contributing factors than vehicle defects. Note however that NCDB data stem from police reports and not from in-depth crash-causation analysis. Such data has documented limitations with regards to quantifying the prevalence of complex human factors issues such as inattention as it relates to distraction and/or fatigue. The data from crash-causation studies conducted in other contexts and using various methodologies estimate the contribution of driver-related factors to 80 to 90% of road crashes for both light duty vehicles and heavy vehicle crashesFootnote 6.
Figure 23: Contributing factors in commercial vehicle fatal collisions, 2015-2019
Text description
| Year | Vehicle defect | Driver condition | Driver action |
|---|---|---|---|
| 2015 | 3.81 | 5.278 | 23.75 |
| 2016 | 3.11 | 6.51 | 30.31 |
| 2017 | 0.96 | 4.8 | 26.92 |
| 2018 | 2.1 | 3.166 | 27.17 |
| 2019 | 1.36 | 5.19 | 27.59 |
Figure 24 presents NCDB data on CMV driver condition, when it was identified as being other than normal, in fatal CMV crashes for the 2015-2019 period. Note that the numbers are small and that overall CMV driver condition was considered as normal in 95% of fatal crashes. Nevertheless, for the remaining 5%, when driver condition is identified as other than normal, fatigue/falling asleep (31%) and driving under the influence of alcohol (28%) were the most frequently identified contributors in the dataset. Note however that it is widely accepted and documented that data based on police reports tend to seriously underestimate the contribution of fatigue and fatigue-related inattention to crashes.
For comparison purposes, figure 25 illustrates the condition of LDV drivers in overall fatal crashes, when the condition was considered as other than normal for the same period. Of importance is the notion that LDV driver condition was identified as other than normal in 22.7% of overall fatal crashes, which is over four times what it was for CMV drivers (4.96%). In terms of key differences in the profile of condition-related crash contributors, it is worth noting that the rate of alcohol is much higher for LDV drivers and that the rate of fatigue is almost three times higher for CMV drivers.
Figure 24: CMV driver condition, when condition is considered as “other than normal”, in 4.96% of CMV fatal crashes, for the 2015-2019 period – NCDB
Percentage
Text description
| Driver condition | Percentage |
|---|---|
| Fatigued | 31 |
| Inexperience | 2 |
| Alcohol | 28 |
| Drugs | 8 |
| Illness | 5 |
| Other Driver Condition | 26 |
Figure 25: LDV driver condition, when condition is considered as “other than normal”, in 22.7% of overall fatal crashes, for the 2015-2019 period – NCDB
Percentage
Text description
| Driver condition | Percentage |
|---|---|
| Fatigued | 11 |
| Inexperience | 2 |
| Alcohol | 49 |
| Drugs | 9 |
| Illness | 6 |
| Other Driver Condition | 23 |
Figure 26 provides NCDB data on CMV driver actions when they were identified as not driving properly in fatal CMV crashes for the 2015-2019 period, which was the case in 27.2% of fatal crashes. Among these, the categories inattention (25.2%), other driving action (22.6%) and driving too fast (14%)were the most commonly identified driver behaviors.
It could however be debated whether inattention should also be related to the driver condition category, since it is well documented that a significant portion of inattention problems are related to hypovigilance, the early signs of fatigue. As can be seen in figure 26, inattention, which also includes distracted driving, is the most significant crash contributing factor for fatal CMV crashes.
Figure 26: CMV driver actions, when considered as “not driving properly”, in 27.2% of fatal CMV crashes, for the 2015-2019 period – NCDB
Text description
| Driver actions | Total |
|---|---|
| Other Driver Action | 114 |
| Lost Control | 25 |
| Reversing Unsafely | 3 |
| Wrong Direction | 2 |
| Wrong Side of Road | 29 |
| Disobey Traffic Cntrl | 33 |
| Fail to Yield | 54 |
| Improper Passing | 24 |
| Too Fast | 71 |
| Inattention | 127 |
| Too Close | 22 |
Again, for comparison purposes, figure 27 illustrates the actions of LDV drivers in overall fatal crashes for the same period, when driver actions were considered as not driving properly, which was the case for 50.2% of these crashes, almost twice that of CMV drivers (27%). In terms of key differences, speeding was the top contributing factor with 21.8% of cases, compared to 14% for CMV drivers, followed by inattention with a 19.2% contribution, which is less than the 25.2% observed with CMV drivers.
Figure 27: LDV driver actions, when considered as “not driving properly”, in 50.2% of overall fatal crashes, for the 2015-2019 period – NCDB
Text description
| Driver actions | Total |
|---|---|
| Other Driver Action | 832 |
| Lost Control | 514 |
| Reversing Unsafely | 18 |
| Wrong Direction | 48 |
| Wrong Side of Road | 471 |
| Disobey Traffic Cntrl | 291 |
| Fail to Yield | 392 |
| Improper Passing | 349 |
| Too Fast | 1,120 |
| Inattention | 989 |
| Too Close | 63 |
In sum, NCDB data for the 2015-2019 period emphasize that inattention (relates to both fatigue and distraction) and driving too fast (relates to high-risk driving) are key crash contributing factors for fatal heavy vehicle crashes. This is consistent with the assessment conducted by the CCMTA Human Factors and Motor Carrier Safety Task Force. The presence of alcohol as a contributing factor also needs to be noted: on average there were 5.2 fatal CMV crashes associated with alcohol per year.
Given the importance of inattention as a crash contributor for heavy vehicle crashes, in 2019 Transport Canada initiated a project with a team of human factors experts to develop training material to help mitigate driver distraction in the motor carrier industry. The material is to include driver training modules and a set of comprehensive guidelines for fleets to implement a driver distraction mitigation program. This material is expected to be made available in both official languages, free of charge, in 2022 or 2023. Also in 2019, Transport Canada published the Guidelines to Limit Distractions from Visual Displays in Vehicles Footnote 7. The Guidelines help to make the visual displays in vehicles less distracting by recommending how to safely design, install and use in-vehicle visual displays. A report on Transport Canada's National Roundtable on Distracted Driving, which was held in 2018, was also published in 2019Footnote 8.
Heavy Truck Exposure and Collision Involvement Rates
The concept of exposure to collision risk considers data on the amount of travel when accounting for differing collision rates, for example between heavy trucks and LDVs. It therefore represents a better indicator of commercial vehicle safety than simple comparisons of absolute raw collision data that do not account for exposure.
This section provides an estimate of exposure produced using an econometric forecasting model based on data from the Canadian Vehicle Survey (CVS), the Canadian Vehicle Use Survey (CVUS) and Statistics Canada data tables. The estimate covers VKTs by straight trucks > 4,500 kg, tractor-trailers > than 15,000 kg and all heavy trucks (a combination of both categories). It is understood that VKT data is considered to represent a better exposure indicator than other measures such as heavy truck registrations, which have gone up significantly in recent years. Estimates of VKTs are not available for buses.
As can be seen in table 10 and figure 28, the model estimates an overall increase in heavy trucks VKT for the 2013-2019 period. Figure 29 illustrates that this increase occurred after the economic downturn of 2008 and 2009, and that it would be mainly related to tractor-trailer transportation activities.
Nevertheless, as can be seen in figures 30 and 31 which illustrate heavy truck fatal and injury crash rates per 100 million VKT (calculated on the basis of econometric model estimation and NCDB data), this increase in exposure did not translate into a deterioration of safety performance. In fact, fatal and injury crash rates have both been decreasing between 2005 and 2019 for heavy trucks (55.8% for fatal crashes and 57.4% for injury crashes). Overall, according to this model, the significant increase in exposure for tractor-trailers after 2009 correlates with a
Globally, the econometric forecasting model estimates that during the 2015-2019 timeframe, heavy trucks (including both straight trucks and tractor-trailers) travelled an annual average of about 43.6 billion kilometres (10.9 billion for straight trucks and 32.7 billion for tractor-trailers).
|
|
2013 |
2014 |
2015 |
2016 |
2017 |
2018 |
2019 |
|---|---|---|---|---|---|---|---|
|
|
(millions) |
||||||
|
Straight trucks |
10,115.0 |
10,175.5 |
10,468.0 |
10,709.8 |
10,937.7 |
11,124.7 |
11,304.7 |
|
Tractor trailers |
31,113.0 |
30,526.6 |
31,404.0 |
32,129.4 |
32,813.1 |
33,374.1 |
33,914.2 |
|
Total |
41,228 |
40,702 |
41,872 |
42,839 |
43,751 |
44,499 |
45,219 |
Figure 28: Estimate of vehicle kilometers travelled by category of heavy truck, 2015-2019
Text description
| Year | Straight trucks | Tractor -trailers |
|---|---|---|
| 2013 | 10,115 | 31,113 |
| 2014 | 10,175.5 | 30,526.6 |
| 2015 | 10,468 | 31,404 |
| 2016 | 10,709.8 | 32,129.4 |
| 2017 | 10,937.7 | 32,813.1 |
| 2018 | 11,124.7 | 33,374.1 |
| 2019 | 11,304.7 | 33,914.2 |
Figure 29: Estimate of vehicle kilometers travelled by category of heavy truck, 2005-2019
Text description
| Year | Straight trucks | Tractor -trailers |
|---|---|---|
| 2005 | 9,150.8 | 18,312.1 |
| 2006 | 8,442.4 | 18,870.1 |
| 2007 | 9,372.1 | 21,218.9 |
| 2008 | 9,646.7 | 20,010.3 |
| 2009 | 9,216.2 | 18,889.5 |
| 2010 | 9,292 | 21,911 |
| 2011 | 9,876 | 28,302 |
| 2012 | 10,005 | 29,585 |
| 2013 | 10,115 | 31,113 |
| 2014 | 10,175.5 | 30,526.6 |
| 2015 | 10,468 | 31,404 |
| 2016 | 10,709.8 | 32,129.4 |
| 2017 | 10,937.7 | 32,813.1 |
| 2018 | 11,124.7 | 33,374.1 |
| 2019 | 11,304.7 | 33,914.2 |
It is interesting to note further that according to the model, tractor-trailers generally have lower collision involvement rates than straight trucks, despite travelling more than twice the distance. As shown in figures 30 and 31, straight trucks have higher collision rates than tractor-trailers for both fatal and injury collisions. The dense urban setting where straight trucks are more likely to operate is one plausible contributor.
Figure 30: Estimated involvement rate of heavy trucks in fatal collisions per 100 million VKT, 2005-2019
Text description
| Year | Straight trucks | Tractor -trailers |
|---|---|---|
| 2005 | 2.043537 | 1.69287 |
| 2006 | 2.345305 | 1.743499 |
| 2007 | 2.069974 | 1.536366 |
| 2008 | 1.938487 | 1.279341 |
| 2009 | 1.812027 | 1.196432 |
| 2010 | 1.592768 | 1.072521 |
| 2011 | 1.660591 | 0.78793 |
| 2012 | 1.529235 | 0.75714 |
| 2013 | 1.354424 | 0.729599 |
| 2014 | 1.405336 | 0.7862 |
| 2015 | 1.165457 | 0.655967 |
| 2016 | 1.139144 | 0.684731 |
| 2017 | 1.279977 | 0.804557 |
| 2018 | 1.213516 | 0.659194 |
| 2019 | 1.123427 | 0.692925 |
Figure 31: Estimated involvement rate of heavy trucks in injury collisions per 100 million VKT, 2005-2019
Text description
| Year | Straight trucks | Tractor -trailers |
|---|---|---|
| 2005 | 56.84749 | 24.13159 |
| 2006 | 61.52279 | 21.76459 |
| 2007 | 56.78557 | 19.00193 |
| 2008 | 52.31841 | 17.91078 |
| 2009 | 45.66958 | 15.62244 |
| 2010 | 45.99656 | 14.52239 |
| 2011 | 43.38801 | 11.85429 |
| 2012 | 38.57071 | 11.17458 |
| 2013 | 37.97331 | 11.09504 |
| 2014 | 38.00305 | 11.72093 |
| 2015 | 36.1196 | 9.794931 |
| 2016 | 33.24992 | 9.299894 |
| 2017 | 34.18452 | 9.694299 |
| 2018 | 33.8526 | 9.120845 |
| 2019 | 33.93279 | 8.598168 |
Commercial Vehicles Involved in Single-Vehicle Collisions
Table 11 presents NCDB data relative to single-vehicle CMV crashes. This crash category is often associated with the presence of fatigue, given that fatigue-related crashes tend to be single vehicle run-off-the-road incidents. However, using single-vehicle crashes as a sole indicator for the presence of fatigue has clear limitations. The problem of fatigue is complex and difficult to quantify, and as such it should be assessed with methodologies using multiple criteria. Single-vehicle crashes are nevertheless linked to fatigue in the literature and a trend assessment is certainly relevant in any discussion on the potential impacts of HoS regulations on driver fatigue.
Figure 32 reveals a significant decrease in overall single-vehicle CMV crashes from 2007 to 2009, following a steady increasing trend that was initiated around 2000. Looking back at figure 9, we however see that there was an overall drop in reportable collisions involving commercial vehicles for the same period. Nevertheless, as shown in figure 33, the ratio of single vehicle CMV crashes to overall CMV crashes also dropped around the same period, coinciding in time with the publication of the 2007 HoS regulations. These new regulations, providing drivers with 25% more time to sleep and rest compared to the old regime, could have contributed to this improvement.
|
2012 |
2013 |
2014 |
2015 |
2016 |
2017 |
2018 |
2019 |
||
|---|---|---|---|---|---|---|---|---|---|
|
Fatal |
All buses |
12 |
13 |
15 |
13 |
10 |
10 |
10 |
7 |
|
Straight Trucks > 4536 kg |
38 |
35 |
21 |
25 |
27 |
28 |
34 |
26 |
|
|
Tractor-Trailers |
25 |
25 |
28 |
28 |
30 |
36 |
25 |
37 |
|
|
Total Commercial Vehicles |
75 |
73 |
64 |
66 |
67 |
74 |
69 |
70 |
|
|
Injury |
All Buses |
693 |
648 |
533 |
622 |
585 |
544 |
585 |
542 |
|
Straight Trucks > 4536 kg |
711 |
649 |
619 |
639 |
559 |
610 |
630 |
615 |
|
|
Tractor-Trailers |
684 |
685 |
685 |
658 |
623 |
631 |
625 |
573 |
|
|
Total Commercial Vehicles |
2,088 |
1,982 |
1,837 |
1,919 |
1,767 |
1,785 |
1,840 |
1,730 |
|
|
PDO |
All Buses |
382 |
415 |
398 |
364 |
359 |
395 |
428 |
415 |
|
Straight Trucks > 4536 kg |
3,582 |
3,579 |
3,508 |
3,709 |
3,786 |
4,022 |
4,044 |
4,203 |
|
|
Tractor-Trailers |
3,611 |
3,690 |
3,642 |
3,256 |
3,158 |
3,385 |
3,479 |
3,426 |
|
|
Total Commercial Vehicles |
7,575 |
7,684 |
7,548 |
7,329 |
7,303 |
7,802 |
7,951 |
8,044 |
|
|
Total |
All Buses |
1,087 |
1,076 |
946 |
999 |
954 |
949 |
1,023 |
964 |
|
Straight Trucks > 4536 kg |
4,331 |
4,263 |
4,148 |
4,373 |
4,372 |
4,660 |
4,708 |
4,844 |
|
|
Tractor-Trailers |
4,320 |
4,400 |
4,355 |
3,942 |
3,811 |
4,052 |
4,129 |
4,036 |
|
|
Total Commercial Vehicles |
9,738 |
9,739 |
9,449 |
9,314 |
9,137 |
9,661 |
9,860 |
9,844 |
Figure 32: Number of single CMV crashes (all crashes), 1992-2019
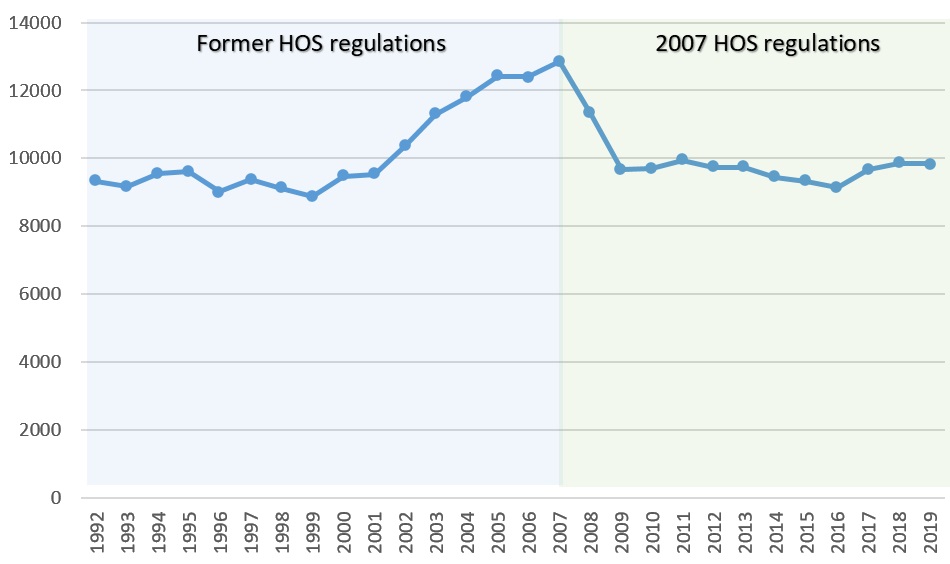
Text description
| Year | Total |
|---|---|
| Former HOS regulations | |
| 1992 | 9,328 |
| 1993 | 9,171 |
| 1994 | 9,554 |
| 1995 | 9,609 |
| 1996 | 9,017 |
| 1997 | 9,380 |
| 1998 | 9,106 |
| 1999 | 8,885 |
| 2000 | 9,475 |
| 2001 | 9,529 |
| 2002 | 10,352 |
| 2003 | 11,294 |
| 2004 | 11,803 |
| 2005 | 12,423 |
| 2006 | 12,403 |
| 2007 HOS regulations | |
| 2007 | 12,854 |
| 2008 | 11,336 |
| 2009 | 9,664 |
| 2010 | 9,699 |
| 2011 | 9,937 |
| 2012 | 9,738 |
| 2013 | 9,739 |
| 2014 | 9,449 |
| 2015 | 9,314 |
| 2016 | 9,137 |
| 2017 | 9,661 |
| 2018 | 9,860 |
| 2019 | 9,844 |
Figure 33: Rate of single-vehicle CMV crashes to overall CMV crashes, 1992-2019
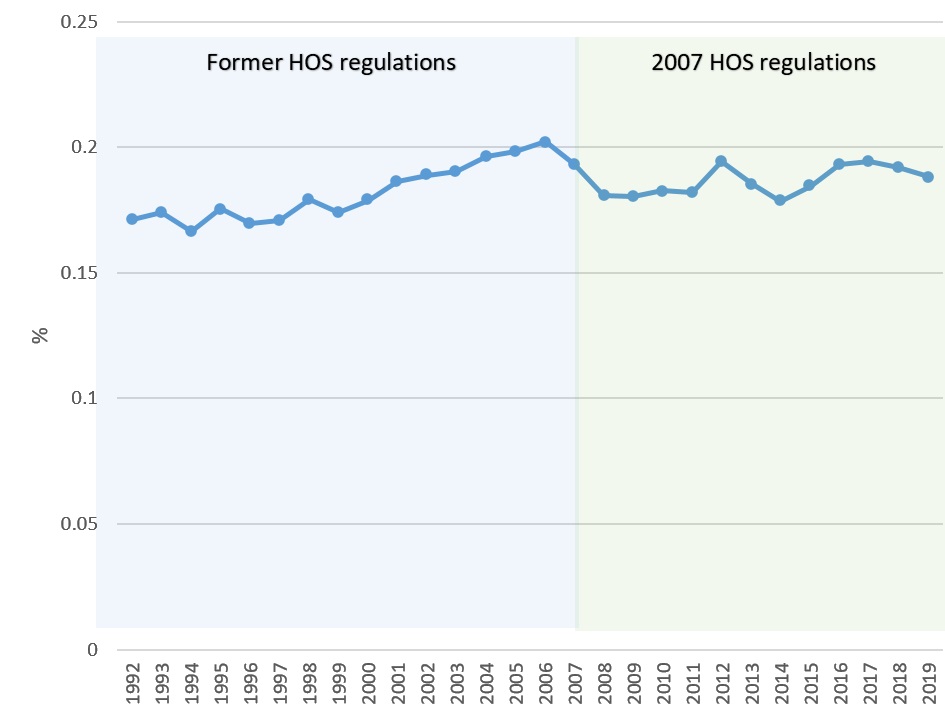
Text description
| Year | Total |
|---|---|
| Former HOS regulations | |
| 1992 | 0.171222 |
| 1993 | 0.174043 |
| 1994 | 0.16646 |
| 1995 | 0.17544 |
| 1996 | 0.169828 |
| 1997 | 0.17066 |
| 1998 | 0.179129 |
| 1999 | 0.173943 |
| 2000 | 0.178969 |
| 2001 | 0.186222 |
| 2002 | 0.188929 |
| 2003 | 0.190157 |
| 2004 | 0.196128 |
| 2005 | 0.198143 |
| 2006 | 0.202198 |
| 2007 HOS regulations | |
| 2007 | 0.193232 |
| 2008 | 0.180645 |
| 2009 | 0.180275 |
| 2010 | 0.182686 |
| 2011 | 0.18216 |
| 2012 | 0.194313 |
| 2013 | 0.185469 |
| 2014 | 0.178573 |
| 2015 | 0.184545 |
| 2016 | 0.193204 |
| 2017 | 0.194214 |
| 2018 | 0.192113 |
| 2019 | 0.188269 |
Casualties Resulting from Collisions Involving Commercial Vehicles
Table 12, as well as figures 34 to 47, present information on casualties resulting from collisions involving commercial vehicles by injury severity, road user category and commercial vehicle type, for the 2015-2019 period.
|
2015 |
2016 |
2017 |
2018 |
2019 |
||
|---|---|---|---|---|---|---|
|
Fatalities |
All Buses |
3 |
5 |
5 |
20 |
0 |
|
|
Straight Trucks > 4536 kg |
17 |
15 |
19 |
23 |
17 |
|
|
Tractor-Trailers |
25 |
36 |
43 |
30 |
31 |
|
|
Commercial Vehicle Occupant total |
45 |
56 |
67 |
73 |
48 |
|
|
Occupants of Other Vehicles Inv. With Commercial Vehicles |
299 |
253 |
276 |
236 |
247 |
|
|
Cyclists |
7 |
13 |
11 |
10 |
8 |
|
|
Pedestrians |
40 |
50 |
48 |
53 |
49 |
|
|
Total Victims of Collisions Involving Commercial Vehicles |
391 |
373 |
403 |
373 |
353 |
|
|
Victims of All Other Collisions |
1,496 |
1,527 |
1,458 |
1,566 |
1,409 |
|
|
Total |
1,887 |
1,900 |
1,861 |
1,939 |
1,762 |
|
|
|
|
|
|
|
|
|
Injuries |
All Buses |
1,388 |
1,358 |
1,219 |
1,302 |
1,144 |
|
|
Straight Trucks > 4536 kg |
1,290 |
1,198 |
1,222 |
1,268 |
1,257 |
|
|
Tractor-Trailers |
1,089 |
1,000 |
1,118 |
1,111 |
998 |
|
|
Commercial Vehicle Occupant Total |
3,767 |
3,556 |
3,559 |
3,681 |
3,399 |
|
|
Occupants Of Other Vehicles Inv. With Commercial Vehicles |
6,972 |
6,657 |
6,794 |
6,870 |
6,820 |
|
|
Cyclists |
220 |
172 |
175 |
143 |
131 |
|
|
Pedestrians |
485 |
473 |
450 |
440 |
415 |
|
|
Total Victims Of Collisions Involving Commercial Vehicles |
11,490 |
10,891 |
11,006 |
11,164 |
10,807 |
|
|
Victims Of All Other Collisions |
149,316 |
147,963 |
141,767 |
137,901 |
129,994 |
|
|
Total |
160,806 |
158,854 |
152,773 |
149,065 |
140,801 |
|
|
|
|
|
|
|
|
|
Total |
All Buses |
1,391 |
1,363 |
1,224 |
1,322 |
1,144 |
|
Straight Trucks > 4536 kg |
1,307 |
1,213 |
1,241 |
1,291 |
1,274 |
|
|
|
Tractor-Trailers |
1,114 |
1,036 |
1,161 |
1,141 |
1,029 |
|
|
Commercial Vehicle Occupant Total |
3,812 |
3,612 |
3,626 |
3,754 |
3,447 |
|
|
Occupants Of Other Vehicles Inv. With Commercial Vehicles |
7,271 |
6,910 |
7,070 |
7,106 |
7,067 |
|
|
Cyclists |
227 |
185 |
186 |
153 |
139 |
|
|
Pedestrians |
525 |
523 |
498 |
493 |
464 |
|
|
Total Victims Of Collisions Involving Commercial Vehicles |
11,881 |
11,264 |
11,409 |
11,537 |
11,160 |
|
|
Victims Of All Other Collisions |
150,812 |
149,490 |
143,225 |
139,467 |
131,403 |
|
|
Total |
162,693 |
160,754 |
154,634 |
151,004 |
142,563 |
Figure 34 shows a downward trend in overall casualties (fatalities and serious injuries) resulting from CMV crashes from 1992 to 2019. The 1998-2007 period reveals an increasing trend, but this was followed by a significant drop between 2007 and 2009. Figure 35, focussed on the 2015-2019 period, shows a decrease in 2016 followed by increases in 2017 and 2018, and a decrease for the year 2019, with the lowest count since 1992, when we started gathering this data.
Figure 34: Total casualties in collisions involving commercial vehicles, 1992-2019
Text description
| Year | Total |
|---|---|
| 1992 | 15,331 |
| 1993 | 15,600 |
| 1994 | 16,321 |
| 1995 | 15,614 |
| 1996 | 15,155 |
| 1997 | 15,390 |
| 1998 | 14,047 |
| 1999 | 14,650 |
| 2000 | 14,939 |
| 2001 | 14,508 |
| 2002 | 15,218 |
| 2003 | 15,474 |
| 2004 | 15,912 |
| 2005 | 16,122 |
| 2006 | 15,592 |
| 2007 | 15,782 |
| 2008 | 14,428 |
| 2009 | 12,576 |
| 2010 | 13,045 |
| 2011 | 13,085 |
| 2012 | 12,368 |
| 2013 | 12,269 |
| 2014 | 12,340 |
| 2015 | 11,881 |
| 2016 | 11,264 |
| 2017 | 11,409 |
| 2018 | 11,537 |
| 2019 | 11,160 |
Figure 35: Total casualties in collisions involving commercial vehicles, 2015-2019
Text description
| Year | Total |
|---|---|
| 2015 | 11,881 |
| 2016 | 11,264 |
| 2017 | 11,409 |
| 2018 | 11,537 |
| 2019 | 11,160 |
Figures 36 indicates a downward trend in fatalities resulting from CMV crashes from 1992 to 2019, with a significant drop between 2007 and 2010. With regards to the 2015-2019 period, figure 37 shows a decrease in 2016, an increase in 2017 and sharp decreases in 2018 and 2019, creating a global downward trend. Fatalities related to CMV crashes went from 391 in 2015 to 353 in 2019, a 9.7% decrease and also the lowest count since 1992.
Figure 36: Fatalities in collisions involving commercial vehicles, 1992-2019
Text description
| Year | Total |
|---|---|
| 1992 | 587 |
| 1993 | 669 |
| 1994 | 643 |
| 1995 | 608 |
| 1996 | 561 |
| 1997 | 675 |
| 1998 | 564 |
| 1999 | 587 |
| 2000 | 600 |
| 2001 | 553 |
| 2002 | 572 |
| 2003 | 573 |
| 2004 | 585 |
| 2005 | 570 |
| 2006 | 553 |
| 2007 | 564 |
| 2008 | 497 |
| 2009 | 437 |
| 2010 | 412 |
| 2011 | 427 |
| 2012 | 405 |
| 2013 | 406 |
| 2014 | 413 |
| 2015 | 391 |
| 2016 | 373 |
| 2017 | 403 |
| 2018 | 373 |
| 2019 | 353 |
Figure 37: Fatalities in collisions involving commercial vehicles, 2015-2019
Text description
| Year | Total |
|---|---|
| 2015 | 391 |
| 2016 | 373 |
| 2017 | 403 |
| 2018 | 373 |
| 2019 | 353 |
Figure 38 illustrates that for the 2015-2019 period, the majority (68%) of fatalities resulting from CMV crashes were the occupants of LDVs involved in these collisions. CMV occupants represented 15% of the fatalities, pedestrians 12.4% and cyclists 2.5%. Figure 39 plots the data on pedestrians and cyclists (vulnerable road users - or VRUs) fatally injured in CMV crashes. As can be seen, there is an increasing trend in pedestrians' fatalities.
In 2016 Transport Canada launched a task force with provincial and municipal stakeholders to address this issue. In the following years, various efforts were undertaken to identify causal factors and potential countermeasures to mitigate crashes involving VRUs and heavy vehicles. These efforts came to fruition in 2018 and 2019 with the publication of various deliverables. Broadly speaking, the investigations show that the problem is largely due to an inability of the drivers of heavy vehicles to detect the presence of adjacent VRUs, and pedestrians and cyclists not being fully aware of the intentions and trajectories of the heavy trucks. It was concluded that improvements to on-board driver-assistance safety systems and greater public awareness of the dangers posed by heavy vehicles operating in urban environments would be efficient countermeasures. Subsequent work was undertaken in both these areas.
Figure 38: Fatalities of CMV occupants and other road users involved in CMV collisions, 2015-2019
Text description
| Year | CMV occupants | LDV occupants | Cyclists | Pedestrians |
|---|---|---|---|---|
| 2015 | 45 | 299 | 7 | 40 |
| 2016 | 56 | 253 | 13 | 50 |
| 2017 | 67 | 276 | 11 | 48 |
| 2018 | 73 | 236 | 10 | 53 |
| 2019 | 48 | 247 | 8 | 49 |
Figure 39: Fatalities of vulnerable road users involved in CMV collisions, 2015-2019
Text description
| Year | Cyclists | Pedestrians |
|---|---|---|
| 2015 | 7 | 40 |
| 2016 | 13 | 50 |
| 2017 | 11 | 48 |
| 2018 | 10 | 53 |
| 2019 | 8 | 49 |
In terms of CMV occupant fatalities, figure 40 reveals an increasing trend from 2015 to 2018 followed by a significant decrease in 2019, nevertheless resulting in an overall increasing trend for the period. Looking at CMV occupant fatalities per category of heavy vehicles for the same period, figure 41 indicates an upward trend for tractor-trailers from 2015 to 2017 followed by a significant decrease in 2018 and a stable situation 2019. There was a mild increasing trend for straight trucks occupants for the period. With regards to bus occupants, the year 2018 was marked by a tragedy, when a charter bus carrying the Humboldt junior hockey team collided with a tractor-trailer, killing 16 occupants, and injuring 13.
Figure 40: CMV occupants' fatalities in road crashes, 2015-2019
Text description
| Year | Fatalties |
|---|---|
| 2015 | 45 |
| 2016 | 56 |
| 2017 | 67 |
| 2018 | 73 |
| 2019 | 48 |
Figure 41: CMV occupant fatalities by categories of CMV, 2015-2019
Text description
| Year | Buses | Straight trucks | Tractor -trailers |
|---|---|---|---|
| 2015 | 3 | 17 | 25 |
| 2016 | 5 | 15 | 36 |
| 2017 | 5 | 19 | 43 |
| 2018 | 20 | 23 | 30 |
| 2019 | 0 | 17 | 31 |
With regard to injuries resulting from CMV crashes, figure 42 also reveals a downward trend between 1992 and 2019, again with a significant drop from 2007 to 2009. For the 2015-2019 period, figure 43 shows a significant decrease in 2016, mild increases in 2017 and 2018 and a decrease in 2019, again with the lowest number since 1992. The overall result for the period is a downward trend, with a 6% reduction between 2015 and 2019.
Figure 42: Injuries in collisions involving commercial vehicles, 1992-2019
Text description
| Year | Injuries in collisions involving commercial vehicles |
|---|---|
| 1992 | 14,744 |
| 1993 | 14,931 |
| 1994 | 15,678 |
| 1995 | 15,006 |
| 1996 | 14,594 |
| 1997 | 14,715 |
| 1998 | 13,483 |
| 1999 | 14,063 |
| 2000 | 14,339 |
| 2001 | 13,955 |
| 2002 | 14,646 |
| 2003 | 14,901 |
| 2004 | 15,327 |
| 2005 | 15,552 |
| 2006 | 15,039 |
| 2007 | 15,218 |
| 2008 | 13,931 |
| 2009 | 12,139 |
| 2010 | 12,633 |
| 2011 | 12,658 |
| 2012 | 11,963 |
| 2013 | 11,863 |
| 2014 | 11,927 |
| 2015 | 11,490 |
| 2016 | 10,891 |
| 2017 | 11,006 |
| 2018 | 11,164 |
| 2019 | 10,807 |
Figure 43: Injuries in collisions involving commercial vehicles, 2015-2019
Text description
| Year | Injuries in collisions involving commercial vehicles |
|---|---|
| 2015 | 11,490 |
| 2016 | 10,891 |
| 2017 | 11,006 |
| 2018 | 11,164 |
| 2019 | 10,807 |
Figure 44 indicates that for the 2015-2019 period, the majority (61.8%) of injuries resulting from CMV crashes were to the occupants of LDVs involved in these collisions. Injuries to CMV occupants represented 32.6% of cases, to pedestrians 3.9% and to cyclists 1.5%.
Figure 44: Injuries of CMV occupants and other road users involved in CMV collisions, 2015-2019
Text description
| Year | CMV occupants | LDV occupants | Cyclists | Pedestrians |
|---|---|---|---|---|
| 2015 | 3,767 | 6,972 | 220 | 485 |
| 2016 | 3,556 | 6,657 | 172 | 473 |
| 2017 | 3,559 | 6,794 | 175 | 450 |
| 2018 | 3,681 | 6,870 | 143 | 440 |
| 2019 | 33,99 | 6,820 | 131 | 415 |
Figure 45: Injuries of vulnerable road users involved in CMV collisions, 2015-2019
Text description
| Year | Cyclists | Pedestrians |
|---|---|---|
| 2015 | 220 | 485 |
| 2016 | 172 | 473 |
| 2017 | 175 | 450 |
| 2018 | 143 | 440 |
| 2019 | 131 | 415 |
Figure 45 shows that pedestrians are more at risk to be injured in a collision involving heavy vehicles than cyclist. Contrary to the situation for VRUs fatalities, there is a mild decreasing trend for injuries over the 2015-2019 period for both pedestrians and cyclists.
Figure 46: CMV occupants' injuries resulting from road crashes, 2015-2019
Text description
| Year | Total |
|---|---|
| 2015 | 3,767 |
| 2016 | 3,556 |
| 2017 | 3,559 |
| 2018 | 3,681 |
| 2019 | 3,399 |
With regards to CMV occupant injuries, figure 46 reveals a decrease in 2016, a mild increasing trend up to 2018 and a sharp drop in 2019, creating an overall downward trend for the period, with 9.7% fewer injuries in 2019 than in 2015. Looking at heavy vehicle categories, figure 47 indicates that on average for the 2015-2019 period, bus occupants (including passengers) represent 35.7% of injuries, straight truck occupants 34.7% and occupants of tractor trailers 29.6%.
Figure 47: CMV occupant injuries resulting from road crashes by category of CMV, 2015-2019
Text description
| Year | Buses | Straight trucks | Tractor -trailers |
|---|---|---|---|
| 2015 | 1,388 | 1,290 | 1,089 |
| 2016 | 1,358 | 1,198 | 1,000 |
| 2017 | 1,219 | 1,222 | 1,118 |
| 2018 | 1,302 | 1,268 | 1,111 |
| 2019 | 1,144 | 1,257 | 998 |
Part II Summary
The safety assessment presented in Part II of this report paints a picture where numerous road safety indicators show improving trends. Some of the data presented look back as far as 1992, enabling a wider overview of the situation. The positive trending is very significant over the long term. Looking at the 2015-2019 period, and more specifically at the year 2019, comprehensive assessments also reveal positive trending, although with more variability, depending on which variable is assessed.
Data related to general road user casualties reveal a steadily improving situation, even in the face of increasing exposure and a rising number of all classes of vehicles on Canadian roads. As such, the year 2019 shows the lowest road fatality rate in recent history. This could be related to incremental safety initiatives undertaken by governments and industry, on the basis of sound scientific research, policy and countermeasures development. Nevertheless, with a remaining 1762 road fatalities in 2019, it is clear that efforts to lower these numbers further need to remain significant, focussed, data driven and innovative.
The positive trending is also apparent when looking at the safety performance of the Canadian motor carrier industry. Even in the presence of increasing traffic and growing economic activity, the number of fatalities and injuries related to heavy vehicle crashes is decreasing over time. The lowest number of fatalities since 1992 was recorded in 2019 with a count of 353, 48% less than the highest count of 675 observed in 1997. Looking at the 2015-2019 period, there is a general decreasing trend, although the number of fatalities increased in 2017. With regards to injuries, there is again a significant positive trend since 1992. Looking at the 2015-2019 period, there was a drop in 2016, two consecutive years of mild increases in 2017 and 2018, followed by another significant drop in 2019, with a total 10,807 injured, the lowest count since 1992.
Looking more closely at CMV crashes, the data reveals that heavy vehicles are over-represented in fatal collisions compared to other classes of vehicles. For the 2015-2019 period, while CMVs represented only 4.8% of total vehicles involved in road crashes, they were associated with 20.2% of road fatalities. This reality is mainly explained by CMVs' relative weight and mass compared to that of light-duty vehicles. Consequently, for the period, 68% of the fatalities resulting from CMV crashes occurred in light duty vehicles involved in those crashes. CMV occupants represented 15% of fatalities, pedestrians 12.4% and cyclists 2.5%. Furthermore, tractor-trailers were over-represented in fatal crashes and buses and straight-trucks in injury crashes.
The safety assessment also leveraged an econometric forecasting model based on data from the Canadian Vehicle Survey (CVS), the Canadian Vehicle Use Survey (CVUS) and Statistics Canada data tables to estimate exposure trends and crash rates for straight trucks > 4,500 kg, tractor-trailers > than 15,000 kg and all heavy trucks (a combination of both categories). The model estimates an overall increase in heavy trucks VKT for the 2013-2019 period. The model further suggests that this increase in exposure did not translate into a deterioration of safety performance. In fact, fatal and injury crash rates calculated on the basis of the model and NCDB data have both been decreasing between 2005 and 2019 (55.8% for fatal crashes and 57.4% for injury crashes).
With regards to crash contributing factors as assessed by police officers at crash scenes, NCDB data shows that for the 2015-2019 period vehicle defects were associated with less than 4% of crashes. Driver actions, and to a lesser extent driver condition, were identified as more significant contributing factors. While the numbers are low and driver conditions was considered as “not normal” in only 5% of fatal CMV crashes, fatigue and alcohol were identified as key contributing factors for those crashes. With regards to driver actions, when drivers were considered as “not driving properly”, in 27.2% of fatal CMV crashes, inattention and speeding were the top contributors.
In sum, NCDB data for the 2015-2019 period reveals that inattention and driving too fast are key crash contributing factors for heavy vehicle fatal crashes in Canada. This is consistent with the comprehensive assessment detailed in the final report of CCMTA's Human Factors and Motor Carrier Safety Task ForceFootnote 9.
Annex 1 - Abbreviations for Provinces and Territories
-
Alberta
-
AB
-
British Columbia
-
BC
-
Manitoba
-
MB
-
New Brunswick
-
NB
-
Newfoundland and Labrador
-
NL
-
Northwest Territories
-
NT
-
Nova Scotia
-
NS
-
Nunavut
-
NU
-
Ontario
-
ON
-
Prince Edward Island
-
PE
-
Quebec
-
QC
-
Saskatchewan
-
SK
-
Yukon
-
YT