TYPICAL DATA DISPLAYS AND REPORTS
The main purpose of the displays shown in the following examples is to pro-vide the operator's management (including the reliability control committee, where appropriate) and DOT, with a readily understandable depiction of fleet reliability for the period under review.
Information may be presented in either graphical or tabular format, provided that the method adopted conveys the required information clearly. Tabular displays generally provide more precise information, while graphical dis-plays are preferable for indicating trends. It is usual to show current performance as it relates to past experience, and where appropriate the current alert level is shown for reference.
A well developed reliability program may be completely integrated with the carrier's overall maintenance management system, therefore displays may also incorporate data required for other economic or quality control functions, such as ratio of commercial to non-revenue flying, cost-benefit analyses for proposed modification action, identification of recurring defects, etc.
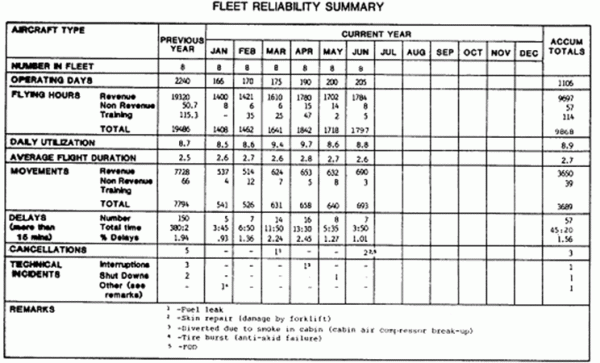
Example 1 - Fleet reliability summary
This display (fig. 1, opposite) applies to all aircraft of the same type in the fleet, is usually produced in tabular form, and should contain the fol-lowing minimum information for the defined reporting period:-
- Number of aircraft in fleet;
- Number of operating days (less checks);
- Total number of flying hours;
- Average daily utilization per aircraft;
- Average flight duration;
- Total number of landings; and
- Total number of delays/cancellations.
Figure 1
Example 2 -Aircraft mechanical delays/cancellations
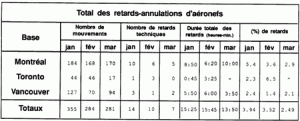
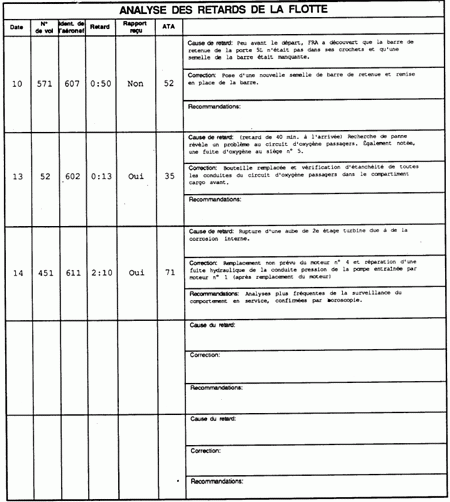
This type of display indicates the aircraft systems which have caused delays or cancellations as a result of mechanical malfunctions. It is normal to present a display of the total aircraft delays/cancellations as shown in figure 2a to indicate the occurrences due to all systems as a measure of fleet overall reliability. This is often supplemented by an analysis of each delay, showing the component(s) responsible, action taken and recom-mendations for future action to prevent a recurrence (fig. 2b). Some pro-grams present delay information by ATA system. The displays for the sepa-rate systems will usually show the delay/cancellation rate for the defined reporting period, and where appropriate the alert level, and will present the information for a 12 months period.
Figure 2a
Figure 2b
| FLEET DELAY ANALYSIS | ||||||
|---|---|---|---|---|---|---|
| DATE | FLT No. |
ACFT IDENT. |
DELAY | REPORT Rcvd | ATA | |
| 10 | 571 | 607 | 0:50 | NO | 52 | REASON FOR DELAY: Shortly before dep. FRA found girt bar door 5L off hooks and one girt bar shoe missing. |
| RECTIFICATION: New girt bar shoe installed and girt bar re-installed. | ||||||
| RECOMMENDATIONS: | ||||||
| 13 | 52 | 602 | 0:13 | YES | 35 | REASON FOR DELAY: (40 min. late inbd) T/S repeated pax 0zindication problem. Also noted #5 pax 0z leaking. |
| RECTIFICATION: Bottle replaced and leak check accomplished on all pax 0z lines in fwd cargo compt. | ||||||
| RECOMMENDATION: | ||||||
| 14 | 451 | 611 | 2:10 | YES | 71 | REASON FOR DELAY: #4 engine unscheduled change and repairing hyd leak on EDP pressure line engine # 1 (after engine change). |
| RECTIFICATION: 2nd stage turbine blade failure due internal corrosion. | ||||||
| RECOMMENDATION: | ||||||
| REASON FOR DELAY: | ||||||
| RECTIFICATION: | ||||||
| RECOMMENDATION: | ||||||
| REASON FOR DELAY: | ||||||
| RECTIFICATION: | ||||||
| RECOMMENDATION: | ||||||
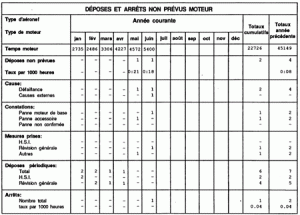
Example 3 -Engine unscheduled shutdowns and unscheduled removals
These data are the prime indicators of engine in-service reliability, and also, to a large degree, of total powerplant reliability. Because of the high level of reliability of engines, and the consequent relatively low num-bers of unscheduled shutdowns per fleet, both the actual number of shut-downs and the shutdown rate per 1,000 hours are shown. When dealing with small numbers of unscheduled shutdowns, it is usual to present both types of in-formation in such a way as to show the trend over a two to three year peri-od. Many operators show scheduled removals, unscheduled removals and in-flight shutdowns on the same display, as shown in figure 3.
Figure 3
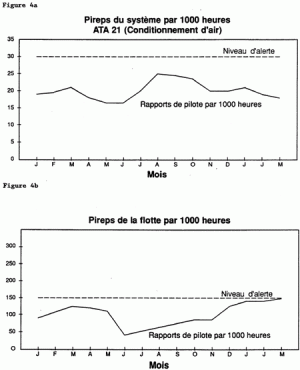
Example 4 -Pireps
Pireps are presented by system or subsystem (normally identified in accor-d-ance with ATA 100) in graphical and/or tabular form as a rate per 1,000 flight hours or 100 departures, for comparison with the alert level (see fig. 4a). Some programs may include a presentation of fleet Pireps (see fig. 4b). This presentation shows the total number of Pireps for all systems and subsystems and thus gives an overall picture of the operator's total Pireps for the aircraft type.
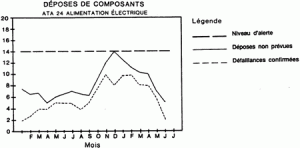
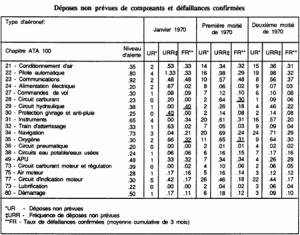
Example 5 -Component unscheduled removals and confirmed failures
The format of any display of component information is normally such that current performance may be compared with both the alert rates and with the performance of the previous reporting period. The inclusion of information relating to the confirmation of the reported failures provides an additional check on the effectiveness of trouble shooting procedures.
There are various methods of displaying component information. The display may be on the basis of the total number of affected components per system and be presented graphically (see fig. 5a below) or in tabular form (see fig. 5b opposite). Alternatively, components may be addressed individually as shown in example 6, on the following page.
Figure 5a
Figure 5b
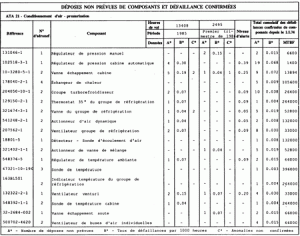
Example 6 -Unscheduled removals and confirmed failures
Experience has shown that a tabular presentation on an individual component basis is often the most useful means of displaying unscheduled removals and confirmed failures. The example shown in fig. 6 demonstrates this type of presentation. The preparation of such a display is time consuming, but it has the advantage of readily identifying troublesome components. Probably the most practical approach is the use of graphical system based displays for all systems, supplemented by a component based tabular display of the type shown opposite, for the most trouble-prone sys-tems.
Figure 6
Example 7 -Workshop reports
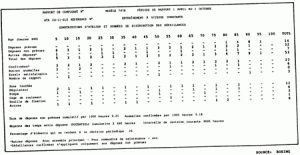
Computer printouts are sometimes used to display the distribution of fail-ures of particular components as a function of time in service. The nature of the defects, as disclosed by shop findings, may also be displayed on the same report. An example of this type of display is shown in figure 7a.
In this example, the wide distribution of times between unscheduled remov-als, and the low mean time between failures (MTBF) of 5690 hrs indicate that the current hard time between overhauls (TBO) of 9000 hrs may be inappro-priate. The small percentage of units remaining in service for the full TBO (26%), and the fact that 22% of the unscheduled removals occurred within the first 900 hrs of operation would warrant further investigation.
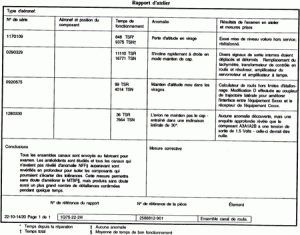
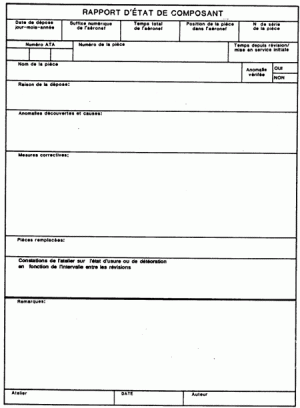
A summary of the results of defect investigations, based on the workshop reports, is normally produced by component type, as shown in figure 7b, while a more comprehensive form, providing space for detailed comments on each component, is illustrated in figure 7c.
Figure 7a
Figure 7b
Figure 7c
Example 8 -Component removals by ATA chapter and by individual aircraft
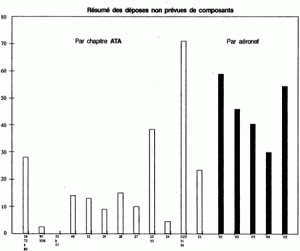
The type of display shown in fig. 8 illustrates the relative numbers of components removed from each system, and also shows the distribution of component removals among the various aircraft in the fleet.
While lacking the detail needed to identify specific problem areas, it has the advantage of clearly showing the troublesome systems, and of identifying any aircraft with reliability markedly different from the fleet norm. When combined with similar displays of reported defects and confirmed failures, it can often alert operators to subtle system problems.
Figure 8
Example 9 -Recalculation of alert levels
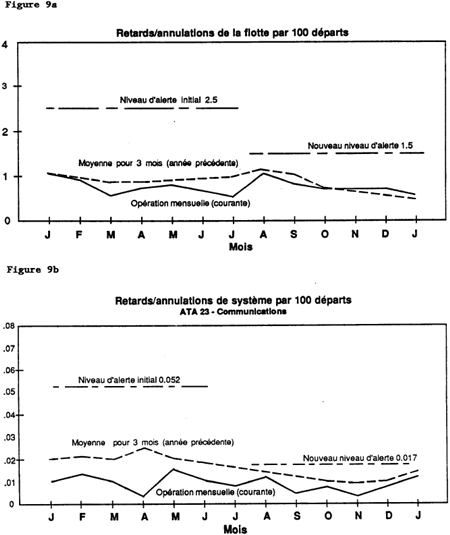
Sometimes, after a period of operation, it becomes apparent that improve-ments in system reliability have rendered the existing alert levels obso-lete. With a good graphic display system, such a situation will be obvious to the naked eye. In these circumstances it is normal to recalculate the alert level, based on current performance, and to display the change as shown in figures 9a and 9b.
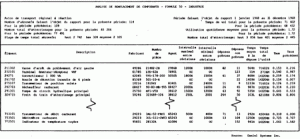
Example 10 -Component replacement analysis (industry)
The display shown in figure 10 is an example of a computerized printout, provided as part of a multi-participant reliability program. The example shown is just one of a number of different displays used by this type of program, which is intended to supply planning, cost analysis and other management services in addition to reliability monitoring, to operators who do not have the resources to handle all of these functions "in house".
These programs may be "real time, on line", where a computer terminal is installed in the operator's facility, with access to a main computer under the control of the supplier, or alternatively may be "batch" type programs where the operator provides input by mail and receives printouts on a regular basis, usually monthly.
The particular printout shown provides data based on all aircraft of the type which are participating in the scheme, thus enabling each participant to compare his performance with the fleet norm.
Figure 10
Example 11 -Review of service bulletins
Changes in the manufacturers recommendations must be evaluated to assess their applicability to the operator's fleet. Such changes often take the form of service bul-letins, and a system to evaluate these should be included in every reliabil-ity program. The system can take many forms, from a sub-jective review by the Director of Maintenance, who indicates his decision in the margin of the bulletin (in the case of a small operator), to a full analysis, using MSG-2 or MSG-3 as appropriate, by the reliability control committee, acting as an "internal MRB" (in the case of a large air car-rier).
An example of another method is shown opposite, in figure 11. With this procedure, each element of the technical organization carries out its own assessment of the safety, opera-tional and economic aspects of the bulletin, and makes a recommendation. The senior executive responsible for mainte-nance (usually the vice presi-dent, maintenance and engineering) then makes the final decision.
In the example shown, the recommendations of the various technical depart-ments are entered on the back of the form.
Figure 11
Example 12 -Global fleet summary
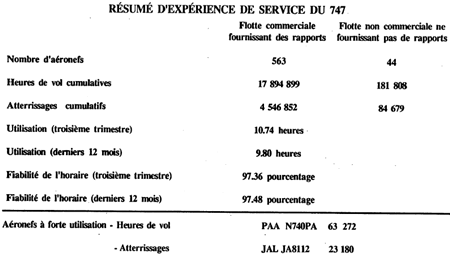
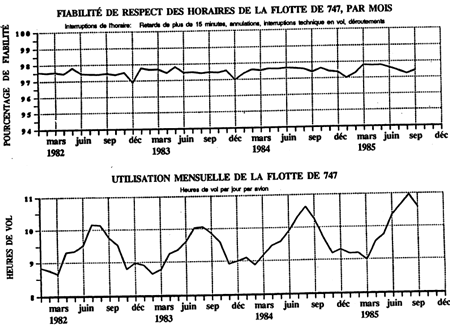
Some manufacturers provide regular reports on the reliability performance of the entire fleet so that individual operators can compare their performance with the norm. Some examples from such a report, in this case published by the Boeing Airplane Co., are reproduced on the following pages. Fig. 12a provides an overall summary of the experience of the reporting operators, fig. 12b shows fleet schedule reliability and fleet utilization, and the histograms in fig. 12c provide a comparison of the individual operators schedule reliability, severity index and utilization with those of the rest of the fleet.
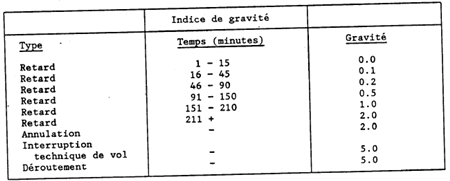
"Severity index" is a means of weighting the severity of schedule interrup-tions according to their effect on operations, in this case using the scale shown below.
Figure 12a
Figure 12b
Figure 12c
