The 2016 Annual Report outlines the progress made under Canada’s Action Plan to Reduce Greenhouse Gas Emissions from Aviation.
On this page
- Executive summary
- Background
- Highlights for 2016
- Results for 2016
- Reporting on section 5.0 measures
- Reporting on section 6.0 measures
- Conclusions
- Appendix A: Glossary of key terms and acronyms
- Appendix B: Calculations and caveats
- Appendix C: List of signatories and air operator member companies reporting
- Appendix D: Additional figures illustrating key trends
Executive summary
This is the fifth Annual Report under Canada’s Action Plan to Reduce Greenhouse Gas Emissions from Aviation (the Action Plan).
In 2016, good progress was made on the implementation of measures under the Action Plan, including a number of noteworthy achievements associated with aircraft fleet renewal, Air Traffic Management (ATM), Canada’s involvement in the negotiation of the Carbon Offsetting and Reduction Scheme for International Aviation (CORSIA), and the endorsement of the new international CO2 standard certification requirement and regulatory level by the International Civil Aviation Organization’s (ICAO) Committee on Aviation Environmental Protection (CAEP).
Canadian air carriers have collected the necessary data to track fuel efficiency improvements achieved in 2016. As a result of a review undertaken in 2015, parties of the Action Plan agreed to evaluate progress against the Air Transport Action Group’s (ATAG) target to improve fuel efficiency by 1.5 percent annual average until 2020 from a 2008 baseline of 39.47 litres per 100 Revenue Tonne-Kilometres (RTK). Compared with 2015, Canadian air carriers improved fuel efficiency by 3.2 percent, which represents a 1.73 percent annual average improvement, from a 2008 baseline, or a cumulative improvement of 13.0 percent from 2008 to 2016. The results indicate that Canadian air carriers continue to show leadership in improving their annual fuel efficiency, albeit slightly below the 2 percent aspirational goal.
Section 5.0 of the Action Plan identifies measures that are expected to have the greatest impact on reducing greenhouse gas (GHG) emissions. These measures include fleet renewals and upgrades, more efficient air operations, and improved ATM capabilities.
Section 6.0 of the Action Plan highlights progress on a second set of measures that the Canadian aviation industry expects will produce beneficial environmental results in the future. These measures include aviation environmental research and development, alternative fuels, airport ground operations and infrastructure use, regulatory measures, and international coordination.
Finally, this Annual Report provides a preview of some important 2017 milestones, including the installation of six preconditioned air and ground power units at boarding gates at the Vancouver International Airport, the participation and Level I accreditation of Halifax Stanfield International Airport under the Airport Carbon Accreditation (ACA) program, fleet renewal plans for the National Air Council of Canada (NACC) and Air Transport Association of Canada (ATAC) carriers, and updates on the NAV CANADA RNP AR (Required Navigation Performance Authorization Required) projects.
Background
On June 4, 2012, the Government of Canada and the Canadian aviation industry released Canada’s Action Plan to Reduce Greenhouse Gas Emissions from Aviation (the Action Plan) and submitted it to the International Civil Aviation Organization (ICAO). Developed by a joint industry-government Working Group on Aviation Emissions, the Action Plan:
- Builds on the success of previous collaborations between the Government of Canada and Canada’s aviation stakeholders. This includes the world’s first voluntary agreement to reduce GHG emissions from aviation, which was signed in 2005 between Transport Canada and the Air Transport Association of Canada (ATAC) on behalf of its member carriers.
- Commits to annual reporting to summarize and track progress towards meeting the fuel efficiency goal and other Action Plan activities. This is the fifth Annual Report published under the Action Plan.
- Describes ongoing and planned initiatives to address GHG emissions from Canada’s domestic and international aviation activities. These measures could contribute to reductions in Canada’s domestic emissions and ICAO’s global aspirational goals.
The Working Group on Aviation Emissions committed to review the Action Plan and its associated activities in 2015 in accordance with section 7.3. This review was undertaken in alignment with the ICAO’s guidance that States review and, if necessary, update their Action Plans every three years. As a result of the review, the parties of the Action Plan agreed to evaluate progress against the Air Transport Action Group (ATAG) target to improve fuel efficiency by a 1.5 percent annual average until 2020 from a 2008 baseline of 39.47 litres of fuel per 100 Revenue Tonne-Kilometres (L/100 RTK). The ATAG is an independent coalition that represents all sectors of the air transport industry, working to promote aviation’s sustainable growth.
Canada will also continue to pursue and report against the 2012 aspirational goal to improve fuel efficiency of Canada’s air carriers by a 2 percent annual average until 2020, from a 2005 baseline of 40.43 L/100 RTK.
The Action Plan identifies measures that are expected to have the greatest impact in reducing GHG emissions:
- fleet renewals and upgrades
- more efficient air operations
- improved capabilities in air traffic management
- aviation environmental research and development
- alternative fuels
- airport ground operations and infrastructure use
- regulatory measures
- international coordination
Highlights for 2016
Canada has made good progress on the implementation of the Action Plan. Working Group members took advantage of opportunities to advance collaboratively a number of Action Plan measures. Several measures were achieved in 2016, including the following:
Fleet renewals and upgrades
Canadian airlines continued to upgrade their overall fleet operating efficiencies by replacing older generation aircraft with new and more efficient aircraft and engine types. These fleet changes have a positive impact on operating efficiency for both all-passenger and all-cargo type operations.
Air traffic management
Successful implementation of new RNP AR (Required Navigation Performance Authorization Required) approaches in 2016 by NAV CANADA at Kelowna, Calgary International, Ottawa International and Halifax International airports are resulting in immediate GHG reductions. Use of these approaches by an increasing number of aircraft types and operators is paving the way for additional savings from implementations at Edmonton, St. John’s and Winnipeg International Airports in 2017.
Research and development
A number of advances were made with respect to aviation environmental research and development. These include five Green Aviation Research and Development Network (GARDN) projects focusing on bio-derived jet fuel applications for Canada and a series of National Research Council of Canada (NRC) initiatives pertaining to non-volatile particulate matter (nvPM) certification requirements and unleaded aviation gasoline testing.
International coordination
Canada played an active role in the negotiation of the Carbon Offsetting and Reduction Scheme for International Aviation (CORSIA) which addresses GHG emissions from international civil aviation. In addition, work continued on the nvPM standard and the new international CO2 standard certification requirement and regulatory level were endorsed by the ICAO Committee on Aviation Environmental Protection (CAEP) in early 2016.
Pan-Canadian Framework on Clean Growth and Climate Change
In support of ambitious global action to combat climate change agreed to in Paris, the Government of Canada, in collaboration with the Provinces and Territories, jointly released the Pan-Canadian Framework on Clean Growth and Climate Change in December 2016. The four main pillars of the framework are:
- pricing carbon pollution
- complementary measures to further reduce emissions across the economy
- measures to adapt to the impacts of climate change and build resilience and
- actions to accelerate innovation, support clean technology, and create jobs
This includes a number of elements related to the environmental performance of the transportation sector, such as:
- setting emissions standards and improving efficiency
- transportation infrastructure investments and
- using cleaner fuels
For more information on the Pan-Canadian Framework, please visit: https://www.canada.ca/en/services/environment/weather/climatechange/pan-canadian-framework.html
Results for 2016
The Air Transport Association of Canada (ATAC) and the National Airlines Council of Canada (NACC) have collected the data required to report on the fuel efficiency improvements achieved in 2016. Note: the number of air carriers that provide data under the Action Plan have changed from year to year. As a result, the statistics presented in this report may not be entirely comparable with those in other years.
Although progress towards the Action Plan’s target is measured in terms of litres of fuel used per Revenue Tonne-Kilometre (RTK), the air operator associations have provided additional data (see Appendix A: Glossary of Key Terms and Acronyms for definitions) to calculate the industry’s main activity measures. Other key aviation activity measurements include:
- revenue passenger-kilometres (RPK)
- passenger revenue tonne-kilometres (Passenger RTK)
- cargo revenue tonne-kilometres (Cargo RTK)
- total revenue tonne-kilometres (Total RTK)
Canadian biojet supply chain initiative (CBSCI)
Air Canada, with support from Transport Canada, the National Research Council of Canada, and others, are participating in Canada’s Biojet Supply Chain Initiative (CBSCI). This is a three-year collaborative project, primarily funded by the Green Aviation Research and Development Network (GARDN), which started in 2015 and is aiming to introduce 200,000 litres of sustainable aviation biofuel into the shared fuel system at Toronto Pearson International Airport. Additional project deliverables include demonstrating the operational feasibility of biojet fuels in the Canadian jet fuel supply chain, further the development of the domestic biojet sector, validate Canadian biojet supply chain elements, and to generate hands-on experience with biojet handling and integration to develop best practices in a Canadian context.
Table 1 illustrates the combined results for ATAC and NACC air carriers for calendar years 2005 to 2016. It shows trends in fuel consumption and its conversion to GHG emissions, expressed in carbon dioxide equivalent (CO2e); as well as ratios of litres of fuel and grams of CO2e per RPK and total RTK.
Table 1 also shows the following results from the reporting carriers in 2016 (in slightly rounded figures):
- The combined fuel consumption rate was 34.33 litres per 100 RTK, which is an annual average improvement between 2008 and 2016 of 1.73 percent
- Revenue service was 22.0 billion total RTK (19.4 billion passenger RTK and 2.6 billion cargo RTK)
| 2005 | 2006 | 2007 | 2008 | 2009 | 2010 | 2011 | 2012 | 2013 | 2014 | 2015 | 2016 | |
|---|---|---|---|---|---|---|---|---|---|---|---|---|
| Fuel use (million litres) | 4,887 | 5,186 | 5,543 | 5,575 | 5,098 | 5,659 | 6,089 | 6,256 | 6,314 | 6,579 | 7,023 | 7,555 |
| GHG emissions (megatonnes of CO2e) | 12.619 | 13.390 | 14.312 | 14.396 | 13.164 | 14.611 | 15.721 | 16.153 | 16.303 | 16.987 | 18.132 | 19.506 |
| Traffic (billions) | ||||||||||||
| Revenue passenger-kilometres (RPK) | 105.22 | 112.98 | 124.15 | 125.55 | 117.62 | 128.77 | 141.27 | 148.74 | 150.92 | 161.62 | 175.66 | 193.98 |
| Passenger revenue-tonne-kilometres (pass. RTK)Footnote * | 10.52 | 11.30 | 12.42 | 12.55 | 11.76 | 12.88 | 14.13 | 14.87 | 15.09 | 16.16 | 17.57 | 19.40 |
| Cargo revenue-tonne-kilometres (cargo RTK) | 1.57 | 1.53 | 1.82 | 1.57 | 1.38 | 2.01 | 1.98 | 1.96 | 2.05 | 2.25 | 2.24 | 2.61 |
| Total revenue-tonne-kilometres (RTK) | 12.09 | 12.83 | 14.23 | 14.13 | 13.14 | 14.88 | 16.11 | 16.83 | 17.14 | 18.41 | 19.80 | 22.00 |
| Fuel consumption rates | ||||||||||||
| Litres/RPK | 0.0464 | 0.0459 | 0.0446 | 0.0444 | 0.0433 | 0.0439 | 0.0431 | 0.0421 | 0.0418 | 0.0407 | 0.0400 | 0.0389 |
| Litres/Total RTK | 0.4043 | 0.4043 | 0.3895 | 0.3947 | 0.3879 | 0.3802 | 0.3780 | 0.3716 | 0.3683 | 0.3574 | 0.3546 | 0.3433 |
| Emission rates | ||||||||||||
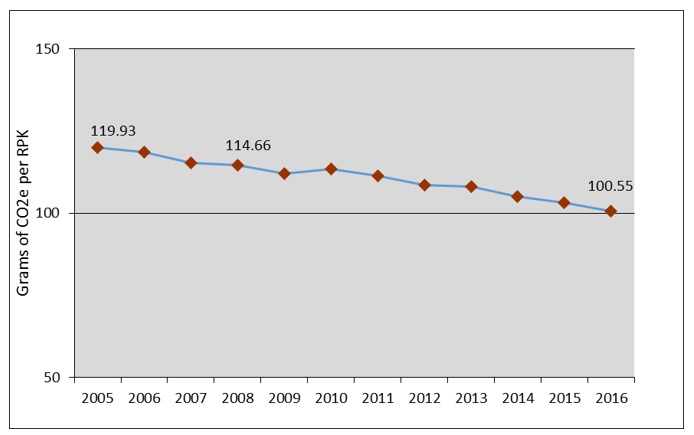
| CO2e grams/RPK | 119.93 | 118.52 | 115.28 | 114.66 | 111.92 | 113.47 | 111.28 | 108.59 | 108.03 | 105.11 | 103.22 | 100.55 |
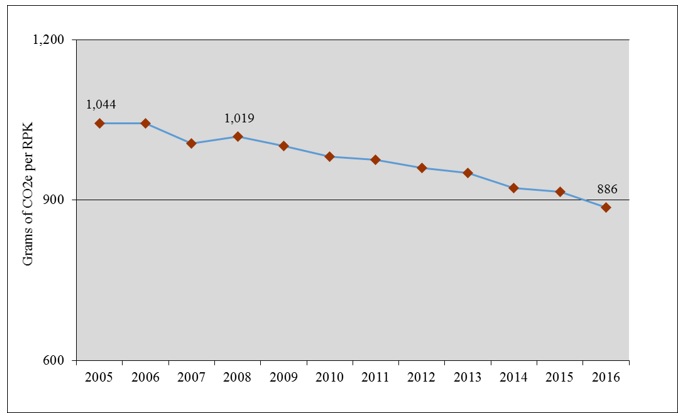
| CO2e grams/Total RTK | 1,044 | 1,044 | 1,006 | 1,019 | 1,002 | 982 | 976 | 960 | 951 | 923 | 916 | 886 |
**All GHG emissions included in this report have been calculated based on Environment and Climate Change Canada’s (ECCC) National Inventory Report 1990-2015.
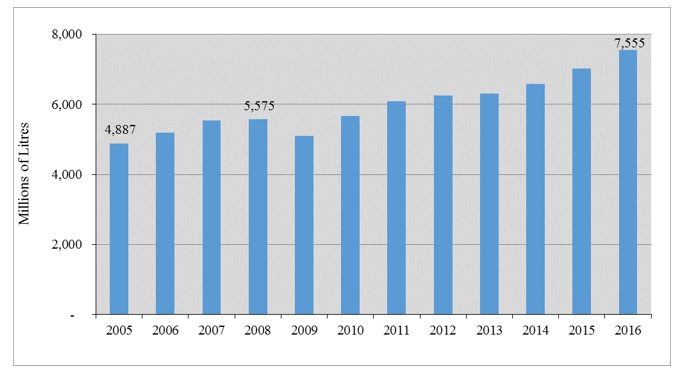
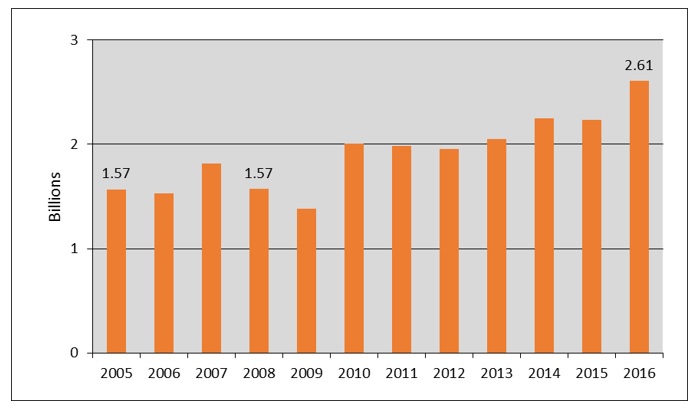
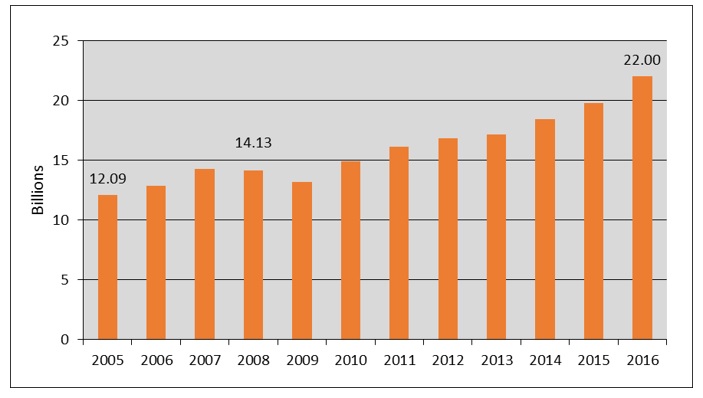
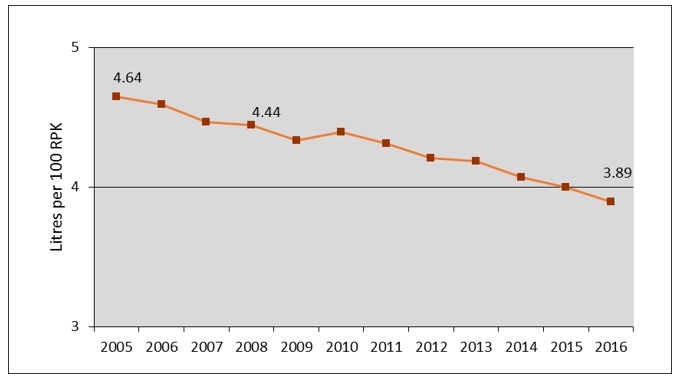
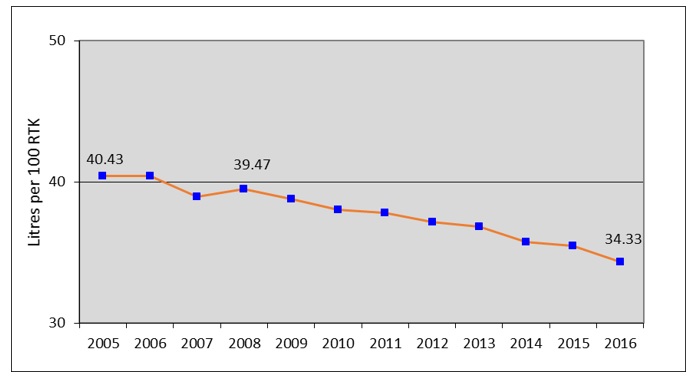
See Appendix D: Additional Figures Illustrating Key Trends for Figures 6, 7, 8, 9, 11, 12, 15 and 16 that illustrate trends presented in Table 1.
Canadian air carriers report aviation activity data for both domestic and international activities. Similar to the Intergovernmental Panel on Climate Change’s (IPCC) definition of international and domestic activities, the Action Plan defines international activity as flight segments that begin or end outside of Canada, whereas domestic activity includes flight segments within Canada.
Table 2 provides data on international versus domestic aviation activity for 2016.
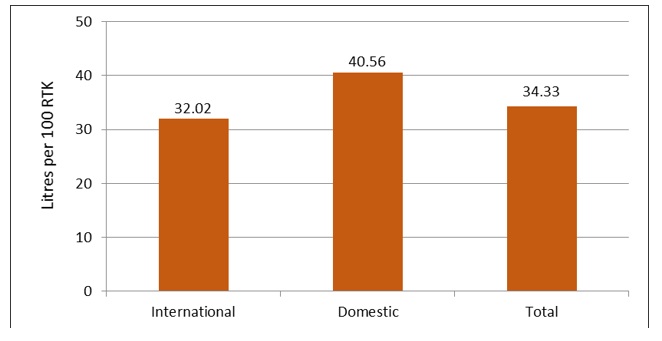
- Separately, the fuel consumption rate for international activity was 32.02 litres per 100 RTK, and 40.56 litres per 100 RTK for domestic activity. (Also illustrated in Figure 1)
- Total fuel consumed amounted to 7.56 billion litres (68.0 percent for international activity and 32.0 percent for domestic activity)
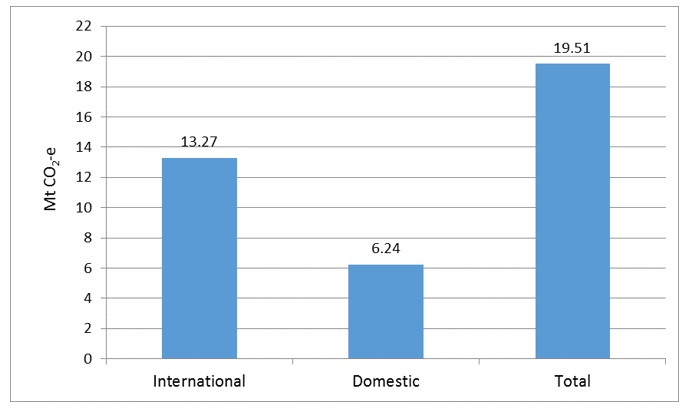
- Total GHG emissions amounted to an estimated 19.51 megatonnes (Mt) (13.27 Mt for international activity and 6.24 Mt for domestic activity)
| International | Domestic | Total | |
|---|---|---|---|
| Fuel use (million litres) | 5,140 | 2,415 | 7,555 |
| GHG emissions (megatonnes of CO2e) | 13.27 | 6.24 | 19.51 |
| Traffic (billions) | |||
| Revenue passenger-kilometres (RPK) | 140.3 | 53.7 | 194.0 |
| Passenger revenue-tonne-kilometres (pass. RTK) | 14.0 | 5.4 | 19.4 |
| Cargo revenue-tonne-kilometres (cargo RTK) | 2.0 | 0.6 | 2.6 |
| Total revenue-tonne-kilometres (RTK) | 16.1 | 6.0 | 22.0 |
| Fuel consumption rates | |||
| Litres/Total RTK | 0.3202 | 0.4056 | 0.3433 |
| Emission rates | |||
| CO2e grams/Total RTK | 827 | 1,047 | 886 |
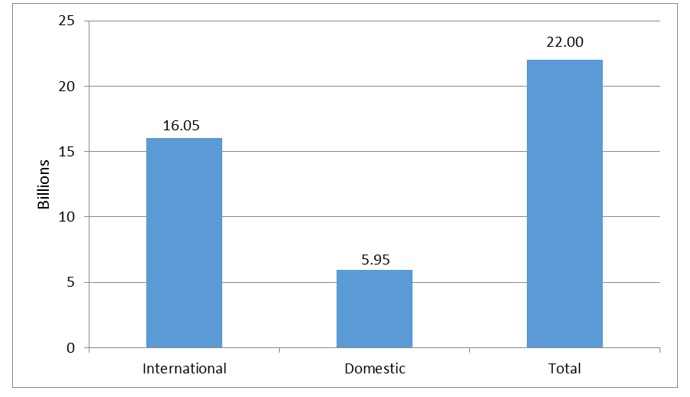
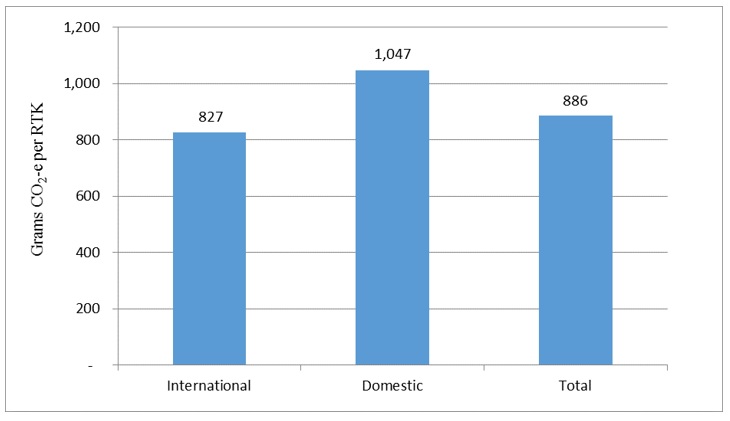
See Appendix D: Additional Figures Illustrating Key Trends for Figures 5, 10, 13 and 14 that illustrate trends presented in Table 2.
Figure 1: Fuel consumption rates, international and domestic, 2016
Figure 1: Fuel consumption rates, international and domestic, 2016 - Text version
| International | Domestic | Total | |
|---|---|---|---|
| Litres/Total RTK | 32.02 | 40.56 | 34.33 |
Carbon offsetting and reduction scheme for international aviation (CORSIA)
In October 2016, the International Civil Aviation Organization’s (ICAO) Assembly agreed to implement a global market-based measure to reduce greenhouse gas emissions from international civil aviation: the Carbon Offsetting and Reduction Scheme for International Aviation (CORSIA). Under the scheme, operators will be required to acquire acceptable emission units to work toward ICAO’s aspirational goal of carbon neutral growth from 2020. Mandatory monitoring, reporting and verification is set to begin in 2019, and the phase in of offset obligations will start in 2021. Canada played a key role in negotiations at ICAO that led to this historic agreement, and continues to participate in the development of Standards and Recommended Practices for CORSIA.
Canada’s progress (measured by ratio of fuel consumption to total traffic – litres/total RTK) is benchmarked against ATAG’s target of 1.5 percent annual average improvement in fuel efficiency to 2020 against a 2008 baseline.
Table 3 shows progress in improving fuel efficiency, illustrating the change in the measures and rates between 2015 and 2016, and between 2008 and 2016. Fuel efficiency in 2016 improved by 3.2 percent over 2015, and the cumulative improvement between 2008 and 2016 was 13.0 percent, or an annual average of 1.73 percent.
| Change 2015-2016 | Change 2008-2016 | ||||
|---|---|---|---|---|---|
| Absolute | Proportional | Absolute | Proportional | Annual Rate | |
| Fuel use (million litres) | 532 | 7.6% | 1,979 | 35.5% | 3.9% |
| GHG emissions (megatonnes of CO2e) | 1.37 | 7.6% | 5.1 | 35.5% | 3.9% |
| Traffic (billions) | |||||
| Revenue passenger-kilometres (RPK) | 18.3 | 10.4% | 68.4 | 54.5% | 5.6% |
| Passenger revenue-tonne-kilometres (pass. RTK) | 1.8 | 10.4% | 6.8 | 54.5% | 5.6% |
| Cargo revenue-tonne-kilometres (cargo RTK) | 0.4 | 16.6% | 1.0 | 65.9% | 6.5% |
| Total revenue-tonne-kilometres (RTK) | 2.2 | 11.1% | 7.9 | 55.8% | 5.7% |
| Fuel consumption ratesFootnote * | |||||
| Litres/RPK | -0.001 | -2.6% | -0.0055 | -12.3% | -1.63% |
| Litres/Total RTK | -0.011 | -3.2% | -0.0514 | -13.0% | -1.73% |
| Emission rates | |||||
| CO2e grams/RPK | -2.7 | -2.6% | -14.1 | -12.3% | -1.63% |
| CO2e grams/Total RTK | -29.2 | -3.2% | -132.6 | -13.0% | -1.73% |
The figures presented in Tables 1, 2 and 3 allow for the following summary of trends:
- In 2016, reported RPK rose by 10.4 percent. Between 2008 and 2016, RPK grew by 54.5 percent.
- While changes in NACC and ATAC carrier reporting make it difficult to compare reported trends in cargo, the figures suggest there was an increase in total RTK of 11.1 percent from 2015 to 2016, and an increase of 55.8 percent between 2008 and 2016.
- A total of 7.56 billion litres of fuel was used in 2016, 7.6 percent greater than in 2015.
- While fuel efficiency improved, GHG emissions from 2015 to 2016 also increased by 7.6 percent, to 19.51 Mt of CO2e due to increased traffic.
- GHG emissions per RTK improved by the same proportions as the fuel consumption rates (in litres per RTK) in 2016 compared to 2015 and 2008 (3.2 percent and 13.0 percent, respectively).
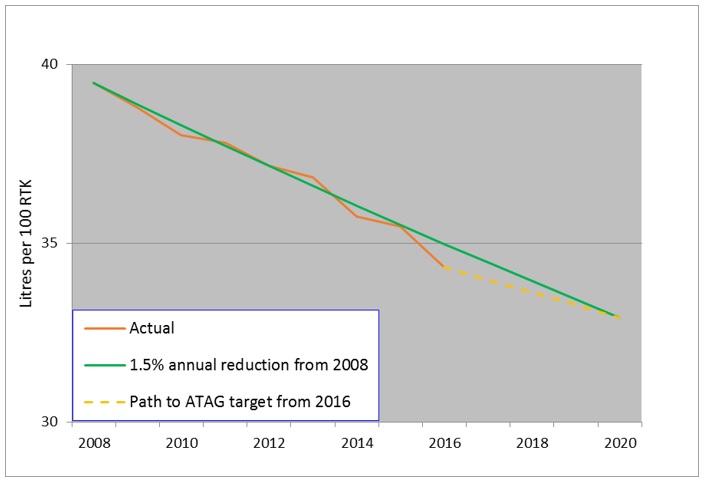
Figure 2 plots the target trajectory from 2008 to 2020 of reductions of 1.5 percent annual average improvement in fuel efficiency and the progress made between 2008 and 2016. It adds an indicative trajectory that would be required to meet the 2020 ATAG target, given the actual 2016 results. Canadian carriers expect to achieve greater emissions reduction as they take delivery of new, more efficient aircraft closer to 2020.
Figure 2: Progress towards ATAG target, 2008–2020
Figure 2: Progress towards ATAG target, 2008–2020 - Text version
| Year | 2005 | 2006 | 2007 | 2008 | 2009 | 2010 | 2011 | 2012 | 2013 | 2014 | 2015 | 2016 | 2017 | 2018 | 2019 | 2020 |
|---|---|---|---|---|---|---|---|---|---|---|---|---|---|---|---|---|
| Actual | 0.404297 | 0.404306 | 0.389492 | 0.394686 | 0.387908 | 0.380207 | 0.377957 | 0.37164 | 0.368308 | 0.357398 | 0.354645 | 0.343319 | 0 | 0 | 0 | 0 |
| 1.5% annual reduction from 2008 | 0 | 0 | 0 | 0.394686 | 0.388765 | 0.382934 | 0.37719 | 0.371532 | 0.365959 | 0.36047 | 0.355063 | 0.349737 | 0.344491 | 0.339323 | 0.334233 | 0.32922 |
| Path to ATAG target from 2016 | 0 | 0 | 0 | 0 | 0 | 0 | 0 | 0 | 0 | 0 | 0 | 0.343319 | 0.339739 | 0.336196 | 0.332689 | 0.32922 |
Remote cabin temperature monitoring
In winter 2016, a study was conducted to assess the effectiveness and viability of utilizing remote cabin temperature monitors to mitigate aircraft freezing. Current mitigating methods include physical checks by ground crews and, in some cases, running the auxiliary power unit (APU) over night to heat the plane (which burns fuel and emits greenhouse gases). By placing a temperature sensing device in the cabin of aircraft parked overnight on gates or stand positions at Toronto Pearson International Airport, ground crews remotely monitored cabin temperatures via an online interface.
The testing period proved to be successful. Over the course of the study, not one incident of aircraft freezing took place. In fact, other incidents of malfunctioning heating equipment were identified in addition to better visibility on aircraft cooling rates which will allow for future optimization.
A summer trial is scheduled for 2017 to manage aircraft overheating and additional test will continue through the winter months. Should the trials continue to prove successful, the long-term goal will be to deploy remote cabin temperature monitoring fleet-wide to manage APU and ground equipment usage for heating and cooling aircraft while parked on or off gate - resulting in greater fuel efficiency and a reduction of greenhouse gas emissions.
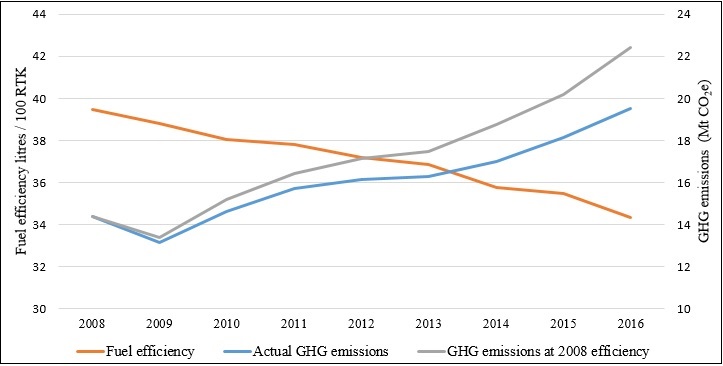
Figure 3 provides an illustration of the importance of fuel consumption improvements to reducing GHG emissions. Between 2008 and 2016, if fuel consumption had remained at 2008 levels of 39.47 litres of fuel per 100 RTK, total GHG emissions in 2016 would have reached 22.42 Mt at the 2008 rate, whereas actual 2016 emissions were 13.0 percent lower, at 19.51 Mt.
Figure 3: Impact of fuel efficiency improvements on GHG emissions since 2008
Figure 3: Impact of fuel efficiency improvements on GHG emissions since 2008 - Text version
| 2008 | 2009 | 2010 | 2011 | 2012 | 2013 | 2014 | 2015 | 2016 | |
|---|---|---|---|---|---|---|---|---|---|
| Actual GHG | 14.3956 | 13.1638 | 14.61097 | 15.72106 | 16.15264 | 16.30302 | 16.98702 | 18.13225 | 19.506 |
| Fuel Efficiency | 39.46856 | 38.79085 | 38.02068 | 37.79575 | 37.16401 | 36.83084 | 35.73982 | 35.46452 | 34.33193 |
| GHG Emissions at 2008 efficiency | 14.3956 | 13.39378 | 15.16738 | 16.41686 | 17.15426 | 17.4706 | 18.75928 | 20.17943 | 22.42442 |
Measuring progress towards Canada’s 2 percent aspirational goal
Table 4 provides the combined ATAC and NACC results for measuring progress towards the Action Plan’s aspirational goal of annual fuel efficiency improvement between 2005 and 2016.
| Change 2005-2016 | |||
|---|---|---|---|
| Absolute | Proportional | Annual Rate | |
| Fuel use (million litres) | 2,667 | 54.6% | 4.0% |
| GHG emissions (megatonnes of CO2e) | 6.89 | 54.6% | 4.0% |
| Traffic (billions) | |||
| Revenue passenger-kilometres (RPK) | 88.8 | 84.4% | 5.7% |
| Passenger revenue-tonne-kilometres (pass. RTK) | 8.9 | 84.4% | 5.7% |
| Cargo revenue-tonne-kilometres (cargo RTK) | 1.0 | 66.4% | 4.7% |
| Total revenue-tonne-kilometres (RTK) | 9.9 | 82.0% | 5.6% |
| Fuel consumption ratesFootnote * | |||
| Litres/RPK | -0.008 | -16.2% | -1.59% |
| Litres/Total RTK | -0.061 | -15.1% | -1.48% |
| Emission rates | |||
| CO2e grams/RPK | -19.4 | -16.2% | -1.59% |
| CO2e grams/Total RTK | -157.4 | -15.1% | -1.48% |
The figures presented in Table 4 allow for the following summary of trends between 2005 and 2016:
- Fuel consumption and GHG emissions rose by 54.6 percent, an average of 4.0 percent per year
- RPK grew by 84.4 percent
- Total reported RTK increased by 82.0 percent
- The cumulative improvement in fuel efficiency (litres/RTK) was 15.1 percent, or an annual average of 1.48 percent
Figure 4 shows the goal trajectory of the 2 percent aspirational goal and the fuel efficiency improvements made between 2005 and 2016. It also shows an indicative trajectory that would be required to meet the 2020 aspirational goal, given the actual 2016 results.
Figure 4: Aspirational goal trajectory, 2005-2020
Figure 4: Aspirational goal trajectory, 2005-2020 - Text version
| Year | 2005 | 2006 | 2007 | 2008 | 2009 | 2010 | 2011 | 2012 | 2013 | 2014 | 2015 | 2016 | 2017 | 2018 | 2019 | 2020 |
|---|---|---|---|---|---|---|---|---|---|---|---|---|---|---|---|---|
| Actual | 0.404297 | 0.404306 | 0.389492 | 0.394686 | 0.387908 | 0.380207 | 0.377957 | 0.37164 | 0.368308 | 0.357398 | 0.354645 | 0.343319 | 0 | 0 | 0 | 0 |
| 2% annual reduction from 2005 | 0.404297 | 0.396211 | 0.388286 | 0.380521 | 0.37291 | 0.365452 | 0.358143 | 0.35098 | 0.343961 | 0.337081 | 0.33034 | 0.323733 | 0.317258 | 0.310913 | 0.304695 | 0.298601 |
| Path to Action Plan target from 2016 | 0 | 0 | 0 | 0 | 0 | 0 | 0 | 0 | 0 | 0 | 0 | 0.343319 | 0.331548 | 0.32018 | 0.309202 | 0.298601 |
Reporting on section 5.0 measures
Section 5.0 of Canada’s Action Plan to Reduce Greenhouse Gas Emissions from Aviation identifies measures that represent the greatest opportunities to reduce GHG emissions and help improve fuel efficiency. The following table summarizes the results achieved and the status of each measure.
| Measure | Results | Status |
|---|---|---|
| 5.1 Fleet renewals and upgrades | ||
|
Canadian air carriers expect to achieve annual fuel efficiency improvements on domestic and international flights to 2020 through further fleet changes. |
During 2016, NACC member airlines made the following changes to their aircraft fleets:
ATAC all-passenger air carriers continued to add highly efficient aircraft such as Boeing 737-800, Boeing 738-8 MAX and Bombardier Q400/ATR 42-500 and 700 aircraft to their fleets while replacing older less efficient fleet types such as Boeing 737-200 and Hawker Siddeley 748. Operators of Boeing 737-200 aircraft have replaced almost all of these classic versions with Boeing 737-300/400/500 series aircraft with their more efficient CFM56 engines. The remaining Boeing 737-200 aircraft are currently being retained as they are combi freighter/passenger aircraft equipped for operation on gravel runways and there is no direct replacement type of aircraft available. ATAC all-cargo air carriers continued their transformation, at a more advanced pace, to much more efficient cargo operations as they upgrade from narrow body Boeing 727 to larger, more fuel-efficient aircraft with high bypass ratio engines such as Boeing 757, Boeing 767 and DC-10-30 aircraft. |
In progress |
|
Business aviation operators will be encouraged to take advantage of opportunities to reduce emissions through fleet renewal. |
The Canadian Business Aviation Association (CBAA) continued to build on its GHG reduction outreach efforts through its online forum and other member fora. The online forum increases awareness and provides a space for feedback on activities of interest to Canadian business aviation operators, including Canada’s Action Plan. The CBAA will continue to encourage its members to take advantage of opportunities to reduce GHG emissions through fleet renewal. |
In progress |
| 5.2 More efficient air operations | ||
|
Canadian air carriers expect to achieve average annual fuel efficiency improvements for domestic and international flights to 2020 through improved operations. |
All ATAC and NACC carrier members continued to re-emphasize the use of fuel saving operating procedures. Carriers continue to look for additional opportunities to reduce fuel burn. Four of the five Boeing 767-300 introduced into service by Rouge during 2016 were retrofitted with blended winglets which will provide significant fuel savings. |
In progress |
|
Business aviation operators will be encouraged to adopt operational improvement to reduce emissions. |
The CBAA continued to encourage its members to take advantage of opportunities to reduce GHG emissions through operational improvements. The CBAA Forum will continue to give these issues greater visibility to operators. |
In progress |
|
Canadian operators will continue to take advantage of the opportunities identified in ICAO guidance on minimizing fuel use and reducing emissions. |
The input for the updated manual was built upon NACC and ATAC carriers’ policies and procedures. NACC, ATAC and CBAA promoted the ICAO manual to its members when it came online in 2014. |
In progress |
| 5.3 Improved capabilities in air traffic management | ||
|
NAV CANADA, in partnership with Transport Canada, Canadian air carriers, global Air Navigation Service Providers (ANSPs) and other industry participants remains committed to taking advantage of opportunities to improve air traffic management (ATM) through further implementation of Performance Based Navigation (PBN), such as RNP AR and RNAV, new ATM technologies and procedures, as well as surveillance technologies, such as ADS-B and multilateration. More specifically NAV CANADA will: |
The Canadian Performance-based Aviation Action Team (CPAAT) is leading the implementation of Canada’s PBN Implementation Plan and will provide opportunities for ongoing consultation and involvement throughout implementation. |
In progress |
|
Public RNP-AR approaches allow aircraft to land using satellite-based navigation (i.e. with on-board equipment) in place of ground-based navigation systems, the benefits of which include reduced flying time and GHG emissions. In 2016, NAV CANADA implemented and published new RNP AR approaches at Kelowna, Calgary International, Ottawa International and Halifax International airports. Also, RNP AR project work was initiated at Edmonton, St. John’s and Winnipeg International Airports for planned publication in 2017. Programs for gathering RNP AR usage metrics will allow for specific reportable GHG savings going forward. In conjunction with implementing RNP AR approaches, NAV CANADA conducted reviews of the airspace surrounding Edmonton, St. John’s and Winnipeg airports, focusing on standard departure and arrival procedures. Improvements and efficiencies that benefitted NAV CANADA and customers were identified, and were implemented concurrently with the publication of RNP AR projects. Transport Canada, NAV CANADA and other key stakeholders (including customers, airport authorities, noise consultation, procedure design and operational Air Traffic Control) continue to work through a collaborative process to make the necessary regulatory and procedural changes to take even greater advantage of these approaches. The work underway includes new approvals and separation standards, which are required to allow the use of these types of procedures in a close parallel runway environment, such as at Vancouver International. |
In progress |
|
Reduced Lateral Separation (RLat) trials were introduced in the North Atlantic Region through 2016. RLat enables more aircraft to safely benefit from the most efficient flight paths available. RNP 4 is one of the underlying requirements for participation in the RLat trial. |
In progress |
|
NAV CANADA’s CIFER reports are available on the NAV CANADA website. |
In progress |
|
In addition, Transport Canada will continue to issue or update advisory circulars to provide guidance or approve new procedures or specifications, such as those related to RNP and ADS-B. |
In 2016, Transport Canada published an advisory circular (AC 700-038) to inform the aviation industry that air operators and private operators may now obtain a Canadian Special Authorization for Required Navigation Performance 2 (RNP 2) - Continental. This Special Authorization will enable Canadian air operators or private operators to operate within airspace designated as RNP 2 (Continental). It will also form the basis upon which a foreign National Aviation Authority (NAA) may authorize, within their jurisdiction, a Canadian air operator or private operator to operate in RNP 2 airspace. Transport Canada is working to amend the Foreign Air Operator Certification to allow foreign operators to gain approvals for RNP AR. This would enable an increase in the number of aircraft eligible to perform RNP AR runway approaches. Transport Canada’s PBN State Plan outlines the actions that will be undertaken to develop and implement policy to ensure smooth transition to ADS-B and monitor future changes in the technology in Canada. While ADS-B is not being mandated in the near term, consideration could be given to airspace or route mandates for a geographic area or operational time period should equipage rates be insufficient to enable full system surveillance benefits. Transport Canada and NAV CANADA recognize that air carriers would like to take advantage of new ATM procedures as early as possible and are working together to expedite this process, while also maintaining the highest standard for safety. |
In progress |
Reporting on section 6.0 measures
Section 6.0 of Canada’s Action Plan to Reduce Greenhouse Gas Emissions from Aviation identifies other measures essential to supporting the aspirational goal. The following table summarizes the results achieved and the status of each measure.
| Measure | Results | Status |
|---|---|---|
| 6.1 Aviation environmental research and development | ||
|
The Government of Canada and the Canadian aviation industry will continue to support research and development initiatives to minimize or reduce aviation environmental impacts. Research will continue through a number of key organizations and programs, including:
Research findings and key indicators such as technology readiness levels will be shared with interested parties. |
||
|
Green Aviation Research and Development Network (GARDN) |
Established in 2009 and renewed in 2014, GARDN has supported 37 projects (18 completed and 19 in progress) representing over $70 M of Canadian aviation environmental research (jointly funded by the Federal Government and participating aerospace companies - at minimum of 50 percent). These projects embrace three research thrusts, CLEAN, QUIET and a SUSTAINABLE air transportation system. Over half of the aforementioned projects deal specifically with emissions reductions. Five projects focus on bio-derived jet fuel applications for Canada, two under GARDN I and three under GARDN II (refer to Measure 6.2 for more detail). |
In progress |
|
FAA Aviation Sustainability Centre (ASCENT) |
ASCENT, also known as the Center of Excellence for Alternative Jet Fuels and Environment, works to create science-based solutions to the aviation industry’s biggest challenges. In 2016, Transport Canada continued to sponsor ASCENT and maintain an active role on the Advisory Board reviewing research projects and progress, with particular focus on the following:
|
In progress |
|
National Research Council of Canada (NRC) |
With financial support from the Government of Canada’s Clean Transportation Initiatives, the NRC has:
The NRC, with financial support from the Department of National Defence, is also conducting research under the ASCENT National Jet Fuel Combustion Program (NJFCP). The prime goal of NJFCP is to accelerate the approval of new alternative jet fuels. |
In progress |
|
US Transportation Research Board’s Airport Cooperative Research Program (ACRP) |
Transport Canada and the Canadian Airports Council (CAC) continue to support and participate in ACRP and to share relevant information with Canadian airports. |
In progress |
| 6.2 Alternative fuels | ||
|
The Government of Canada and the Canadian aviation industry will continue to work collaboratively to advance efforts related to alternative aviation fuel production and use in Canada and will take advantage of opportunities to collaborate with key trading partners. |
The Green Aviation Research and Development Network (GARDN) has funded five projects on bio-derived jet fuel applications for Canada, two under GARDN I and three under GARDN II (described below):
Transport Canada maintains a dialogue with the US FAA to exchange information on biofuels development. |
In progress |
|
The Government of Canada and the Canadian aviation industry will continue to support research, development and demonstration of alternative fuels for aviation through initiatives such as the ICAO Committee on Aviation and Environmental Protection (CAEP) Alternative Fuels Task Force, Sustainable Development Technology Canada (SDTC), BioFuelNet, and ASCENT. |
In 2015, Canada’s BioFuelNet initiated work under a new Aviation Task Force (ATF) within the network. Transport Canada and members of the Canadian aviation industry continue to participate in the Task Force. The ATF provides information on the latest developments of Canadian biojet activities for all stakeholders and identifies the main barriers to the commercial development of bio-derived jet fuel in Canada. Since 2010, SDTC has provided over $12 million to two ongoing alternative aviation fuel projects that are in the demonstration phase:
In 2016, there were no new alternative jet fuel projects funded under the SDTC. In 2016, Transport Canada actively supported:
Transport Canada also established an ad-hoc aviation biofuels group to both share information on biojet development and discuss government-wide views on issues of common interest. |
In progress |
| 6.3 Airport ground operations and infrastructure use | ||
|
The Canadian aviation industry will collaborate to reduce emissions at the gate and on the ground from taxi operations, auxiliary power units and ground support equipment. |
In 2016, the Airport Ground Operations Subgroup continued to share information on current emission reduction initiatives and maintained a list of potential projects the group could undertake over the coming years. A number of emission reduction initiatives are advancing at Canadian airports. Examples include:
Multilateration systems make it possible to see all airport ground movement. Initially adopted for safety reasons, these systems can promote efficiencies and reduce emissions. Such systems were introduced in Montreal in 2012, in Toronto in 2013, Calgary in 2014, and will be operational in Vancouver in 2019. The ability to monitor taxi times helps manage and reduce aircraft operating times and emissions. A cost-sharing agreement between NAV CANADA and the Toronto Airport uses a program called EXCDS to produce taxi times. Toronto, Montreal and Calgary Airports have the capability to use EXCDS to develop average baselines for taxi times. The Greater Toronto Airports Authority Air Traffic Management Working Group has extended the Airline/NAV CANADA working partnership to aircraft movements from gate-to-gate. This has improved performance and reduced emissions by balancing and improving runway use, and arrival and departure flows (holding and taxi times). In 2016, the Visual Departure Separation, which allows for the reduction of the minimum separation standard of 3 miles, was implemented. Results have shown an estimated benefit of one additional flight per hour, when utilized in the north-south operation. |
In progress |
|
Partners will work together to improve the quantification of GHG emissions associated with ground operations. |
Two studies were completed in 2016:
|
In progress |
|
Canadian airports will refine and improve emissions inventories and will explore further opportunities for emissions reduction strategies. |
In 2016, there were seven Canadian airports participating in the Airport Carbon Accreditation (ACA) program under Airports Council International (ACI). Within this program, there are four levels of certification:
As of 2016, Canadian airports have achieved the following levels of certification:
Participation in the ACA program is voluntary and is a step that a subset of Canadian airports have chosen to take to demonstrate their commitment to reducing emissions. However, it should be noted that a number of airports who are not participating in this program have also made strong commitments to reducing emissions through their environment programs. |
In progress |
| 6.4 Regulatory measures | ||
|
Transport Canada will continue to participate at CAEP on the finalization of the new CO2 emissions standard for airplanes. |
The new international CO2 standard certification requirement and regulatory level were endorsed by the ICAO CAEP in early 2016, with strong leadership from Canada. The CO2 standard is on track to be adopted at ICAO Council in 2017, after consultation with ICAO Member States. |
In progress |
|
Transport Canada will continue to help develop a new nvPM standard for aircraft engines, through CAEP, with Phase I completed in 2016, and Phase II targeted for 2019. |
Canada continues to make significant contributions in the development of the new nvPM international standard. Phase I, the new international mass standard, was completed on schedule in February 2016, and will be adopted by ICAO in early 2017. The new international mass and number standard (Phase II) has a tight schedule, but is still scheduled for completion by 2019. |
In progress |
|
Once completed and adopted by ICAO, Transport Canada will adopt both standards domestically under the Aeronautics Act. |
Initial work on the drafting process began in 2016. |
In progress |
| 6.5 International coordination | ||
|
Transport Canada will continue to actively participate, through ICAO, on the development and implementation of global approaches and standards to address climate change, including system efficiencies and market-based measures, and the development of alternative fuels for aviation. Transport Canada will continue to engage the Canadian aviation industry as part of the international dialogue. |
Canada supports CAEP’s working groups and task forces with technical experts and provides significant leadership in a number of key areas. Canada played an active role in the negotiation of the framework for the global market-based measure to address GHG emissions from international civil aviation that was agreed at the 39th ICAO assembly in 2016. Called the Carbon Offsetting and Reduction Scheme for International Aviation (CORSIA), baseline reporting is set to begin in January 2019. Canada continues to actively participate in CAEP to finalize details of the new CO2 standard for aeroplanes and to develop the nvPM mass and number standard for aircraft engines, as well as the technical requirements for CORSIA. Canada is also a member of the Advisory Group to Council on CORSIA that will provide guidance during the development of the scheme. Canada resumed its leadership role of ICAO Working Group 2 which deals with airports and operations. Several of the work items of this group deal with minimizing emissions that affect the global climate and local air quality. |
In progress |
|
NAV CANADA will continue to support the air navigation interests of Canadian aviation stakeholders internationally through representation in ICAO groups and panels. |
Transport Canada and NAV CANADA are supporting efforts under ICAO’s Global Air Navigation Plan and Aviation System Block Upgrades (ASBU), as well as NAV CANADA’s PBN Operations Plan, through planned upgrades through to 2017 on:
These upgrades maximize the benefits for operators of aircraft that are best equipped to take advantage of the PBN procedures, while recognizing the needs for airspace access to operators not eligible for these procedures. |
In progress |
|
As a member of the International Coordinating Council of Aerospace Industries Associations (ICCAIA), the Aerospace Industries Association of Canada (AIAC) will continue to lead Canadian aerospace manufacturers in working with international partners to develop and produce aircraft and engines that meet or exceed ICAO requirements for fuel efficiency and emissions. |
AIAC member companies continue to provide subject matter experts to advise CAEP; and AIAC provides the link to the international community through its membership in ICCAIA. The President and CEO of AIAC also plays a key leadership role by chairing and facilitating the work of GARDN. |
In progress |
Conclusions
Summary of results
Aviation activity and associated fuel use data for 2016 provided by members of ATAC and NACC, demonstrate continued progress towards the Action Plan’s fuel efficiency target and aspirational goal.
Since 2010, the demand for aviation services has continued to grow. Combined revenue passenger and cargo operations increased by 11.1 percent in 2016, compared with 2015. Canadian air carriers used 7.56 billion litres of fuel, a 7.6 percent increase compared with 2015. Consequently, total GHG emissions also increased by 7.6 percent to 19.51 Mt in 2016.
In 2016, the overall rate of fuel consumption (i.e., litres per RTK) declined by 3.2 percent, compared with 2015. The combined domestic and international fuel consumption rate reported for 2016 was 34.33 litres per 100 RTK (combining both passenger and cargo traffic). This translates to an annual average fuel efficiency improvement of 1.73 percent per year between 2008 and 2016, and a cumulative improvement of 13.0 percent.
2017 look ahead
Important milestones have already been advanced in 2017. These milestones will be addressed in more detail in the 2017 Annual Report, which is scheduled to be released by December 31, 2018. The 2017 Annual Report will include information about:
- The installation of 6 more pre-conditioned air units at Vancouver International Airport, resulting in 84 percent of bridged gates having pre-conditioned air by the end of 2017. In addition, by the end of 2017, 36 charging stations will be available for ground handlers to charge their GSE. The first electric COBUS sold in North America will be used to support remote gate stand operations. YVR will also be filleting a runway exit taxiway to support the largest wide-body aircraft currently serving the airport and thereby reducing current ground taxi time and as a result reducing GHG emissions.
- Halifax Stanfield International Airport achieving Level I certification through the ACA program.
- Updates on NACC carrier fleet renewal plans, including, for example:
- WestJet’s purchase agreement with the Boeing Company for up to 20 Boeing 787-9 Dreamliner aircraft. This agreement includes commitments for 10 Boeing 787-9 aircraft to be delivered between 2019 and 2021, with options for an additional 10 aircraft to be delivered between 2020 and 2024. The airline also announced it has selected General Electric's GEnx-1B engine for the 787.
- Air Canada and WestJet will also take delivery of new Boeing 737 Max-8 aircraft.
- Jazz Aviation will add five Bombardier CRJ900 regional jets and five Bombardier Q400 NextGen aircraft in 2017.
- Updates on ATAC carrier fleet renewal plans, including, for example:
- Air North will replace most of its Boeing 737-200 and Hawker Siddeley 748 aircraft with Boeing 737-500, Boeing 737-400 and ATR 42 aircraft.
- Canadian North will replace most of its Boeing 737-200 aircraft with Boeing 737-300 and Boeing 737-300 Combi aircraft.
- First Air will replace Boeing 737-200 and Hawker Siddeley 748 aircraft with Boeing 737-400 all-passenger and combi aircraft plus ATR 42-300 combi and ATR 42-500 all-passenger aircraft.
- Porter Airlines will purchase three new Bombardier Q400 bringing their total of Q400 operated to 29.
- Sunwing will continue to add to its fleet of Boeing 737-800 NG aircraft and has placed orders for Boeing 737-8 MAX aircraft with deliveries starting in 2018.
- Updates on the NAV CANADA RNP AR projects planned for publication in 2017 as well as on planned RNP AR project work to be commenced in 2017 at Regina, Brandon, Saskatoon and Quebec City airports.
Appendix A: Glossary of key terms and acronyms
Key aviation activity measurements:
Revenue passenger-kilometres (RPK): is a measure of traffic showing revenue-paying passengers carried, multiplied by distance flown.
Passenger revenue tonne-kilometres (passenger RTK): is the total tonnes of revenue-paying passengers carried, estimated by converting RPK into weight using the industry’s convention of 100 kg (220 lbs) per passenger, multiplied by distance flown.
Cargo revenue tonne-kilometres (cargo RTK): is the total tonnes of revenue-generating cargo (freight and mail) multiplied by distance flown (reflects actual cargo carried).
Total revenue tonne-kilometres (Total RTK): is the total tonnes of passengers, freight, and mail carried (revenue load) multiplied by distance flown.
Acronyms:
ACI: Airports Council International
ACRP: Airport Cooperative Research Program
ADS-B: Automatic Dependent Surveillance-Broadcast
AIAC: Aerospace Industries Association of Canada
ANSP: Air Navigation Service Providers
APU: Auxiliary Power Unit
ASCENT: Aviation Sustainability Center
ATAC: Air Transport Association of Canada
ATAG: Air Transport Action Group
ATM: Air Traffic Management
CAC: Canadian Airports Council
CAEP: Committee on Aviation and Environmental Protection
CBAA: Canadian Business Aviation Association
CO2: Carbon Dioxide
CO2e: Carbon Dioxide Equivalent
FAA: Federal Aviation Administration
GARDN: Green Aviation Research and Development Network
GSE: Ground Support Equipment
ICAO: International Civil Aviation Organization
ICCAIA: International Coordinating Council of Aerospace Industries Associations
Mt: Megatonnes
NACC: National Airlines Council of Canada
NRC: National Research Council
nvPM: Non-volatile Particulate Matter
PAFI: Piston Aviation Fuel Initiative
PBN: Performance-based Navigation
RNAV: Area Navigation
RNP: Required Navigation Performance
RNP AR: RNP Authorization Required
RPM: Revenue Passenger-Miles
RPK: Revenue Passenger-Kilometres
RTM: Revenue Ton-Miles
RTK: Revenue Tonne-Kilometres
SDTC: Sustainable Development Technology Canada
Appendix B: Calculations and caveats
The following factors and formulas were applied in preparation of the aggregated report from ATAC and NACC. Note that industry statistics are still maintained in imperial units, including miles and tons, which are converted to International System (SI) units (kilometres and tonnes) for the present report. The emissions factors for all calendar years are the latest factors from ECCC’s National Inventory Report 1990-2015.
Aviation jet fuel emission factors:
2560 grams CO2 per litre
2582 grams CO2e per litre
Conversion miles to kilometres:
1 m = 1.609344 km
Conversion tons to tonnes:
1 ton = 0.907185 tonnes
Formula used to calculate annual fuel efficiency:
Compound Annual Growth Rate (CAGR) = (ending value/beginning value) (1/# of years)-1
The fuel efficiency goals are expressed as cumulative annual reductions; therefore, the actual trends are calculated consistently as compound average annual growth rates.
Formulae for CO2-equivalents:
CO2e (grams)/RPK = (Fuel Used x 2582) / (RPM x 1.609344)
CO2e (grams)/Cargo RTK = (Fuel Used x 2582) / (Cargo RTM x 1.609344 x 0.907185)
CO2e (grams)/Total RTK = (Fuel Used x 2582) / {(RPM x 1.609344 x 0.907185) + (Cargo RTM x 1.609344 x 0.907185)}
Reports by ATAC and NACC members have been revised from time to time, notably of activity statistics. The consolidated statistics presented in this report include all the latest figures reported by ATAC and NACC carriers, including all such revisions. It should be noted that the statistics are not entirely comparable between years.
The reported annual emission statistics do not account for 100 percent of Canadian aviation operations, and therefore will not be directly comparable to ECCC’s annual National Greenhouse Gas Emissions Inventory. Canada’s Action Plan to Reduce Greenhouse Gas Emissions from Aviation, and therefore this report, did not cover private aviation, military and other government operations, or foreign carriers’ operations in Canada.
There has been some variability in reporting from year to year, particularly from including more carriers. Coverage in 2016 was similar to that of 2015. Adding carriers does not substantially affect the industry-wide ratios and longer-term trends computed for fuel use and emissions per unit of traffic.
Appendix C: List of signatories and air operator member companies reporting
Members of the Working Group on Aviation Emissions, which developed the Action Plan, include:
- Aerospace Industries Association of Canada
- Air Transport Association of Canada
- Canadian Airports Council
- Canadian Business Aviation Association
- National Airlines Council of Canada
- NAV CANADA website
- Transport Canada
All four members of NACC contributed 2016 data for this annual report (Sky Service reporting was included as part of NACC’s submission).
- Air Canada and Rouge
- Air Transat
- Jazz Aviation LP
- WestJet and Encore
The ATAC member carriers who contributed 2016 data for this annual report were:
- Air Georgian
- Air North
- Bearskin
- Canadian North
- Cargojet
- EVAS Air
- First Air
- Flair
- Harbour Air
- KF Aerospace
- Morningstar
- Nolinor
- North Cariboo Air
- Porter Airlines
- Sunwing
- Transwest
Appendix D: Additional figures illustrating key trends
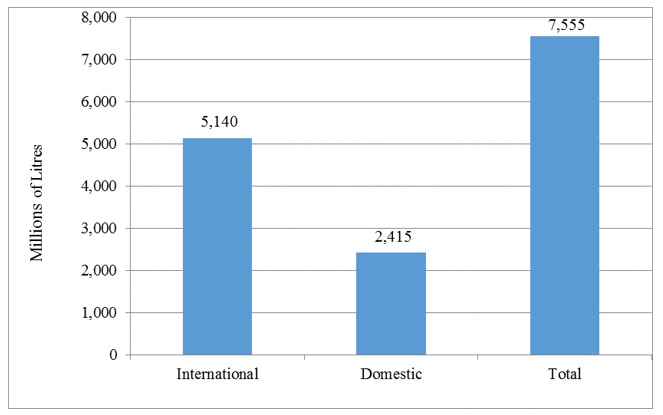
Figure 5: Fuel use — international and domestic, 2016
Figure 5: Fuel use — international and domestic, 2016 - Text version
| International | Domestic | Total | |
|---|---|---|---|
| Fuel use (million litres) | 5,140 | 2,415 | 7,555 |
Figure 6: Fuel use, 2005-2016
Figure 6: Fuel use, 2005-2016 - Text version
| 2005 | 2006 | 2007 | 2008 | 2009 | 2010 | 2011 | 2012 | 2013 | 2014 | 2015 | 2016 | |
|---|---|---|---|---|---|---|---|---|---|---|---|---|
| Fuel use (million litres) | 4,887 | 5,186 | 5,543 | 5,575 | 5,098 | 5,659 | 6,089 | 6,256 | 6,314 | 6,579 | 7,023 | 7,555 |
Figure 7: Revenue passenger kilometres, 2005-2016
Figure 7: Revenue passenger kilometres, 2005-2016 - Text version
| 2005 | 2006 | 2007 | 2008 | 2009 | 2010 | 2011 | 2012 | 2013 | 2014 | 2015 | 2016 | |
|---|---|---|---|---|---|---|---|---|---|---|---|---|
| Revenue passenger-kilometres (RPK) | 105.22 | 112.98 | 124.15 | 125.55 | 117.62 | 128.77 | 141.27 | 148.74 | 150.92 | 161.62 | 175.66 | 193.98 |
Figure 8: Cargo revenue tonne-kilometres, 2005-2016
Figure 8: Cargo revenue tonne-kilometres, 2005-2016 - Text version
| 2005 | 2006 | 2007 | 2008 | 2009 | 2010 | 2011 | 2012 | 2013 | 2014 | 2015 | 2016 | |
|---|---|---|---|---|---|---|---|---|---|---|---|---|
| Cargo revenue-tonne-kilometres (cargo RTK) | 1.57 | 1.53 | 1.82 | 1.57 | 1.38 | 2.01 | 1.98 | 1.96 | 2.05 | 2.25 | 2.24 | 2.61 |
Figure 9: Total passenger and cargo tonne-kilometres, 2005-2016
Figure 9: Total passenger and cargo tonne-kilometres, 2005-2016 - Text version
| 2005 | 2006 | 2007 | 2008 | 2009 | 2010 | 2011 | 2012 | 2013 | 2014 | 2015 | 2016 | |
|---|---|---|---|---|---|---|---|---|---|---|---|---|
| Total revenue-tonne-kilometres (RTK) | 12.09 | 12.83 | 14.23 | 14.13 | 13.14 | 14.88 | 16.11 | 16.83 | 17.14 | 18.41 | 19.80 | 22.00 |
Figure 10: Total passenger and cargo tonne-kilometres — international and domestic, 2016
Figure 10: Total passenger and cargo tonne-kilometres — international and domestic, 2016 - Text version
| International | Domestic | Total | |
|---|---|---|---|
| Total revenue-tonne-kilometres (RTK) | 16.05 | 5.95 | 22.00 |
Figure 11: Fuel consumption rate — passengers, 2005-2016
Figure 11: Fuel consumption rate — passengers, 2005-2016 - Text version
| 2005 | 2006 | 2007 | 2008 | 2009 | 2010 | 2011 | 2012 | 2013 | 2014 | 2015 | 2016 | |
|---|---|---|---|---|---|---|---|---|---|---|---|---|
| Litres/RPK | 0.046449 | 0.045901 | 0.044647 | 0.044408 | 0.043347 | 0.043945 | 0.0431 | 0.042058 | 0.041838 | 0.040707 | 0.039977 | 0.038944 |
Figure 12: Fuel consumption rate — combined passengers and cargo, 2005-2016
Figure 12: Fuel consumption rate — combined passengers and cargo, 2005-2016 - Text version
| 2005 | 2006 | 2007 | 2008 | 2009 | 2010 | 2011 | 2012 | 2013 | 2014 | 2015 | 2016 | |
|---|---|---|---|---|---|---|---|---|---|---|---|---|
| Litres/Total RTK | 0.404297 | 0.404306 | 0.389492 | 0.394686 | 0.387908 | 0.380207 | 0.377957 | 0.37164 | 0.368308 | 0.357398 | 0.354645 | 0.343319 |
Figure 13: GHG emissions — international and domestic, 2016
Figure 13: GHG emissions — international and domestic, 2016 - Text version
| International | Domestic | Total | |
|---|---|---|---|
| Greenhouse gas emissions (millions of tonnes of CO2-equivalent) | 13.27 | 6.24 | 19.51 |
Figure 14: GHG emission rates — international and domestic, 2016
Figure 14: GHG emission rates — international and domestic, 2016 - Text version
| International | Domestic | Total | |
|---|---|---|---|
| CO2e grams/Total RTK | 827 | 1,047 | 886 |
Figure 15: GHG emission rate — passengers, 2005-2016
Figure 15: GHG emission rate — passengers, 2005-2016 - Text version
| 2005 | 2006 | 2007 | 2008 | 2009 | 2010 | 2011 | 2012 | 2013 | 2014 | 2015 | 2016 | |
|---|---|---|---|---|---|---|---|---|---|---|---|---|
| CO2e grams/RPK | 119.93 | 118.52 | 115.28 | 114.66 | 111.92 | 113.47 | 111.28 | 108.59 | 108.03 | 105.11 | 103.22 | 100.55 |
Figure 16: GHG emission rate — combined passenger and cargo, 2005-2016
Figure 16: GHG emission rate — combined passenger and cargo, 2005-2016 - Text version
| 2005 | 2006 | 2007 | 2008 | 2009 | 2010 | 2011 | 2012 | 2013 | 2014 | 2015 | 2016 | |
|---|---|---|---|---|---|---|---|---|---|---|---|---|
| CO2e grams/Total RTK | 1,044 | 1,044 | 1,006 | 1,019 | 1,002 | 982 | 976 | 960 | 951 | 923 | 916 | 886 |
