Evaluation report outlining results of the Review of Rail Safety Oversight Activities at Transport Canada.
On this page
- Executive summary
- Introduction
- Findings and observations
- Conclusions and recommendations
- Appendix A: methods and limitations
- Appendix B: Supporting tables for statistical analyses
- Appendix C: Management response and action plan
List of figures
- Figure 1. Simplified Rail Safety logic model, for evaluation purposes
- Figure 2. Defect rates by functional group from 2015-2016 to 2021-2022, where defect rate is number of inspections with one or more defect divided by the total number of inspections
- Figure 3. Defect rates by functional group from 2015-2016 to 2021-2022, where defect rate is an equal weighted average of defects divided by total number of inspections
- Figure 4. Number of critical rule defects per inspection from 2016 to 2021
- Figure 5. Number of critical rule defects per track mile inspected from 2016 to 2021
- Figure 6. Average relative risk score per inspection from 2016 to 2021
- Figure 7. Average relative risk score per track mile inspected from 2016 to 2021
- Figure 8. Average relative risk score multiplied by traffic volume, per inspection from 2016 to 2020
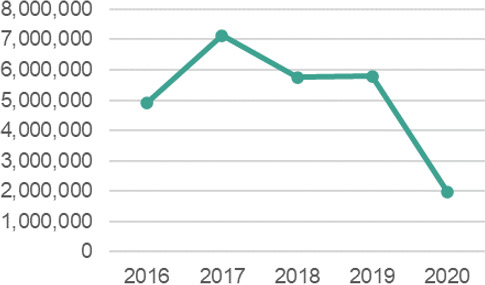
- Figure 9. Average relative risk score multiplied by traffic volume, per track mile inspected from 2016 to 2020
- Figure 10. Reportable accidents per million tonnes, 2000 to 2021
- Figure 11. Reportable incidents per million tonnes, 2000 to 2021
- Figure 12. Fatalities per million tonnes, 2000 to 2021
- Figure 13. Serious injuries per million tonnes, 2000 to 2021
- Figure 14. A count of compulsory language in federal regulations related to rail safety
- Figure 15. Incident rate with regulatory term counts
- Figure 16. Accident rate with regulatory term counts
- Figure 17. Relative risk per inspection
- Figure 18. Relative risk by track mile inspected
- Figure 19. Relative risk multiplied by traffic volume per inspection
- Figure 20. Relative risk multiplied by traffic volume, by track mile inspected
- Figure 21. Causes of reportable occurrences from 2015 to 2021
List of tables
- Table 1. Table of Eleven – key determinants of compliance
- Table 2. Detailed results of statistical analysis of risk-based (Component B) and random (Component A) inspections
- Table 3. Multiple linear regression on the number of defects (base: Component A inspection, in Ontario, in January)
- Table 4. Multiple linear regression on the risk score (base: Component A inspection, in Ontario, in January)
List of acronyms and abbreviations
- AMP
- Administrative monetary penalty
- FRA
- Federal Railroad Administration (USA)
- OAG
- Office of the Auditor General of Canada
- ONRSR
- Office of the National Rail Safety Regulator (Australia)
- ORR
- Office of Rail and Road (UK)
- RBBP
- Risk-based business planning
- RSIG
- Rail Safety Integrated Gateway
- SMS
- Safety Management System
- TC
- Transport Canada
- TSB
- Transportation Safety Board
Executive summary
In its 2021 Follow-up Audit on Rail Safety, the Office of the Auditor General of Canada recommended that Transport Canada (TC) "determine the extent to which its inspections and audits have improved the railway companies' compliance with regulations that mitigate key safety risks". TC's Evaluation and Advisory Services conducted the Evaluation of Rail Safety Oversight Activities in 2021-2022 to address this recommendation, by examining the following three questions:
- How do inspections, audits, and other oversight activities undertaken by the Rail Safety Program affect compliance?
- To what extent do Rail Safety's oversight activities contribute to safety in Canada's rail transportation system?
- Are there best practices in other jurisdictions which TC can adopt, with regard to effective oversight activities as well as demonstrating the impact of rail safety programs?
Our methodology was designed to respond directly to the Auditor General's challenge of assessing the extent to which Rail Safety oversight has improved compliance and safety. We placed particular emphasis on quantitative evidence through two statistical analyses:
- A case study of inspection results from Rail Safety's Track functional group to assess the performance of different inspection types, and risk over time; and
- An analysis of the relationship between regulation and rail occurrences over time.
We also examined how other regulators around the world have approached the challenge of measuring the impact of their oversight activities. Specifically, we looked at the Federal Railroad Administration in the USA, the Department for Transport and the Office for Rail and Road in the UK, and the Office of the National Rail Safety Regulator in Australia.
Key findings
With respect to key metrics for rail safety outcomes such as compliance or occurrence rates, we found that:
- Non-compliance rates for most Rail Safety functional groups have remained stable or decreased since 2015.
- Rail safety in Canada has improved overall in the last two decades, based on the analysis of occurrence data.
In terms of the impact of oversight activities on these outcomes, we found that:
- Risk-based inspections outperformed random inspections in their ability to identify high-risk non-compliances in recent years, which positions Rail Safety to address more of the risk in the rail system. We note that additional years of data are needed to confirm the trend, as the results are not statistically significant.
- There is evidence of a correlation between regulatory compulsion and reductions in incidents. The analysis shows that as compulsory language in regulations such as 'shall' or 'must' increased, incidents decreased. We did not observe the same relationship with accidents.
Finally, in terms how TC fares in comparison to key regulators around the world in assessing the impacts of its rail safety oversight, we found that:
- Directly measuring the extent to which oversight activities contribute to safety outcomes is a shared challenge: none of the regulators in US, UK and Australia have been able to quantitatively attribute safety outcomes to oversight activities.
- That said, TC can learn from these organizations in several ways, including the Federal Railroad Administration's increasing focus on data analytics, the Office of the National Rail Safety Regulator's enhanced risk assessment and planning process, and the Office for Rail and Road's safety management system (SMS) maturity model and effective use of risk data.
Based on our findings, we made two recommendations:
Recommendation 1:
To enable the creation of appropriate metrics, Rail Safety should internally define "oversight effectiveness" and the ways by which its oversight activities contribute to this.
Should the definitions and related analyses used in this evaluation resonate with Rail Safety, the Program could potentially leverage and build on this work.
Recommendation 2:
Rail Safety should consider expanding data collection to account for variables other than oversight that can impact intended outcomes. This would ensure relevant and good quality data is available for future quantitative analysis of oversight effectiveness.
Data such as population density along rail lines; list of which rules or regulations are intended to influence which types of occurrences; and information to enhance company profiles, such as changes in management or operations, financial capacity, and compliance history, can be particularly useful. We recognize the challenges with collecting some of this data, particularly company-specific information, but also note that alternatives or proxies could potentially be identified.
1 Introduction
1.1 Evaluation purpose & scope
The Evaluation of rail safety oversight activities was conducted in direct response to a recommendation made in the Office of the Auditor General of Canada's (OAG) 2021 Follow-up Audit on Rail Safety: "Transport Canada should determine the extent to which its inspections and audits have improved the railway companies' compliance with regulations that mitigate key safety risks."Footnote 1
The OAG observed that Transport Canada (TC) was not measuring the effectiveness of its oversight. While the OAG Audit specifically referenced compliance in its recommendation to address this, the supporting text in the audit, comments made by the Auditor General at the Public Accounts Committee in May 2021, and a scoping interview conducted with the OAG team for this evaluation underscore that the ultimate concern is whether TC's oversight activities are having an impact on rail safety. The evaluation was therefore intended to assess the impact of TC's oversight on compliance as well as on the safety of the rail transportation system.
The evaluation sought to answer the following key evaluation questions:
- How do inspections, audits, and other oversight activities undertaken by the Rail Safety Program affect compliance?
- To what extent do Rail Safety's oversight activities contribute to safety in Canada's rail transportation system?
- Are there best practices in other jurisdictions which TC can adopt, with regard to (i) effective oversight activities and (ii) demonstrating the impact of rail safety programs?
The evaluation's focus was on the external impacts of Rail Safety's oversight activities, specifically inspections and safety management system (SMS) audits, and how these impacts may be assessed and measured. The evaluation did not examine questions of program efficiency or internal processes such as rules-making.
1.2 Evaluation approach & methods
In accordance with the Treasury Board's Policy on Results (2016), this evaluation considered impact, examining the results of the Rail Safety oversight program and assessing the extent to which the program caused the observed results. Our approach was informed by Contribution Analysis conceptsFootnote 2, where we assessed questions of causality and the contribution of a particular intervention to an intended outcome.
The evaluation team placed particular emphasis on quantitative analysis to directly address the OAG recommendation and position TC to measure the impacts of its rail safety oversight moving forward.
Specific evaluation methods included:
Statistical Analyses
The evaluation draws from two statistical analyses:
- A case study of the inspection results for the Track functional group to assess risk over time and performance of different inspection types
- An analysis of the relationship between regulation and rail occurrences over time
The details of these analyses are outlined in Appendix A: Methods and Limitations.
Key Informant Interviews
The evaluation team conducted semi-structured interviews with 38 internal stakeholders (i.e., Rail Safety Inspectors, SMS Auditors, regional managers, Rail Safety management) and 20 external stakeholders (i.e., railway company representatives, officials from rail regulators in other jurisdictions). Interviews explored topics such as:
- Perspectives on the relationship between oversight activities, compliance, and safety
- Insights on Rail Safety's risk-based planning approach and methodologies
- Activities which cannot be statistically explored through existing data, namely SMS audits and education and awareness activities
- Best practices and experiences in other jurisdictions
Literature Review
The evaluation team conducted a detailed literature review to examine the following:
- How have other jurisdictions – rail regulators in other countries – approached the challenge of assessing the effectiveness of their rail safety oversight
- How, broadly speaking, oversight affects compliance, including a description of key determinants of compliance
- External factors that influence safety in the rail transportation system, such as environmental factors, technological solutions, and human factors
Document Review
The evaluation team conducted a thorough review of program documents, such as inspection and audit manuals, risk-based planning procedures, annual national oversight plans, and risk assessment methodologies, which provide details on Rail Safety Oversight's objectives, internal planning processes and risk methodologies, priorities, and changes to these over time. Examples of recent SMS audits were also reviewed to provide insight into the current approach and types of findings.
1.3 Program Profile
1.3.1 Program Structure & Logic
TC's Rail Safety Directorate is responsible for advancing rail safety through regulation and oversight. Many within the Directorate groups contribute to these efforts, including:
- Regulatory Affairs Branch
- Operations Management Branch
- Functional Groups, i.e., track, equipment, crossings, signals, and operations
- Regional Directors, Regional Managers, and Rail Safety Inspectors and Auditors in TC's five regions
- Centre of Enforcement Expertise and Regional Enforcement Units
The underlying logic of Rail Safety flows from regulation to oversight and compliance to reduced risk and safe behaviour, which contribute to a safe rail transportation system (Figure 1). Specifically, the Regulatory Affairs Branch develops the legislation, regulations, and policies aimed at safety in the rail transportation system. The Rail Safety Oversight Program is responsible for monitoring and confirming that federally regulated rail companies, both passenger and freight, comply with the rules and regulations and address any identified non-compliances. When companies comply, this should lead to safe behaviour and mitigate risks related to key oversight areas. This ultimately supports the overarching goal of a safe rail transportation system.
Long description
This figure shows a simplified logic model for Rail Safety. It begins with regulation which leads into the directorate's oversight activities. Oversight activities are intended to confirm compliance with relevant rules and regulations. Compliance should lead to safe behaviour and reductions in risk, which will contribute to a safe rail transportation system overall. Assumptions behind this program logic include: inspectors and auditors are adequately trained; inspection and audit practices accurately detect non-compliances; regulations can be reasonably implemented and followed by companies; companies are aware of and accept the requirements; rules and regulations, if followed, address issues and enhance safety; and Rail Safety accurately identifies and targets risks.
It is important to note that while compliance is a key step in this chain of results, it is not the only contributing factor to the safety of the rail transportation system; other factors such as technology, environmental conditions, and company culture have an impact on safety outcomes. In addition, rail safety is a shared responsibility between TC and other stakeholders (e.g., railway companies, road authorities, and the general public).
1.3.2 Oversight Activities
The Rail Safety Directorate promotes, monitors, and enforces compliance and safety. Formal monitoring activities include both inspections and audits.
Inspections
There are three types of inspections, namely:
- Random or Component A, which are planned inspections of randomly selected sites;
- Risk-based or Component B, which are planned inspections of specific safety and program management issues; and
- Reactive or Component C, which are unplanned inspections that can be follow-ups (i.e., done as needed to check that issues have been addressed), opportunity inspections (i.e., done while on-site for a planned inspection, as time allows), or focused on emerging issues.
Inspection activities involve an on-site meeting with the company to explain the scope and answer questions, the inspection itself, and a closing meeting to discuss results. During an inspection, the inspector checks for compliance to specific rules and regulations. Inspection findings and details are recorded in the Rail Safety Integrated Gateway (RSIG). If defects (i.e., non-compliances) are found, a Letter of Non-Compliance is sent. If other safety concerns are found, a Letter of Concern is sent. The railway must respond with planned corrective actions. Inspectors are responsible for determining if the corrective action is sufficient. Inspectors may also identify possible or immediate threats to safety that require immediate action.
Audits
Inspections of railway companies' SMS are referred to as audits. Audits are intended to identify deficiencies in a company's SMS and to verify compliance with Railway Safety Management System Regulations, 2015. An SMS is a system to manage safety and enable risk-based decision-making, comprised of various processes intended to identify concerns, manage occurrences, and manage knowledge within a company.
An audit typically includes an environmental scan of the company and its operating context, document review, observation, and interviews. An audit can identify non-compliances as well as deficiencies: the former is when a regulatory requirement has not been met while the latter is applicable when a railway company complied but there are gaps or the railway company has not fully carried out a process or procedure. Following an audit, an audit report is written and issued to the railway company. Following this, a corrective action plan by the railway company is required.
1.3.3 Oversight Planning
Rail Safety undertakes an annual risk-based business planning (RBBP) procedure. This process defines national and regional priorities and the number of planned inspections for each functional area. Issues are identified based on key data inputs such as Transportation Safety Board (TSB) occurrence data, inspection and audit data, complaints and inquiries, and Transportation Information Regulations (TIRs) submissions. A series of meetings are held regionally and amongst functional areas to discuss and identify issues, risk levels, and proposed activities. The plan is then approved by senior management.
Rail Safety first implemented its RBBP procedure in 2007.Footnote 3 An improved sampling framework was designed in 2012 and subsequently implemented in 2014, partially in response to the 2013 OAG Audit on Oversight of Rail Safety. This framework included recommendations for the resource allocation for three components: A (planned proactive), B (planned responsive), and C (unplanned emerging issue and opportunity).Footnote 4 In 2017, Rail Safety worked to further refine its sampling methodologies, and implemented this new risk-based planning procedure in 2018-19.Footnote 5 Changes included a reduction in the number of Component A inspections in favour of Component B inspections, and updated risk analyses. The 2021 OAG Follow-up Audit found that Rail Safety had improved its risk-based planning and increased the number of risk-based inspections.
2. Findings & observations
The findings below are intended to respond as directly as possible to OAG's challenge of determining the extent to which TC oversight of railway companies has improved compliance and safety.
Attributing and quantifying what portion of the outcome of compliance is due to TC oversight is a near impossible undertaking, and even more so when it comes to the safety outcome. That is because so many other factors also influence these outcomes, as our review of authoritative literature and interviews corroborate. TC is not alone; our evaluation confirmed that other major rail safety regulators have also struggled to meet this challenge.
It is within this context that we planned our methodology. We prioritized quantitative analysis, keeping in mind the Auditor General's caution at the May 6, 2021, meeting of the Standing Committee on Public AccountsFootnote 6 about overreliance on anecdotal evidence. Our priority was therefore to identify what was feasible in terms of quantitative analysis and to implement it to the best of our ability within a reasonable project timeline.
We present first our findings and observations on the contribution of Rail Safety's oversight activities to compliance and safety, followed by a discussion of how other countries grapple with this question.
2.1 Effectiveness of Transport Canada's oversight activities
2.1.1 Compliance
The following lines of evidence inform our observations on Rail Safety Oversight's contributions to railway companies' compliance with regulations:
- Statistical analysis of random and risk-based Inspections in the Track functional group
- Interviews with internal and external stakeholders
- Literature review of key determinants of compliance and the relationship between oversight and compliance
- Program document review of planning procedures, risk measurement methodologies, and inspection procedures
Compliance outcomes
Observation: Non-compliance rates for most functional areas have remained stable or decreased since 2015.
Rail Safety Oversight is responsible for monitoring and verifying that railway companies are in compliance with the Railway Safety Act and associated regulations, rules, and standards. To measure compliance, the Program tracks non-compliance or defect rates in each functional area. This provides insight into how well rail companies are doing at meeting regulatory requirements and how well Rail Safety Oversight is doing at detecting issues.
Typically, defect rates are calculated using the results of random inspections, as these are intended to be an unbiased representation of the industry as a whole.
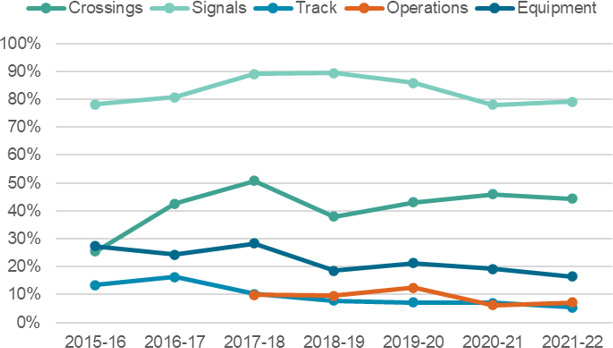
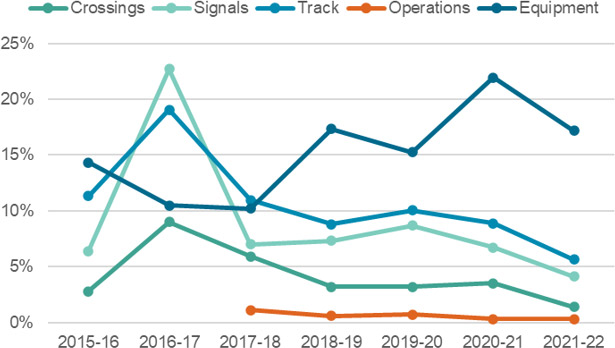
TC's internal data indicates that defect rates for most functional groups have remained stable or decreased since 2015-16 (see Figure 2 and Figure 3). We base our observation on two different ways of calculating a defect rate.
In one method, the ratio is obtained by dividing the number of inspections with one or more defects by the total number of inspections carried out.Footnote 7 Under this method, we see that the defect rates for Equipment and Track decreased between 2015-16 and 2021-22 and remained relatively stable for Signals and Operations (Figure 2). The defect rate for Crossings increased, implying that the proportion of non-compliant inspections has increased. We note that this method does not differentiate between an inspection with one defect and an inspection with multiple defects.
Long description
This figure is a line graph depicting defect rates for each functional group by fiscal year, from 2015-2016 to 2021-2022. In this chart, defect rate is based on the number of inspections with one or more defect divided by the total number of inspections. For most functional groups, except for Crossings, the defect rate decreased or remained stable.
The defect rate for Crossings was 25.5% in 2015-16, 42.6% in 2016-17, 50.7% in 2017-18, 37.9% in 2018-19, 43.0% in 2019-20, 45.9% in 2020-21, and 44.4% in 2021-22.
The defect rate for Signals was 78.2% in 2015-16, 80.7% in 2016-17, 89.0% in 2017-18, 89.4% in 2018-19, 85.8% in 2019-20, 78.0% in 2020-21, and 79.2% in 2021-22.
The defect rate for Track was 13.4% in 2015-16, 16.3% in 2016-17, 10.2% in 2017-18, 7.8% in 2018-19, 7.2% in 2019-20, 7.1% in 2020-21, and 5.4% in 2021-22.
The defect rate for Operations was 9.9% in 2017-18, 9.5% in 2018-19, 12.4% in 2019-20, 6.2% in 2020-21, and 7.1% in 2021-22.
The defect rate for Equipment was 27.3% in 2015-16, 24.3% in 2016-17, 28.3% in 2017-18, 18.6% in 2018-19, 21.3% in 2019-20, 19.2% in 2020-21, and 16.4% in 2021-22.
Under another method, currently employed for reporting to Rail Safety senior management, an equal weighted average of the defect rates for all inspections is divided by the total number of inspections. This calculation shows that defect rates for Crossings, Signals, and Track generally decreased between 2015-16 and 2021-22, demonstrating improvements in compliance overall (Figure 3). The defect rate for Operations has remained relatively stable under this method. The defect rate for Equipment has increased, meaning the average defect rate per inspection has increased. We note that unlike the previous method, this one differentiates between an inspection with one defect and one with many defects. However, we also note that one method is not necessarily better than the other, and which one to use is dependent on Rail Safety's information needs.
Long description
This figure is a line graph depicting defect rates for each functional group by fiscal year, from 2015-2016 to 2021-2022. In this chart, defect rate is based on an equal weighted average of defects divided by the total number of inspections. For most functional groups, except for Equipment, the defect rate decreased or remained stable.
The defect rate for Crossings was 2.8% in 2015-16, 9.0% in 2016-17, 5.9% in 2017-18, 3.2% in 2018-19, 3.2% in 2019-20, 3.5% in 2020-21, and 1.4% in 2021-22.
The defect rate for Signals was 6.4% in 2015-16, 22.7% in 2016-17, 7.0% in 2017-18, 7.3% in 2018-19, 8.7% in 2019-20, 6.7% in 2020-21, and 4.1% in 2021-22.
The defect rate for Track was 11.3% in 2015-16, 19.1% in 2016-17, 11.0% in 2017-18, 8.8% in 2018-19, 10.1% in 2019-20, 8.9% in 2020-21, and 5.7% in 2021-22.
The defect rate for Operations was 1.1% in 2017-18, 0.6% in 2018-19, 0.7% in 2019-20, 0.3% in 2020-21, and 0.3% in 2021-22.
The defect rate for Equipment was 14.3% in 2015-16, 10.5% in 2016-17, 10.2% in 2017-18, 17.4% in 2018-19, 15.3% in 2019-20, 22.0% in 2020-21, and 17.2% in 2021-22.
There is a third method of calculating defect rates, which considers the ratio of the total number of defects across all inspections divided by the total number of logic checksFootnote 8 performed across all inspections.Footnote 9 However, this method is no longer typically used by Rail Safety, as by summing all defects and logic checks the resulting defect rate is likely biased and smaller than what actually occurs in the system.
Transport Canada's contribution to compliance
Observation: Interview evidence suggests that Rail Safety's inspection and audit activities do contribute to compliance, though the extent of this contribution is challenging to quantify.
A review of the literature and stakeholder interviews show that a complex set of variables influence whether or not a regulated entity complies with regulations. While these lines of evidence do not provide quantitative evidence of the extent to which TC oversight impacts regulatory compliance, they do provide useful insights and context with which to understand the link between oversight and compliance.
Behavioural science and field studies establish that compliance boils down to whether a regulated entity is aware of and understands the rules, is willing to comply, and is able to comply.Footnote 10 Motivations typically revolve around a fear of detection and punishment, reputational pressure, and an overall sense of duty.Footnote 11 The frequently referenced Table of Eleven (Table 1 below) groups the determinants of compliance into categories of spontaneous compliance (i.e., voluntary compliance that would happen without enforcement), control dimensions (i.e., the influence of possible detection), and sanctions dimensions (i.e., the influence of enforcement when non-compliance is found).Footnote 12 Among other factors, the risk of inspection, the risk of detection, and the risk and severity of enforcement actionsFootnote 13 play an important role in whether regulated entities comply.
| Spontaneous | Control | Sanctions |
|---|---|---|
|
|
|
We further explored with our internal and external interviewees factors that, in their experience, positively and negatively affect railway companies' compliance with regulations. Their insights largely echoed the literature on compliance. The interviewees mentioned the following variables:
- The presence on site of Rail Safety Inspectors and auditors;
- Turnover and staffing challenges within a railway;
- Experience levels and training for railway staff, and general understanding of how to interpret regulations;
- A company's financial resources, especially relevant in a low-margins sector;
- Company business considerations, such as efficiency of operations and public perception;
- The presence of railway supervisors and/or management on-site; and
- The geographic location of the line or yard (i.e., major corridors versus secondary lines, remote areas, etc.).
Several (n=5) internal interviewees mentioned that an inspector's presence or potential presence on site encourages compliance and appropriate behaviour, similar to police presence impacting driver behaviour on a highway. This is particularly relevant in the operations context, where inspectors typically directly observe rail company employees carrying out their tasks.
Inspectors and auditors also shared various anecdotes of non-compliances they had detected that were subsequently corrected as a result of inspection activities and the corrective actions required of railway companies. While a few (n=3) interview participants indicated that people in railways want to do well, another highlighted that the presence of inspectors is key to avoid complacency.
The majority of external interviewees (10 out of 12 company representatives who spoke on this) indicated that inspection and audit activities contributed to their companies' ability to comply, but there was no apparent consensus on the strength of this contribution. They highlighted that Rail Safety Oversight serves as a second set of eyes to identify issues that may otherwise have been missed by their company. Interactions with Rail Safety staff also serve as a learning opportunity for railway employees, whether as part of a formal inspection or audit, or through informal conversations.
A number of interview participants brought up the issue of consistency when discussing compliance. Some rules and regulations are open to interpretation, particularly in an SMS context. This can cause confusion for railways, inspectors, and auditors. Two internal and two external interviewees noted the disparities from one region to another, or from one inspector or auditor to another, in terms of how inspections are carried out and how rules are interpreted. There can be several reasons. For instance, inspectors have different backgrounds and knowledge and so may have a different interpretation of the same rule. Similarly, one interviewee said that inspection procedures are somewhat generic and there can be room for interpretation. It was also noted that some regions may use Administrative Monetary Penalties (AMPs) more or less than others. While noted as a challenge, interview evidence does not point to consistency as hampering compliance in a significant way. Some (n=4) inspectors did indicate that Rail Safety's internal boot camps and meetings have improved consistency.
To measure the impacts of inspections on compliance, the evaluation team, in collaboration with risk specialists, conducted a quantitative analysis of inspection results to assess performance of different inspection types as well as risk over time. Below are the results of our analysis.
Finding: In recent years, risk-based inspections outperformed random inspections in their ability to identify high-risk non-compliances, allowing Rail Safety to address more of the risk in the rail system. However, additional years of data are needed to confirm the trend, as the results are not statistically significant.
Rail Safety Oversight has placed increasing emphasis on its risk-based inspections in recent years: 75% of planned oversight activities in 2020-21 were risk-based, compared to 25% in 2015-16.
To assess the impact of this increased focus on risk-based inspections, the evaluation team, in collaboration with risk specialists,Footnote 14 conducted a statistical analysis that compared risk-based inspections to random inspections (see Box 1). We wanted to test whether risk-based inspections performed better than random inspections. We defined better performance as the ability to identify higher-risk non-compliances. If Rail Safety Oversight is able to identify more of the higher-risk non-compliances, then it would be in a position to address them, and therefore reduce more of the risk in the rail system. This would justify Rail Safety's increased focus on risk-based inspections.
Box 1. Statistical Analysis of Inspections from the Track Functional Group: Risk-based vs. Random Inspections
To explore whether Track’s risk-based inspections identified higher risk locations and a greater number of high-risk non-compliances than random inspections. Through a series of workshops with track inspectors, relative risk scores for each critical rule and accident type were determined. Two analyses were carried out:
- The risk scores were statistically analyzed to determine if the observed trends were statistically significant.
- A multivariate regression analysis was used to examine inspection data for one year, to again test if there was a statistically significant difference.
See Appendix A: Methods and Limitations for further detail.
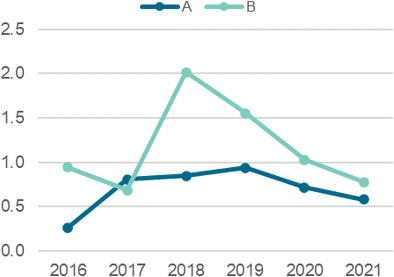
The analysis found that in five out of six years between 2016 to 2021, Track's risk-based inspections (B) frequently outperformed random inspections (A):
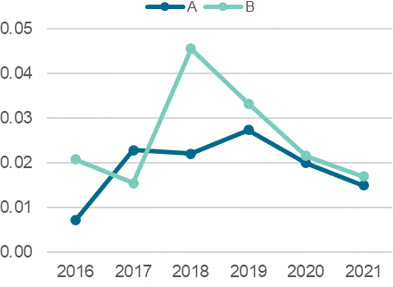
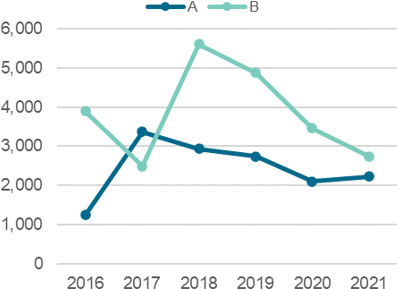
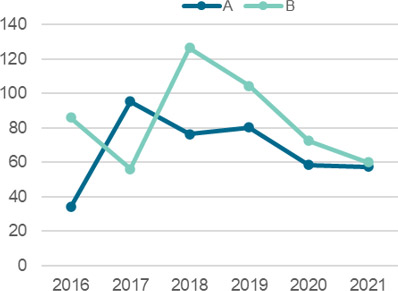
- In five out of six years, risk-based inspections found more critical non-compliances per inspection (Figure 4) and per track mile inspected (TMI) (Figure 5) than those found by random inspections.
- The non-compliances had higher risk scores per inspection (Figure 6) and per TMI (Figure 7) than those found by random inspections.
Long description
This line graph shows the number of critical rule defects found per inspection by the Track functional group between 2016 and 2021. One line shows the results for Component A (i.e., random) inspections and the other line shows the results for Component B (i.e., risk-based) inspections. With the exception of 2017, Component B inspections found more critical rule defects per inspection than Component A, particularly in 2018 and 2019. Component A inspections found 0.26 critical rule defects per inspection in 2016, 0.81 in 2017, 0.85 in 2018, 0.94 in 2019, 0.71 in 2020, and 0.58 in 2021. Component B inspections found 0.94 critical rule defects per inspection in 2016, 0.68 in 2017, 2.02 in 2018, 1.55 in 2019, 1.03 in 2020, and 0.78 in 2021.
Long description
This line graph shows the number of critical rule defects found per track mile inspected by the Track functional group between 2016 and 2021. One line represents Component A (i.e., random) inspections and the other Component B (i.e., risk-based) inspections. With the exception of 2017, Component B inspections found more critical rule defects per track mile than Component A, particularly in 2018. Component A inspections found 0.0072 critical rule defects per track mile inspected in 2016, 0.0228 in 2017, 0.0221 in 2018, 0.0274 in 2019, 0.0199 in 2020, and 0.0149 in 2021. Component B inspections found 0.0207 critical rule defects per track mile inspected in 2016, 0.0154 in 2017, 0.0154 in 2018, 0.0444 in 2019, 0.0215 in 2020, and 0.0170 in 2021.
Long description
This line graph shows the average relative risk score per inspection by the Track functional group from 2016 to 2021. One line represents Component A (i.e., random) inspections and the other Component B (i.e., risk-based) inspections. With the exception of 2017, Component B inspections had a higher average relative risk score than Component A. Component A inspections had an average risk score of 1246 in 2016, 3368 in 2017, 2930 in 2018, 2741 in 2019, 2098 in 2020, and 2230 in 2021. Component B inspections had an average risk score of 3895 in 2016, 2492 in 2017, 5602 in 2018, 4872 in 2019, 3464 in 2020, and 2746 in 2021.
Long description
This line graph shows the average relative risk score per track mile inspected by the Track functional group from 2016 to 2021. One line represents Component A (i.e., random) inspections and the other Component B (i.e., risk-based) inspections. With the exception of 2017, track miles inspected through Component B had a higher average relative risk score than Component A. Component A had an average risk score of 34.10 per track mile in 2016, 95.33 in 2017, 76.31 in 2018, 80.19 in 2019, 58.43 in 2020, and 57.31 in 2021. Component B had an average risk score of 85.85 per track mile in 2016, 56.07 in 2017, 126.55 in 2018, 104.42 in 2019, 72.49 in 2020, and 60.05 in 2021.
The results suggest that risk-based inspections are succeeding in identifying more of the riskier non-compliances. This is an early indication that conducting more risk-based inspections is the right direction for Rail Safety, since identifying and addressing higher risk non-compliances allows Rail Safety to help reduce risk in the rail system.
That said, the trend observed lacks statistical significance (see Table 2 in Appendix B), meaning we cannot currently assert that the reason risk-based inspections have outperformed random ones is due to more than chance. We must highlight, however, that Rail Safety's focus on risk-based inspections is a relatively new development, which means there were not as many years of data available for our analysis as we would have liked. At this point, the results of the statistical analysis only suggest a trend, which could potentially be confirmed as additional years of data become available.
The evaluation team approached the statistical analysis in another way, this time using inspection data within a single year. The evaluation team used data from 2019.Footnote 15 Performing an analysis at a more granular level, such as comparing individual inspections instead of yearly averages, provides more data points (415 as opposed to the 12) and as such, more statistical power. However, it also requires more control variables to account for other factors that can affect inspections that are irrelevant on a bigger scale (i.e., weather patterns or seasonal impacts), which is a significant drawback of focusing on a single year of inspection data.
The results of the analysis, which consisted of running a multiple linear regression for both the number of defects (Table 3 in Appendix B) and the relative risk score of an inspection (Table 4 in Appendix B), did not reveal any statistically significant difference between risk-based and random inspections. The model results show signs of other variables mentioned in the previous paragraph having an impact on risk scoresFootnote 16.
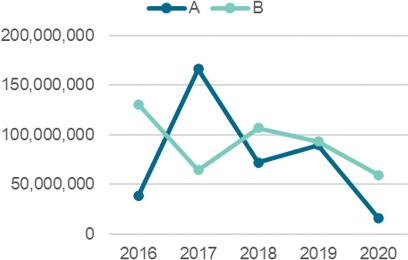
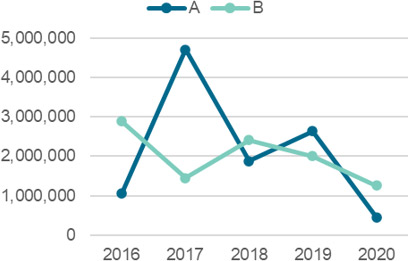
We further refined our statistical analysis by considering traffic volume. The analysis showed that non-compliances identified through risk-based inspections had a higher average risk score for three out of five years, both for inspections and per TMI (Figure 8, Figure 9). However, these results also lacked statistical significance (see Table 2 in Appendix B).
Long description
This line graph shows the average relative risk score multiplied by traffic volume per inspection by the Track functional group from 2016 to 2020. One line represents Component A (i.e., random) inspections and the other Component B (i.e., risk-based) inspections. With the exception of 2017, Component B inspections had a higher average relative risk score accounting for traffic volume. The average relative risk score multiplied by traffic volume per Component A inspection was 38,644,895 in 2016, 166,222,759 in 2017, 72,160,563 in 2018, 89,820,777 in 2019, and 16,274,331 in 2020. The average relative risk score multiplied by traffic volume per Component B inspection was 130,799,986 in 2016, 64,392,664 in 2017, 106,583,218 in 2018, 93,362,453 in 2019, and 59,773,675 in 2020.
Long description
This line graph shows the average relative risk score multiplied by traffic volume, per track mile inspected by the Track functional group from 2016 to 2020. One line represents Component A (i.e., random) inspections and the other Component B (i.e., risk-based inspections). Component A had a higher average relative risk score accounting for traffic volume per track mile inspected in 2017 and 2019, and Component B had a higher average relative risk score accounting for traffic volume per track mile inspected in 2016, 2018, and 2020. The risk score by traffic volume per track mile for Component A was 1,057,554 in 2016, 4,704,899 in 2017, 1,879,095 in 2018, 2,628,207 in 2019, and 453,209 in 2020. The risk score by traffic volume per track mile for Component B was 2,882,611 in 2016, 1,448,657 in 2017, 2,407,678 in 2018, 2,000,982 in 2019, and 1,250,746 in 2020.
In support of these statistical analyses, interview results (n=11 inspectors and managers, n=6 auditors and SMS managers) generally showed support for the current ratio of risk-based inspections versus random inspections, enabling a more consistent and robust process which balances national perspective with regional knowledge. However, others identified a need for better quality data, more regional capacity for risk analysis, and accounting for more variables in the risk measurement process. The latter point aligns with our observations in our statistical analysis. While the data suggests that risk-based inspections may be outperforming random inspections, additional years of data will be needed to confirm the results more conclusively. Moreover, additional risk factors and variables would be identified and accounted for in future analyses, where risk scores could be validated and enhanced through further elicitation with experts. Our analysis provides a framework that Rail Safety could further build upon and refine.
Obervation: Education activities for industry stakeholders, though ad hoc, are valued aspects of Rail Safety's oversight work.
In addition to the statistical analysis above suggesting risk-based inspections may improve oversight effectiveness, interview evidence highlighted education for industry as another important aspect of oversight.
Conversations with inspectors and auditors indicated that education and outreach with industry, and in select circumstances the public, is a part of their roles, though it is not necessarily structured or formally tracked. During oversight activities, inspectors and auditors will go over rules or regulations, highlight changes, and make sure railway staff are aware of and understand these requirements, their roles, best practices, and key issues. Outside of oversight activities, railways may reach out to Rail Safety staff with questions or requests for presentations. Formal information sessions are also held occasionally, such as when a new rule or regulation is released. Different regions may take different approaches, as education and awareness is not a formalized process, but some interviewees (n=4 out of 6 that spoke about time involved) suggested it is a large part of their work.
Though it can be challenging to measure the impacts of education and awareness activities, internal and external interview participants highlighted the value of education through these interactions and discussions. Some (n=4) external stakeholders indicated an appreciation for their relationships with Rail Safety staff. Rail Safety Oversight and Regulatory Affairs are available to contact for questions and to discuss interpretations of rules and regulations. Stakeholders generally (n=4 out of 7) noted that Rail Safety is responsive.
"The most valuable interaction is the boots-on-the-ground inspections, the facetime with inspectors, where they can see the challenges and share their ideas. That level of understanding goes a long way."
Inspectors are seen as knowledgeable and key information sources for railway staff. Discussions during inspections and audits are viewed as a learning opportunity.
This aspect of oversight is reflected in documents outlining the role of regulators. For instance, the OECD Regulatory Enforcement and Inspections Toolkit lists compliance promotion, including guidance material, active outreach, and on-the-ground advice, as one of the key principles.Footnote 17 Various other regulatory bodies in Canada (e.g., the Impact Assessment Agency, the Canadian Food Inspection Agency) state compliance promotion – such as information sharing in day-to-day interactions, leading information sessions, and issuing publications – is a part of their roles. TC also acknowledges education and outreach as part of its role: for instance, in the Integrated National Oversight Plan education, outreach, and awareness is noted as part of the work of safety and security programs, though sometimes informal and without dedicated funding, as is the case for Rail Safety.Footnote 18
This is also one of the underlying assumptions of the previously presented program logic (see Figure 1): that railway companies are aware of and understand the regulations with which they are expected to comply.
A few (n=3) interviewees noted that more discussion and collaboration between industry and the regulator would be valuable, and that there are opportunities to build knowledge and trust. Two stakeholders indicated that interactions with local inspectors have been infrequent, possibly partially due to COVID in recent years. Beyond information sessions for new requirements, ongoing support and training sessions on interpretations and roles could be useful, particularly for new staff entering the industry.
2.1.2 Safety
The following lines of evidence inform our observations on Rail Safety Oversight's contributions to the safety of the rail system:
- Statistical analysis of:
- The relationship between changes in regulation and trends in occurrence data over time
- Random and risk-based inspections in the Track functional group
- Interviews with internal and external stakeholders
- Literature review of safety culture and other factors that contribute to safety
Safety outcomes
Observation: Based on occurrence data, rail safety has improved overall in the last two decades.
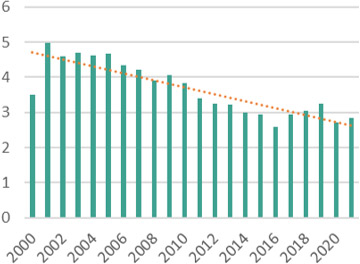
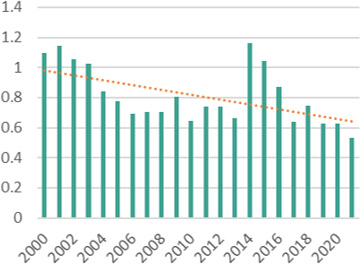
The ultimate aim of Rail Safety Oversight is to achieve a safe rail transportation system. Current metrics for safety include accident, incident, fatality, and serious injury rates. Transportation Safety Board (TSB) data shows that, broadly speaking, safety in the rail industry has improved over time. ReportableFootnote 19 accidents have been trending downwards since 2000, and this trend is particularly clear when accounting for traffic volume (Figure 10). While reportable incidents increased in 2014 and 2015, overall the rate of incidents per million tonnes has been decreasing (Figure 11). Details from the TSB highlight that a greater number of non-main-track derailments occur than other types of accidents and incidents, noting that non-main-track accidents are typically minor.
Long description
This figure is a bar chart overlaid with a trendline, showing reportable rail accidents per million tonnes from 2000 to 2021. Overall, the number of accidents per million tonnes of freight traffic has trended down. There were 3.51 reportable accidents per million tonnes in 2000, 4.97 in 2001, 4.59 in 2002, 4.70 in 2003, 4.64 in 2004, 4.68 in 2005, 4.34 in 2006, 4.21 in 2007, 3.91 in 2008, 4.06 in 2009, 3.83 in 2010, 3.41 in 2011, 3.26 in 2012, 3.23 in 2013, 2.99 in 2014, 2.94 in 2015, 2.59 in 2016, 2.94 in 2017, 3.04 in 2018, 3.25 in 2019, 2.70 in 2020, and 2.85 in 2021.
Long description
This figure is a bar chart overlaid with a trendline, showing reportable rail incidents per million tonnes from 2000 to 2021. Overall, the number of incidents per million tonnes of freight traffic has trended down, with a spike in 2014 and 2015. There were 1.10 reportable incidents per million tonnes in 2000, 1.14 in 2001, 1.06 in 2002, 1.02 in 2003, 0.84 in 2004, 0.78 in 2005, 0.69 in 2006, 0.70 in 2007, 0.70 in 2008, 0.80 in 2009, 0.65 in 2010, 0.74 in 2011, 0.74 in 2012, 0.66 in 2013, 1.16 in 2014, 1.05 in 2015, 0.87 in 2016, 0.64 in 2017, 0.74 in 2018, 0.63 in 2019, 0.63 in 2020, and 0.53 in 2021.
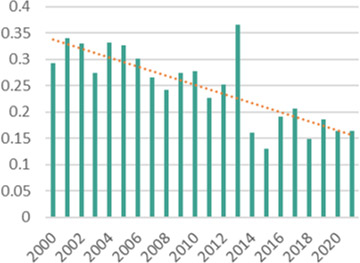
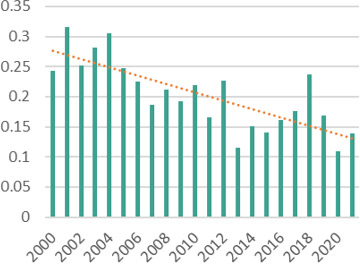
The rate of fatalities and serious injuries per million tonnes have also been trending downwards over time (Figure 12, Figure 13). Data shows that serious injuries and fatalities are frequently due to trespassing and grade crossing-related accidents.
Long description
This figure is a bar chart overlaid with a trendline, showing fatalities per million tonnes of freight traffic from 2000 to 2021. Overall, the number of fatalities has trended down over time. There were 0.29 fatalities per million tonnes in 2000, 0.34 in 2001, 0.33 in 2002, 0.27 in 2003, 0.33 in 2004, 0.33 in 2005, 0.30 in 2006, 0.27 in 2007, 0.24 in 2008, 0.27 in 2009, 0.28 in 2010, 0.23 in 2011, 0.25 in 2012, 0.37 in 2013, 0.16 in 2014, 0.13 in 2015, 0.19 in 2016, 0.21 in 2017, 0.15 in 2018, 0.19 in 2019, 0.16 in 2020, and 0.16 in 2021.
Long description
This figure is a bar chart overlaid with a trendline, showing serious injuries per million tonnes from freight traffic from 2000 to 2021. Overall, the number of serious injuries has gone down. There were 0.24 serious injuries per million tonnes in 2000, 0.32 in 2001, 0.25 in 2002, 0.28 in 2003, 0.30 in 2004, 0.25 in 2005, 0.22 in 2006, 0.19 in 2007, 0.21 in 2008, 0.19 in 2009, 0.22 in 2010, 0.17 in 2011, 0.23 in 2012, 0.12 in 2013, 0.15 in 2014, 0.14 in 2015, 0.16 in 2016, 0.18 in 2017, 0.24 in 2018, 0.17 in 2019, 0.11 in 2020, and 0.14 in 2021.
Transport Canada's contribution to safety
Finding: There is evidence of a correlation between regulatory change and improvements in safety.
Interviews highlighted that it is difficult to directly determine the impact of oversight activities on safety. In general, it was agreed that oversight feeds into compliance, and that compliance is important for safety. After all, as some (n=4) noted, the rules are in place because they are intended to have an effect on safety. However, as one participant stated:
"We never really know exactly how many accidents we help to prevent. You know you are having an impact [by seeing the changes] and making a difference, but you don't know how many accidents you prevent."
For interview participants, while many (n=26) felt oversight is important, its contribution to safety was less clear than to compliance. As with the discussions on the link between oversight and compliance, inspectors and auditors shared anecdotal stories of specific corrections and improvements that they have observed as a result of their oversight. For external interview participants, positive feedback often related to collaboration and education as helping to improve safety. There is value in industry and the regulator discussing regulatory requirements, safety concerns, and trends.
While interviews provided useful insight and context, statistical analyses provided preliminary evidence of a relationship between Rail Safety's work and safety outcomes.
One assumption in Rail Safety Oversight's program logic is that the rules and regulations being monitored and enforced are ones that, if followed, will have a positive effect on safety outcomes.
Box 2. Measuring the Relationship Between Rail Safety and Regulations
This analysis examined whether there is a link, broadly speaking, between regulations and safety in the rail system. The relationship between accident and incident trends and changes in regulatory compulsion were assessed through statistical techniques such as Spearman’s Correlation and break point testing.
We note that this analysis can provide insight on correlation, not contribution.
See Appendix A: Methods and Limitations for further detail.
In 2021, at the request of the evaluation team, TC's Multimodal Analytics team undertook an analysis of the relationship between 'regulatory compulsion' (the action of being compelled to abide by a regulation) and rail occurrence data (see Box 2).Footnote 20 Specifically, this analysis compared changes in rail-related regulatory compulsion to trends in rail safety occurrences over time by examining compulsory language (e.g., must, shall) in Canadian transportation regulations.
Data indicates that the degree of compulsion in regulations was relatively constant until the mid-2010s (Figure 14). Over time, we see an increase in regulatory compulsion and a decrease in occurrences, suggesting a potential negative relationship between compulsory language in regulations and occurrences.
Long description
This bar chart shows the counts of compulsory language in federal regulations related to rail safety from 2006 to 2021. Compulsory language remains relatively stable until the mid-2010s, and an increase is seen from 2014-2015 to 2020-2021. The mean regulatory terms count was 801.5 in 2006-2007, 791 in 2008-2009, 791 in 2010-2011, 802.5 in 2012-2013, 914 in 2014-2015, 1033 in 2016-2017, 1368.5 in 2018-2019, and 1630 in 2020-2021.
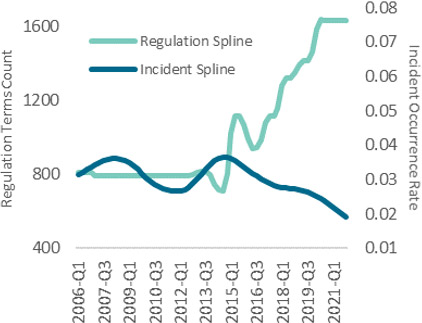
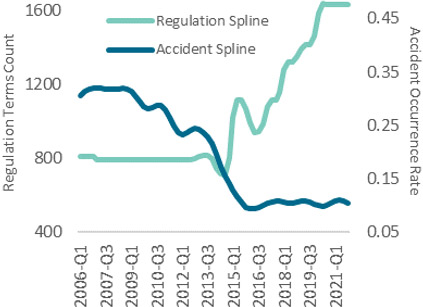
Further exploration of this relationship through a series of statistical tests assessed the significance of the relationship. The statistical analyses demonstrated that the increase in regulatory compulsion since approximately 2015 is correlated with a decrease in incidents (Figure 15). However, the same cannot be said for the accident rate. While the accident rate declined prior to 2014, it remained relatively stable afterward and does not demonstrate the same relationship with regulatory compulsion (Figure 16).
Long description
This line chart shows the results of the statistical analysis of compulsory language in regulations and incident rate over time. Two lines are overlaid: one represents the regulation spline and the other represents the incident spline. The chart shows that while both lines remained stable until 2014, the incident rate begins to decrease after 2014 while the regulatory compulsion rises.
Long description
This line chart shows the results of the statistical analysis of compulsory language in regulations and accident rate over time. Two lines are overlaid: one represents the regulation spline and the other represents the accident spline. The chart shows a decrease in accident rate over time, though it is relatively stable after 2014. The regulation spline remains stable until 2014 and then increases after 2014 The two series do not appear to be aligned.
The relationship identified between regulatory compulsion and incidents over time suggests that Rail Safety's regulations are having an impact. It follows that oversight activities checking for compliance to these regulations play a role in that relationship.
We note that this analysis examines regulations but not rules, which are also a significant part of the rail regulatory framework. Rules are requirements "submitted by industry and approved by the Minister of Transport."Footnote 21 The tool used to quantify compulsory language was developed specifically to analyze regulatory text from the Canadian Department of Justice's Laws and Regulations portal, and thus could not be extended to rules at this time. Future analyses could investigate whether there is an observable relationship between rules and incidents or accidents as well.
In summary, this analysis found a negative relationship between regulation and incidents since 2015, that is, as regulatory compulsion increases, the incident rate declines. The observed decline in accidents was not shown to be statistically related to changes in regulation as the decline began prior to 2015. It is possible the decrease in accidents is related to rules or other factors, and this could be explored in future analyses.
Finding: The average relative risk score per inspection for the Track functional group increased from 2016 to 2018 and decreased from 2018 to 2021.
The case study of Track's inspection data also enables the consideration of changes in risk levels over time (see Box 3). The assumption is that a decrease in risk scores overall year-by-year – that is, fewer high-risk non-compliances identified over time – would imply an improvement in Track safety.
Box 3. Statistical Analysis of Inspections from the Track Functional Group: Risk Over Time
This analysis relied on the relative risk scores determined through consensus-based expert elicitation. Risk scores for all inspections in each year of available data were aggregated to consider changes in risk levels over time.
See Appendix A: Methods and Limitations for further detail.
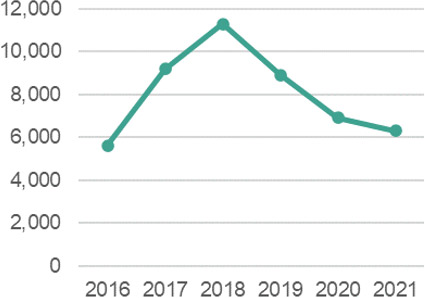
Based on the overall risk level per inspection for Track, the analysis found that between 2016 and 2018, an increasing number of critical non-compliances per inspection were being identified, peaking in 2018 (Figure 17). Since then, fewer are being found, meaning the overall risk level per inspection has been trending downward in recent years. The risk score per track mile inspected (TMI) (Figure 18) also shows the increase to 2018 and a decrease in risk score since that time.
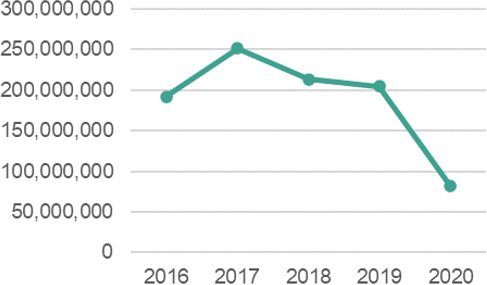
Accounting for traffic volume with this data shows an overall decrease in risk score for these metrics (Figure 19, Figure 20).
While the decrease in risk score since 2018 could be indicative of a recent improvement in track safety, there are insufficient years of data to determine whether this constitutes a trend. Although firm conclusions are not possible at this juncture, as more years of data becomes available, tracking risk over time could be used as an additional measure of safety improvements.
Long description
This line graph shows the relative risk for Track inspections over time from 2016 to 2021. The relative risk increased between 2016 and 2018 and decreased from 2018 to 2021. Specifically, the relative risk per inspection was 5623.1 in 2016, 9206.6 in 2017, 11304.2 in 2018, 8920.8 in 2019, 6907.0 in 2020, and 6310.6 in 2021.
Long description
This line graph shows the relative risk by track mile inspected by the Track functional group from 2016 to 2021. The relative risk per track mile inspected was 141.1 in 2016, 308.4 in 2017, 319.7 in 2018, 254.7 in 2019, 190.4 in 2020, and 197.4 in 2021.
Long description
This line graph shows the relative risk multiplied by traffic volume by inspection for the Track functional group from 2016 to 2020. The result was 191,666,401 in 2016, 251,718,584 in 2017, 213,566,665 in 2018, 204,785,378 in 2019, and 81,886,452 in 2020.
Long description
This line graph shows the relative risk multiplied by traffic volume by track mile inspected by the Track functional group from 2016 to 2020. The result was 4,914,003 in 2016, 7,143,556 in 2017, 5,754,608 in 2018, 5,787,361 in 2019, and 1,962,240 in 2020.
To summarize, the results outline recent annual risk scores for non-compliances identified by the Track group. Continuing to monitor risk scores over time can confirm trends and whether there are identifiable improvements in safety.
Safety beyond compliance
The general understanding is that Rail Safety Oversight contributes to safety outcomes through its efforts to monitor and encourage compliance. However, while compliance with rules and regulations is a contributor to safety, compliance is not the sole determinant of safety. Interview evidence found a number of limitations to relying on compliance as an indicator of safety:
- Accidents may be due to a combination of conditions, rather than a specific non-compliance. It may be that everything meets the minimum requirements, but a combination of factors creates a moment of failure.
- A piece of equipment may be compliant at the time of inspection but may suddenly fail due to an undetected internal flaw.
- Human error is always a possibility.
- Some contexts or nuances of an individual operation are not explicitly covered by rules and regulations. For instance, some rules may be more applicable to freight rail than to the conditions of a commuter operation. Similarly, bridges are not currently covered by a set of regulations.
- There are rules that may or may not be as important for safety, and as such, not all non-compliances are a major safety concern.
Interview participants noted a variety of other factors, such as technology, environmental conditions, the experience and knowledge levels of railway staff, public behaviour, company culture, and human behaviour and error, which all influence the safety of the rail system. Literature highlights similar factors, such as:
- Technology: Innovative technological solutions such as Enhanced Train Control (ETC), locomotive voice and video records (LVVR), drones, and smart sensors and detectors can help reduce human error, detect potential mechanical issues, and prevent collisions or derailments.Footnote 22
- Climate change and weather hazards: Temperature changes, extreme weather events, permafrost degradation, and sea level rise all have implications for the integrity of the rail system. For example, extreme heat and changes to permafrost can affect track stability.Footnote 23
- Worker fatigue: A key issue for railway workers is fatigue. Fatigue can significantly affect performance and wellbeing, and management of this can be challenging due to unpredictable shift times, rotating shifts, and long hours of work.Footnote 24 TC approved new Duty/Rest Rules for Railway Operating Employees in 2020 and is continuing work on how to improve fatigue management.
- Public behaviour: The behaviour of pedestrians, drivers, and cyclists and considerations of human processing and decision-making time can factor into accidents at grade crossings or along the track.Footnote 25
This is reflected in the occurrence data collected by the TSB (Figure 21). Reportable accidents and incidents are frequently due to human factors in train operations (e.g., failure to comply with restricted speed, failure to stop, switch improperly aligned, employee fatigue, etc.) or miscellaneous causes such as environmental conditions (e.g., snow, ice, mud), driver behaviour at grade crossings, and trespassers.
Long description
This stacked column chart shows the proportion of reportable occurrences by cause type from 2015 to 2021. In each year, two causes types make up the greatest proportion: “train operation-human factor” and “miscellaneous causes not otherwise listed”. The latter category includes environmental or weather conditions, trespassing, and grade crossings.
In 2015, approximately 7% of occurrences were due to mechanical and electrical failures, 32% to miscellaneous causes, 1% to signal and communication, 17% to track, road, and structures, 43% to train operation-human factors, and 1% had missing or no data.
In 2016, approximately 7% of occurrences were due to mechanical and electrical failures, 35% to miscellaneous causes, 1% to signal and communication, 16% to track, road, and structures, 40% to train operation-human factors, and 1% had missing or no data.
In 2017, approximately 8% of occurrences were due to mechanical and electrical failures, 31% to miscellaneous causes, less than 1% to signal and communication, 15% to track, road, and structures, 44% to train operation-human factors, and 1% had missing or no data.
In 2018, approximately 6% of occurrences were due to mechanical and electrical failures, 33% to miscellaneous causes, less than 1% to signal and communication, 15% to track, road, and structures, 43% to train operation-human factors, and 2% had missing or no data.
In 2019, approximately 7% of occurrences were due to mechanical and electrical failures, 37% to miscellaneous causes, less than 1% to signal and communication, 14% to track, road, and structures, 40% to train operation-human factors, and 1% had missing or no data.
In 2020, approximately 7% of occurrences were due to mechanical and electrical failures, 34% to miscellaneous causes, less than 1% to signal and communication, 14% to track, road, and structures, 42% to train operation-human factors, and 2% had missing or no data.
In 2021, approximately 10% of occurrences were due to mechanical and electrical failures, 36% to miscellaneous causes, less than 1% to signal and communication, 11% to track, road, and structures, 33% to train operation-human factors, and 11% had missing or no data.Human factors and organizational culture are difficult to manage through traditional prescriptive regulation. However, these can be tracked and improved under a company's SMS. SMS can move beyond a compliance-focused approach to safety by focusing on performance and encouraging a culture that promotes safe behaviour. SMS also seeks out the root cause of incidents and can enable a company to address systemic issues.
Observation: 2022 is a year of transition in terms of how Rail Safety will be assessing the effectiveness of railway companies' SMS.
TC has requirements in place under the 2015 Railway SMS Regulations for railway companies to have SMS. Rail safety audits since implementation have focused on ensuring compliance, confirming companies have an SMS in place with all required processes and procedures. However, compliance with these regulatory requirements does not guarantee that the SMS is effective. While a company may have processes in place, Rail Safety's auditors need to be able to determine if those processes are being used and achieving their intended objectives in practice. Previous assessments of Rail Safety, including the 2018 Railway Safety Act Review and the recent 2021 Follow-up Audit on Rail Safety by the OAG, have indicated the need for TC to assess the effectiveness of SMS.
Work on this was begun by Rail Safety Oversight in 2020. This has involved establishing a framework and supporting methodology for measuring SMS effectiveness. Rail Safety developed an assessment tool for auditors which defines effectiveness for each SMS process and provides suggestions on questions to ask, documents to request, and potential indicators of effectiveness.Footnote 26 An ineffective process is noted as a deficiency, not a non-compliance to regulation as 'effectiveness' is not part of the regulations.
This work has been concurrent with the evaluation, with effectiveness audits beginning in 2022 and so the evaluation could not fully assess the contributions of SMS audits to safety outcomes. However, the evaluation team notes the following:
- A gap analysis of SMS and Security Management Systems (SeMS) undertaken by TC's Multimodal and Road Safety Programs Directorate found that Rail Safety has a strong regulatory framework in place for SMS.
-
Rail Safety Oversight's SMS audits are evolving. As noted above, there is a shift toward assessing effectiveness. Several auditors (n=4) noted that having the criteria and assessment tool for effectiveness will be helpful. There is also a focus on targeted audits to address key concerns.
According to interviews, however, despite progress there are some ongoing challenges in terms of tools (i.e., RSIG and TeamMate) and a perceived lack of understanding in industry and among auditors of the role of SMS. Two external stakeholders also indicated that, to better support an attitude of continuous improvement, Rail Safety Oversight should encourage ambitious targets within an SMS, even if companies sometimes fail to meet those internal targets.
-
Functional groups (i.e., track, equipment, crossings, signals, operations) and SMS are separate in Rail Safety Oversight's structure. Auditors and functional inspectors conduct their oversight separately and are not able to cross into other areas during the course of their oversight activities. This is different than the structure within TC's Civil Aviation, where inspectors are delegated to look at SMS as well.
Many interviewees (n=9) noted this separation as a challenge for information-sharing, collaboration, and identifying and addressing systemic issues. This appears to vary by region, as some interviewees noted good communication and collaboration between their local teams due to operating in shared spaces and working closely together (n=4), good leadership (n=5), and involvement in audits (n=3).
While these silos were emphasized, interviews also found that collaboration and information-sharing between SMS and functional groups has been increasing. For instance, all Rail Safety staff are invited to audit debriefs, and the Program's RBBP process has been updated recently to include SMS staff in the planning process for functional areas. As noted, targeted audits were also highlighted as a step forward, as inspectors are able to participate and provide input on key issues.
2.1.3 Conclusion
The OAG's 2021 Follow-up Audit on Rail Safety observed that TC is not measuring the overall effectiveness of its oversight activities, that is, its impacts on compliance and safety in the rail industry. Based on our quantitative analyses, we are able to say that there is evidence suggesting Rail Safety's risk-based inspections are achieving their goals, enabling Rail Safety to identify higher risk non-compliances and thus positioning themselves to address more risk in the rail system. We also see a relationship between increased regulatory compulsion and decreasing incidents. In addition, we suggest that tracking risk scores could be a measure of safety over time.
However, there are significant methodological challenges in trying to quantify the direct influence of oversight in the context of various other factors which also affect compliance and safety.
With this in mind, we sought to understand whether other rail regulators around the world have been able to overcome these methodological barriers and measure the impacts of oversight. Ultimately, we found that TC is not alone in this challenge. The results of this line of inquiry of our evaluation are discussed below.
2.2 Other countries
The evaluation team conducted extensive research of select other jurisdictions' experiences and best practices, with particular emphasis on measuring the effectiveness and demonstrating the impact of their oversight activities on rail safety. The aim was to situate TC in comparison to other rail regulators. Based on comparability of operating context and regulatory environment, we selected rail regulators in three countries for examination:
- Federal Railroad Administration (FRA) - USA
- Department for Transport (DfT) and the Office for Rail and Road (ORR) - United Kingdom
- Office of the National Rail Safety Regulator (ONRSR) - Australia
Finding: Directly measuring the extent to which oversight activities contribute to safety outcomes is a shared challenge among key regulators around the world; we did not identify a jurisdiction that is ahead of Transport Canada in tackling this challenge.
Like TC, other regulators track compliance and report on metrics such as accidents, injuries, and fatalities to assess safety trends and progress over time. For example:
- The FRA publicly shares data on train accidents, casualties, grade crossing incidents, and trespassing incidents. Internally, the organization has modelled risk, considered accident severity, and looked at economic impact analysis for each rule.
- The ORR publishes an annual health and safety report highlighting performance through modelled risk and measures of actual harm (i.e., fatalities and injuries) as well as through their Risk Management Maturity Model (RM3) which assesses railways' ability to manage risk and safety.
- The ONRSR publishes data on key rail occurrences such as fatalities, serious injuries, collisions, derailments, crossing incidents, and signals passed at danger, as well as releasing an annual Rail Safety Report highlighting these and other key statistics on national priorities.
As in Canada, while these regulators might show progress in identified risk areas and trends in safety metrics, they are faced with the same challenge of attribution, that is, being able to directly correlate these results with their oversight efforts specifically. As discussed previously in this report, this is in large part due to the number of variables that also influence safety outcomes, and in part to time lag associated with implementing rules and oversight priorities.
That said, TC can learn from other jurisdictions in a number of ways, particularly in terms of data analytics, risk assessment and modelling, and safety management systems.
2.2.1 USA: Federal railroad administration
The USA has three types of rail operations – intercity passenger, commuter, and freight. Over 760 railroads are regulated by the Federal Railroad Administration (FRA), which is responsible for ensuring safe and efficient train operations. This involves over 400 inspectors across six disciplines, i.e., grade crossings, hazardous materials, motive power and equipment, operating practices, signal and track control, and track. In addition to inspections, the FRA develops rules and standards, undertakes investigations, and collaborates with stakeholders.
In assessing oversight effectiveness, FRA representatives indicated that in addition to looking at data on accident, injury, and fatality rates, they have investigated various data trends, including considering occurrence data in relation to inspections by discipline, implementation of rules, and severity of accidents as measured by costs.
The FRA is placing increased emphasis on data quality and analytical capacity. Representatives from the organization highlighted a focus on analytics capacity, risk, and system safety by dedicating resources to data analysis, improving data quality, and modelling risk. Examples of these efforts include:
- A structural reorganization in 2021 moved inspectors and specialists under the authority of directors for each functional area in headquarters, as opposed to regionally. In addition to enabling a more systems-oriented approach, this reorganization is intended to improve consistency in how inspectors conduct and report on inspections, thereby enhancing the quality of the data collected.
- The FRA is also working to hold industry to a higher standard of data quality in their reporting. Previous practice consisted of randomly selecting accident reports and flagging any inconsistencies between cause codes and supporting information. Now, subject matter experts review the majority of the reports and address inconsistencies accordingly.
- Data scientists are working on building risk models and helping to focus inspection efforts on highest risk areas. In January 2022, the evaluation team participated in a demonstration of the FRA's risk model, implemented in 2021. The model at the time accounted for compliance and defect rates, accident and incident data, train miles, tonnage, and related data. The aim is to collect data on operational changes within a railway, types of goods, and yard activity, and integrate this information along with inspection history into the risk calculations.
For TC, interview evidence suggests that data quality, consistency, and timeliness is also an ongoing challenge. The Department could, like the FRA, take steps to prioritize data quality to enable more accurate and reliable reporting and risk analysis. In addition, just as the FRA is working to collect data on additional factors to account for in their risk modelling, future analyses by TC on risk and oversight effectiveness would be improved through accounting for other variables.
2.2.2 UK: Office for rail and road
In the UK, the Department for Transport (DfT) is the government department responsible for the legislative and regulatory framework for rail safety, and the Office for Rail and Road (ORR) is the non-ministerial government body responsible for the direct oversight of rail operators (i.e., the rail regulator). Railway legislation applies to the mainline and non-mainline railways, metros (including London Underground), tramways, light rail, and heritage railways. The ORR undertakes inspections and audits, gathers and analyzes data for a risk-based approach, responds to safety incidents, and uses enforcement actions where necessary. In looking at effectiveness, the DfT and ORR consider post-implementation reviews of regulations, key statistics on occurrences and risk, and stakeholder outreach and feedback. The DfT also determines effectiveness by analyzing safety outcomes contained in the annual safety reports of the ORR and the Rail Safety and Standards Board (RSSB). This can then affect strategic focus and direction.
To inform priorities and plans, the ORR assesses risk using a number of data sources, including accident and incident data, investigation findings, and findings from oversight activities, as well as the Safety Management Intelligence System (SMIS) and the Safety Risk Model (SRM), tools developed and hosted by the RSSB. The SMIS provides risk information for individual operators and for industry. This information is used by both industry and the ORR for improvements and addressing key issues. A variety of factors are considered where possible, such as workforce statistics, climate change, and human factors such as fatigue.
Importantly, the ORR also focuses on SMS and has developed in collaboration with industry the Risk Management Maturity model (RM3) to assess the maturity of an SMS. The model assesses 26 criteria on a scale of 1 to 5 in terms of maturity level. This tool allows the ORR to assess a railway's ability to manage risk. This tool is also accessible to railway operators to self-assess the maturity of their SMS.
The evaluation observes that these key tools are accessible by both industry and the regulator, which means that all stakeholders can assess risks based on the same information. This can support shared expectations and understandings between regulator and industry. In addition, the RM3 tool for assessing SMS maturity outlines clear criteria which industry stakeholders can refer to.
2.2.3 Australia: Office of the national rail safety regulator
Australia's Office of the National Rail Safety Regulator (ONRSR) is responsible for accreditation of industry, education and awareness for individual operators and industry-wide, monitoring to assess implementation and performance of SMS, and enforcement. The regulatory framework is performance-based, and the ONRSR places a strong focus on SMS. Rail Safety Officers (inspectors) are generalists with knowledge across a broad range of topics, and there is a division of technical experts (e.g., signalling engineers, rolling stock engineers, human factors specialists) available to work on audits, inspections, and investigations as needed.
To assess effectiveness, ONRSR tracks data such as accidents and incidents and looks for changes in risk areas where oversight has been focused. In addition, the regulator is currently working to gather and assess qualitative evidence of the impacts of oversight, such as stories on whether and which changes have occurred following oversight actions.
As noted, the ONRSR focuses on SMS and performance-based regulation: all operators are required to have an SMS in place to receive and maintain accreditation. Representatives from the ONRSR noted that while originally the focus was accreditation and determining whether the required systems are in place, this has evolved to also considering whether risks are being managed through the system. To assess the performance of an individual operator's SMS, Rail Safety Officers balance the expectations outlined in the regulations and SMS guidance material with an operator's specific context. An internal SMS tool was developed to standardize the approach to assessing SMS. This guide defines the elements of an SMS and provides examples of compliance and the types of evidence that may be considered.
In terms of planning oversight activities, the ONRSR takes a risk-based approach, specifically applying an Analytical Hierarchy Process (AHP) to identifying key risks in the industry as well as a risk calculation to determine risk levels of individual operators. To identify national priorities, an assessment process is undertaken every two years with issues identified from a variety of sources (e.g., audits, investigations, operator reports, industry consultation). The AHP involves pairwise comparisons to establish the relative importance of specified risk criteria and identified issues to then determine risk rankings. For individual operator plans, an operator risk profiling tool considers compliance history, safety performance, and inherent and dynamic risk scores to determine relative risk scores for operators. This aids with determining level of oversight required.
These approaches can potentially inform future refinements of TC's newly developed tools for assessing SMS effectiveness and of the RBBP process.
2.2.4 Conclusion
Overall, we found that other countries use similar metrics for rail oversight, including compliance rates and accident and incident data, but have not directly measured the effect of oversight on these outcomes. The question of quantifying contribution is a shared challenge.
That said, we do note that TC can learn from other regulators in several ways, including FRA's increasing focus on data analytics, ONRSR's enhanced risk assessment and planning process, and ORR's use of risk data and an SMS maturity model.
3. Conclusions and recommendations
Our evaluation found that quantifying the contribution of oversight activities to compliance and safety outcomes in the rail transportation system is challenging and limited by currently available data and understandings of other factors which also contribute to these outcomes. This is a shared challenge amongst leading rail regulators around the world.
With available evidence, we are able to state the following:
- In recent years, risk-based inspections outperform random inspections in their ability to identify high-risk non-compliances. However, current models cannot prove these results are directly due to Rail Safety's efforts and not the product of chance.
- There is a relationship between increases in regulatory compulsion and reductions in incidents. The same relationship was not seen with accidents. Future analyses on this topic could be expanded to include rules.
- The average relative risk score per inspection for the Track functional group increased between 2016 and 2018, and has been decreasing since 2018. There are currently insufficient years of data to determine if this is a trend. Tracking risk over time could be an additional measure of safety.
Based on the evaluation findings and observations, we recommend:
Recommendation 1:
To enable the creation of appropriate metrics, Rail Safety should internally define "oversight effectiveness" and the ways by which its oversight activities contribute to this.
It is important to have a clear understanding of effectiveness to know whether Rail Safety is achieving its intended objectives and making a difference to the rail transportation system. In stating that TC did not measure the effectiveness of its oversight activities, the OAG identified two features of "effectiveness": (1) improvements in rail safety and (2) impacts on compliance. The evaluation applied this definition when assessing the impacts of Rail Safety's oversight. Moving forward, Rail Safety should decide what "effective oversight" means to them in order to create meaningful metrics.
Should the definitions and related analyses used in this evaluation resonate with Rail Safety, the Program could potentially build on this work.
Typical measures of safety – i.e., accident, incident, injury, and fatality rates – do not address the issue of attribution - the impact of oversight activities on those outcomes. If "oversight effectiveness" is defined as improvements in safety, metrics must account for the role oversight plays in preventing occurrences. One analysis in this evaluation explored the link between regulations and occurrences, assuming that oversight is an intermediary in that relationship. If Rail Safety includes improvements in safety in its definition of effective oversight, the analysis included in this evaluation could be expanded by examining the impact of rules, in addition to regulations, on occurrences.
Similarly, tracking compliance rates alone does not measure the impact of oversight on those compliance rates: other factors can affect whether a company complies. We assumed that by focusing on compliance to rules and regulations which target safety issues, Rail Safety is aiming to reduce the risk of an occurrence. The evaluation considered risk reductions and accurately targeting risky non-compliances as signs of oversight effectiveness. If Rail Safety includes risk targeting and reduction in its definition of "effectiveness", the Program could consider expanding on the Track case study presented in this evaluation by developing risk models for non-compliances relevant to the other functional groups.
Recommendation 2:
Rail Safety should consider expanding data collection to account for variables other than oversight that can impact intended outcomes. This would ensure relevant and good quality data is available for future quantitative analysis of oversight effectiveness.
Once Rail Safety has defined "effectiveness", data required for accurate measurement will need to be identified. As noted, more data points and years of data will be needed to build on the statistical analyses conducted for this evaluation. Beyond this, enhancing data collection and ensuring its consistency will enable Rail Safety to better delineate and account for different contributing factors in compliance and safety.
Currently available data include occurrence data, non-compliance rates, inspection details, corrective action status, complaints and inquiries, notice and orders, and information on Administrative Monetary Penalties (AMPs). This information feeds into planning by functional area, individual company profiles, and issues identification.
In conducting this evaluation, some data that would strengthen our statistical analyses were not available.
The risk score analysis would be enhanced with data such as:
- Additional factors that may affect the likelihood or severity of an occurrence, such as population density along rail lines;
- List of which rules or regulations are intended to have an effect on which types of occurrences, in order to directly link non-compliance data with occurrence risks;
- Information to enhance company profiles, such as changes in management or operations, financial capacity, and compliance history, in order to account for risk associated with particular types of operations and changes; and
- Further information on confounding variables to allow for more detailed statistical models.
The analysis of the relationship between regulatory compulsion and occurrences could be expanded by extracting data on rules similar to that extracted from regulations using the Regulatory Evaluation Platform.
We note the inherent challenges with collecting data on some of these variables, particularly company-specific information. For some variables, alternatives or proxies could potentially be identified. For instance, rather than details on the financial capacity of a company, railways may be grouped on available data such as tonnage, profits, or quantity of equipment.
In addition, while some data is collected and managed by the Department, other data is owned by other parties (e.g., occurrence data is tracked and managed by TSB). Nevertheless, Rail Safety can improve its internal data. Interview evidence noted ongoing challenges with RSIG, such as complexity, lack of data fields for things such as exemptions to rules, and issues with data quality. Ensuring that inspections are conducted consistently and data is entered accurately will enhance the reliability of future analyses undertaken by Rail Safety.
The accessibility and usability of data for Rail Safety staff is also an important consideration. Data sharing between SMS and functional groups will strengthen collaboration and better integrate these areas. Additional training for RSIG and data analysis overall may also ensure inspectors and auditors are able to draw from available data for planning and decision-making.
Appendix A: Methods and limitations
To measure performance, Rail Safety Oversight tracks rates of non-compliances, accidents, incidents, fatalities, and serious injuries. While these are measures of key outcomes, they do not assess the impact of oversight on these outcomes. The evaluation set out to determine the extent to which inspections and audits contribute to compliance, risk, and safety, and whether these contributions can be quantified and measured with currently available data.
To select statistical methods, an informal working group was created with members of the evaluation team, consultants from Risk Sciences International (RSI), a representative from TC's Multimodal Analytics team, and a statistician to discuss potential options and limitations. This included conversations about causality, defining 'safety' and 'effectiveness', and types of data needed for different analyses.
Two approaches were identified:
- Using risk as a measure of safety and investigating whether risk-based inspections are more effective than random inspections at targeting high-risk non-compliances
- Assessing the relationship between regulation and occurrences to gain high-level insight into Rail Safety's role in safety outcomes
These methods are outlined below.
Statistical analysis of inspections from the track functional group
Purpose
This analysis aimed to assess the performance of Track's risk-based inspections in comparison to random inspections. The Track group was selected for the analysis due to the availability of data and subject matter experts to participate in a case study.
Two questions were explored:
- Do Track's risk-based inspections identify higher risk locations and find a greater number of high-risk non-compliances than random inspections?
- What is the overall change in the number and severity of non-compliances identified through inspection activities over time?
Rationale and assumptions
This analysis is based on the understanding that every non-compliance may pose a risk, but the magnitude of that risk will vary from one non-compliance to another. Each non-compliance can be assigned a relative risk score that represents the likelihood of a particular type of occurrence, and each occurrence can be assigned a relative risk score representing the impact. This can provide a measure of risk detected by inspections over time, as well as a picture of risk in the rail system over time.
Specific assumptions for this analysis are:
- Identifying and addressing higher risk non-compliances leads to greater risk reduction in the rail system. If a comparison of Component A and B inspection results indicates that Component B is identifying a greater number of high-risk non-compliances, this would suggest that Track's risk algorithm is succeeding in identifying higher-risk locations, enabling it to address more critical non-compliances, thus reducing more of the risk in the rail system. This can be described as Component B "outperforming" Component A inspections.
- Compliance with key regulations reduces risk and leads to increased safety. As such, in this analysis, we take it to be true that fewer high-risk non-compliances and a lower overall risk score over time is indicative of an increase in Track safety.
Methods
Risk scores for non-compliances were developed through consensus-based expert elicitation. Three experts from Track participated in three workshops with Evaluation & Advisory Services and Risk Sciences International (RSI) to estimate the relative risk associated with each critical ruleFootnote 27 and accident type relevant to the Track group (i.e., main-track derailments and non-main-track derailments). Experts estimated the relative likelihood that a non-compliance with a given critical rule could cause a derailment.
The analysis also accounted for volume of goods (gross tonnes) that transit the segment on which the non-compliance was found.
Two denominators were used to normalize the data for Track: track miles inspected (TMI) and inspections.
These data were then statistically analyzed and compared to determine whether risk-based inspections have outperformed random inspections, and to explore risk levels over time.
Given the limited data in terms of years, a second analysis was done of inspection data within one year (2019). Comparing risk-based and random inspections at the inspection level provided more data points and thus more statistical power. This was a multivariate regression analysis. Controls were region, month, type of inspection, number of track miles inspected, and indirectly all of the factors included in the algorithm used to select and plan risk-based inspections. The analysis was done twice: the first looked at the number of non-compliances found per inspection and the second considered the risk score of each inspection.
Limitations
- There were relatively few years of consistent inspection data available for this analysis, given the changes to risk-based planning and the implementation of RSIG in 2015.
- Only critical non-compliances were included in this analysis. These non-compliances pose a higher risk, but it is possible that a larger amount of other non-compliances combined could pose a higher risk than a few critical non-compliances.
- This analysis was a case study of one functional group. Results from other functional groups could vary.
- The risk scores were determined through consensus-based expert elicitation with three inspectors. However, other Track inspectors could disagree with the assigned scores.
- The interpretation of this model assumes that once non-compliances are identified, they are subsequently corrected appropriately and thus risk is reduced.
- The 2019 regression could not account for all confounding variables with the available data.
Measuring the relationship between rail safety and regulations
Purpose
This analysis, conducted by TC's Multimodal Analytics teamFootnote 28, examined whether Rail Safety's regulatory regime can be connected to the overall safety of the rail transportation system in Canada. It was an analysis of the relationship between changes in regulation and trends in rail accidents and incidents over time.
Rationale and assumptions
The link between compliance and safety relies on the assumption that the regulations being complied with have an effect on safety. This analysis looked broadly at this assumption to explore whether there is a relationship between regulations and occurrences.
Methods
Change in regulation was measured through TC's Regulatory Evaluation Platform (REP), which uses machine learning algorithms and natural language processing techniques to derive data from the Department of Justice's Laws and Regulations Portal, identifying specific words (e.g., must, shall) indicating regulatory compulsion in regulations related to rail safety.
Occurrence data was obtained from the Transportation Safety Board's (TSB) Rail Occurrence Database System (RODS). Occurrences were broken into two categories, accidents and incidents, and relationships were evaluated separately.
To account for variation in activity levels, data on freight traffic was obtained from Statistics Canada and used as a denominator for calculating occurrence rates.
Data transformation and statistical tests included:
- Seasonal adjustment, to remove seasonal influences;
- Using a smoothing spline technique, to remove volatility and show trends in changes;
- Lagging the data, to see the impacts of regulations being implemented in one year or another;
- Spearman's Correlation, to measure the strength of statistical relationships; and
- Break point testing, to assess breaks or big changes in time series.
Limitations
- The analysis covers freight but not passenger rail. Passenger rail accounts for a small share of Canada's total rail activity and it is difficult to obtain information on the total level of activity for passenger rail.
- Rules, which are another large part of Rail Safety's regulatory regime, could not be included in this analysis.
- The analysis cannot speak to contribution, but rather correlation.
Appendix B: Supporting tables for statistical analyses
| Measure (Component B – Component A) |
Mean | Standard Deviation | Lower Bound (2.5%) | Upper Bound (97.5%) |
|---|---|---|---|---|
| Count per TMI | 0.007 | 0.010 | -0.013 | 0.026 |
| Count per Inspection | 0.476 | 0.410 | -0.327 | 1.278 |
| Relative Risk per TMI | 17 | 31 | -43 | 78 |
| Relative Risk per Inspection | 1,413 | 1,272 | -1,079 | 3,906 |
| Relative Risk x Volume per TMI | -146,458 | 1,739,860 | -3,556,521 | 3,263,605 |
| Variable | Estimate | Std. Error | Pr(>|t|) |
|---|---|---|---|
| Component B | 2.12972 | 1.78424 | 0.233337 |
| Miles Inspected | 0.08399 | 0.01782 | 3.37e-06*** |
| Component C | -0.83807 | 2.02766 | 0.679595 |
| February | -13.39436 | 3.90012 | 0.000657*** |
| March | -11.97438 | 4.32052 | 0.005843** |
| April | -9.89541 | 3.83184 | 0.010169* |
| May | -10.39558 | 3.57557 | 0.003850** |
| June | -5.57236 | 3.73830 | 0.136860 |
| July | -6.11534 | 3.79639 | 0.108013 |
| August | -9.71890 | 3.93145 | 0.013852* |
| September | -11.21812 | 3.96779 | 0.004932** |
| October | -9.92603 | 3.58502 | 0.005892** |
| November | -10.83189 | 3.87693 | 0.005460** |
| December | -12.47291 | 4.56895 | 0.006617** |
| PAC | 5.02009 | 1.99759 | 0.012365* |
| PNR | 3.09128 | 1.81512 | 0.089339 |
| QUE | 5.19354 | 2.04136 | 0.011333* |
| ATL | -1.59558 | 2.62368 | 0.543440 |
| Intercept | 8.28736 | 3.79110 | 0.029400* |
Multiple R-squared: 0.1757
Adjusted R-squared: 0.1383
| Variable | Estimate | Std. Error | Pr(>|t|) |
|---|---|---|---|
| Component B | 12.2425 | 22.7093 | 0.539 |
| Miles Inspected | 0.9159 | 0.2268 | 6.45e-05*** |
| Component C | 3.6367 | 25.8075 | 0.888 |
| February | -46.7457 | 49.6397 | 0.347 |
| March | -51.9724 | 54.9904 | 0.347 |
| April | -51.9724 | 54.9904 | 0.345 |
| May | -20.3851 | 48.7706 | 0.676 |
| June | 45.5671 | 47.5801 | 0.339 |
| July | -11.4583 | 48.3194 | 0.813 |
| August | -21.2562 | 50.0384 | 0.671 |
| September | -24.8255 | 50.5010 | 0.623 |
| October | -12.9929 | 45.6292 | 0.776 |
| November | -23.0830 | 49.3446 | 0.640 |
| December | -40.8585 | 58.1523 | 0.483 |
| PAC | 20.0378 | 25.4248 | 0.431 |
| PNR | 31.5119 | 23.1024 | 0.173 |
| QUE | 11.2862 | 25.9819 | 0.664 |
| ATL | -12.0533 | 33.3935 | 0.718 |
| Intercept | -0.2331 | 48.2521 | 0.996 |
Multiple R-squared: 0.09521
Adjusted R-squared: 0.05408
Appendix C: Management response and action plan
This Management Response and Action Plan (MRAP) addresses the recommendations of the evaluation with proposed actions, forecasted completion dates, and the Office of Primary Responsibility (OPI).
| Recommendations | Proposed Actions | Forecast Completion Date | OPI |
|---|---|---|---|
|
Recommendation 1: To enable the creation of appropriate metrics, Rail Safety should internally define "oversight effectiveness" and the ways by which its oversight activities contribute to this. |
Rail Safety accepts this recommendation. We will work to define oversight effectiveness and the activities that contribute to advancing this goal. | ADM, Safety and Security | |
| Rail Safety will develop a list of oversight effectiveness indicators to be considered for further development and implementation. The draft proposal will go to Program Business Committee (PBC) in March 2023. It will identify the data that is needed to support the definition. | March 31, 2023 | ||
| Final approval of the indicators will be requested by the PBC in June 2023. The indicators will be adjusted over time as needed. | June 2023 | ||
|
Recommendation 2: Rail Safety should consider expanding data collection to account for variables other than oversight that can impact intended outcomes. This would ensure relevant and good quality data is available for future quantitative analysis of oversight effectiveness. |
We will be assessing the various sources of our data (how it comes in, its timeliness, etc.), and the methods in which they are collected (reportable criteria), with the objective of improving the data available for use. | October 2023 | ADM, Safety and Security |
| In addition, we have received funding for dedicated staff in each of the regions to ensure data quality of our oversight data to promote enhanced quantitative analysis and oversight effectiveness. The staff are being trained now and we expect that the review of data quality will be complete by December 2023. | December 2023 | ||
| Once Rail Safety has approved the definition of oversight effectiveness, we will proceed to start collecting the data that will allow us to monitor that effectiveness by April 2024. We will build this data over time and review it on a semi-annual basis to determine the program effectiveness. | April 2024 | ||
| We will work with Digital Services to have data from all sources included in the data lake so it can be reviewed in an integrated manner and enable us to tell a more holistic oversight story. | April 2024 |

