
Description
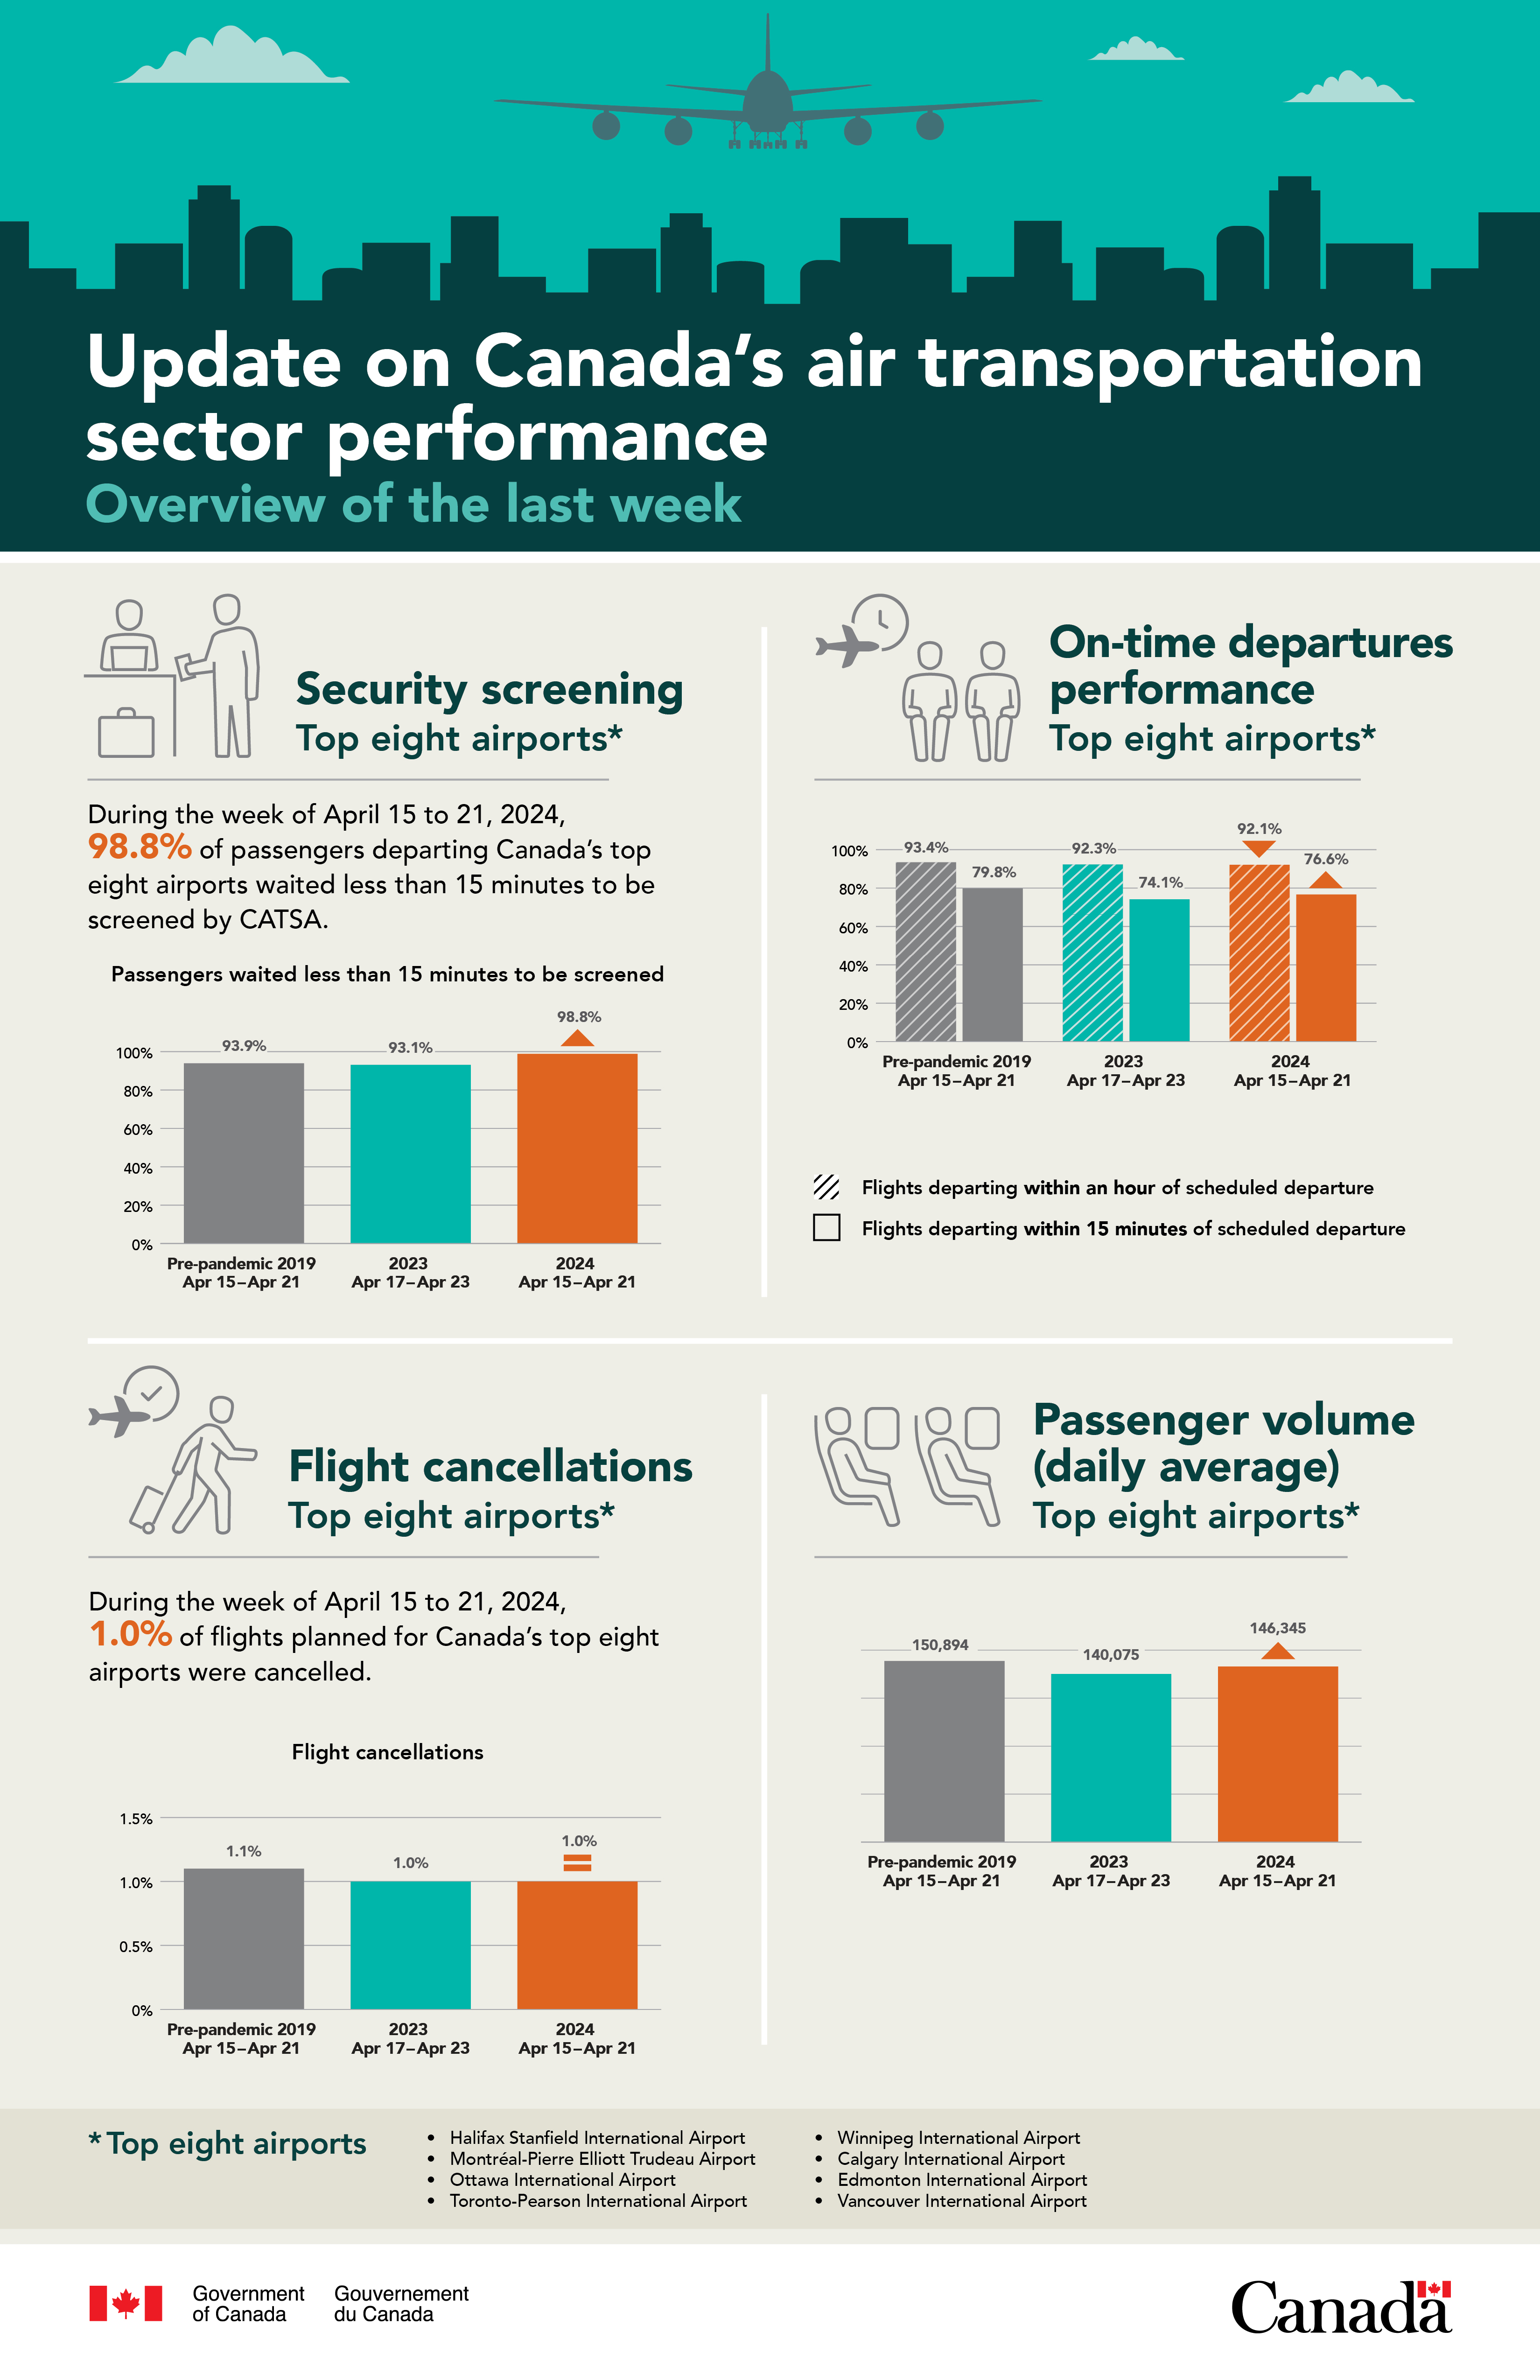
Update on Canada’s Air Transportation Sector Performance – Overview of the last week
Security screening (Top eight airports*)
During the week of April 15 to 21, 2024, 98.8% of passengers departing Canada’s top eight airports waited less than 15 minutes to be screened by CATSA.
Passengers waited less than 15 minutes to be screened
Pre-Pandemic (2019): April 15 – April 21 93.9%
2023: April 17 – April 23 93.1%
2024: April 15 – April 21 98.8%
On-time departures performance (Top eight airports*)
Flights departing within an hour of scheduled departure
Pre-Pandemic (2019): April 15 – April 21 93.4%
2023: April 17 – April 23 92.3%
2024: April 15 – April 21 92.1%
Flights departing within 15 minutes of scheduled departure
Pre-Pandemic (2019): April 15 – April 21 79.8%
2023: April 17 – April 23 74.1%
2024: April 15 – April 21 76.6%
Flight cancellations (Top eight airports*)
During the week of April 15 to 21, 2024, 1.0% of flights planned for Canada’s top eight airports were cancelled.
Pre-Pandemic (2019): April 15 – April 21 1.1%
2023: April 17 – April 23 1.0%
2024: April 15 – April 21 1.0%
Passenger volume - daily average (Top eight airports*)
Pre-Pandemic (2019): April 15 – April 21 150,894
2023: April 17 – April 23 140,075
2024: April 15 – April 21 146,345
*Top eight airports
- Halifax Stanfield International Airport
- Montréal-Pierre Elliott Trudeau Airport
- Ottawa International Airport
- Toronto-Pearson International Airport
- Winnipeg International Airport
- Calgary International Airport
- Edmonton International Airport
- Vancouver International Airport
Description
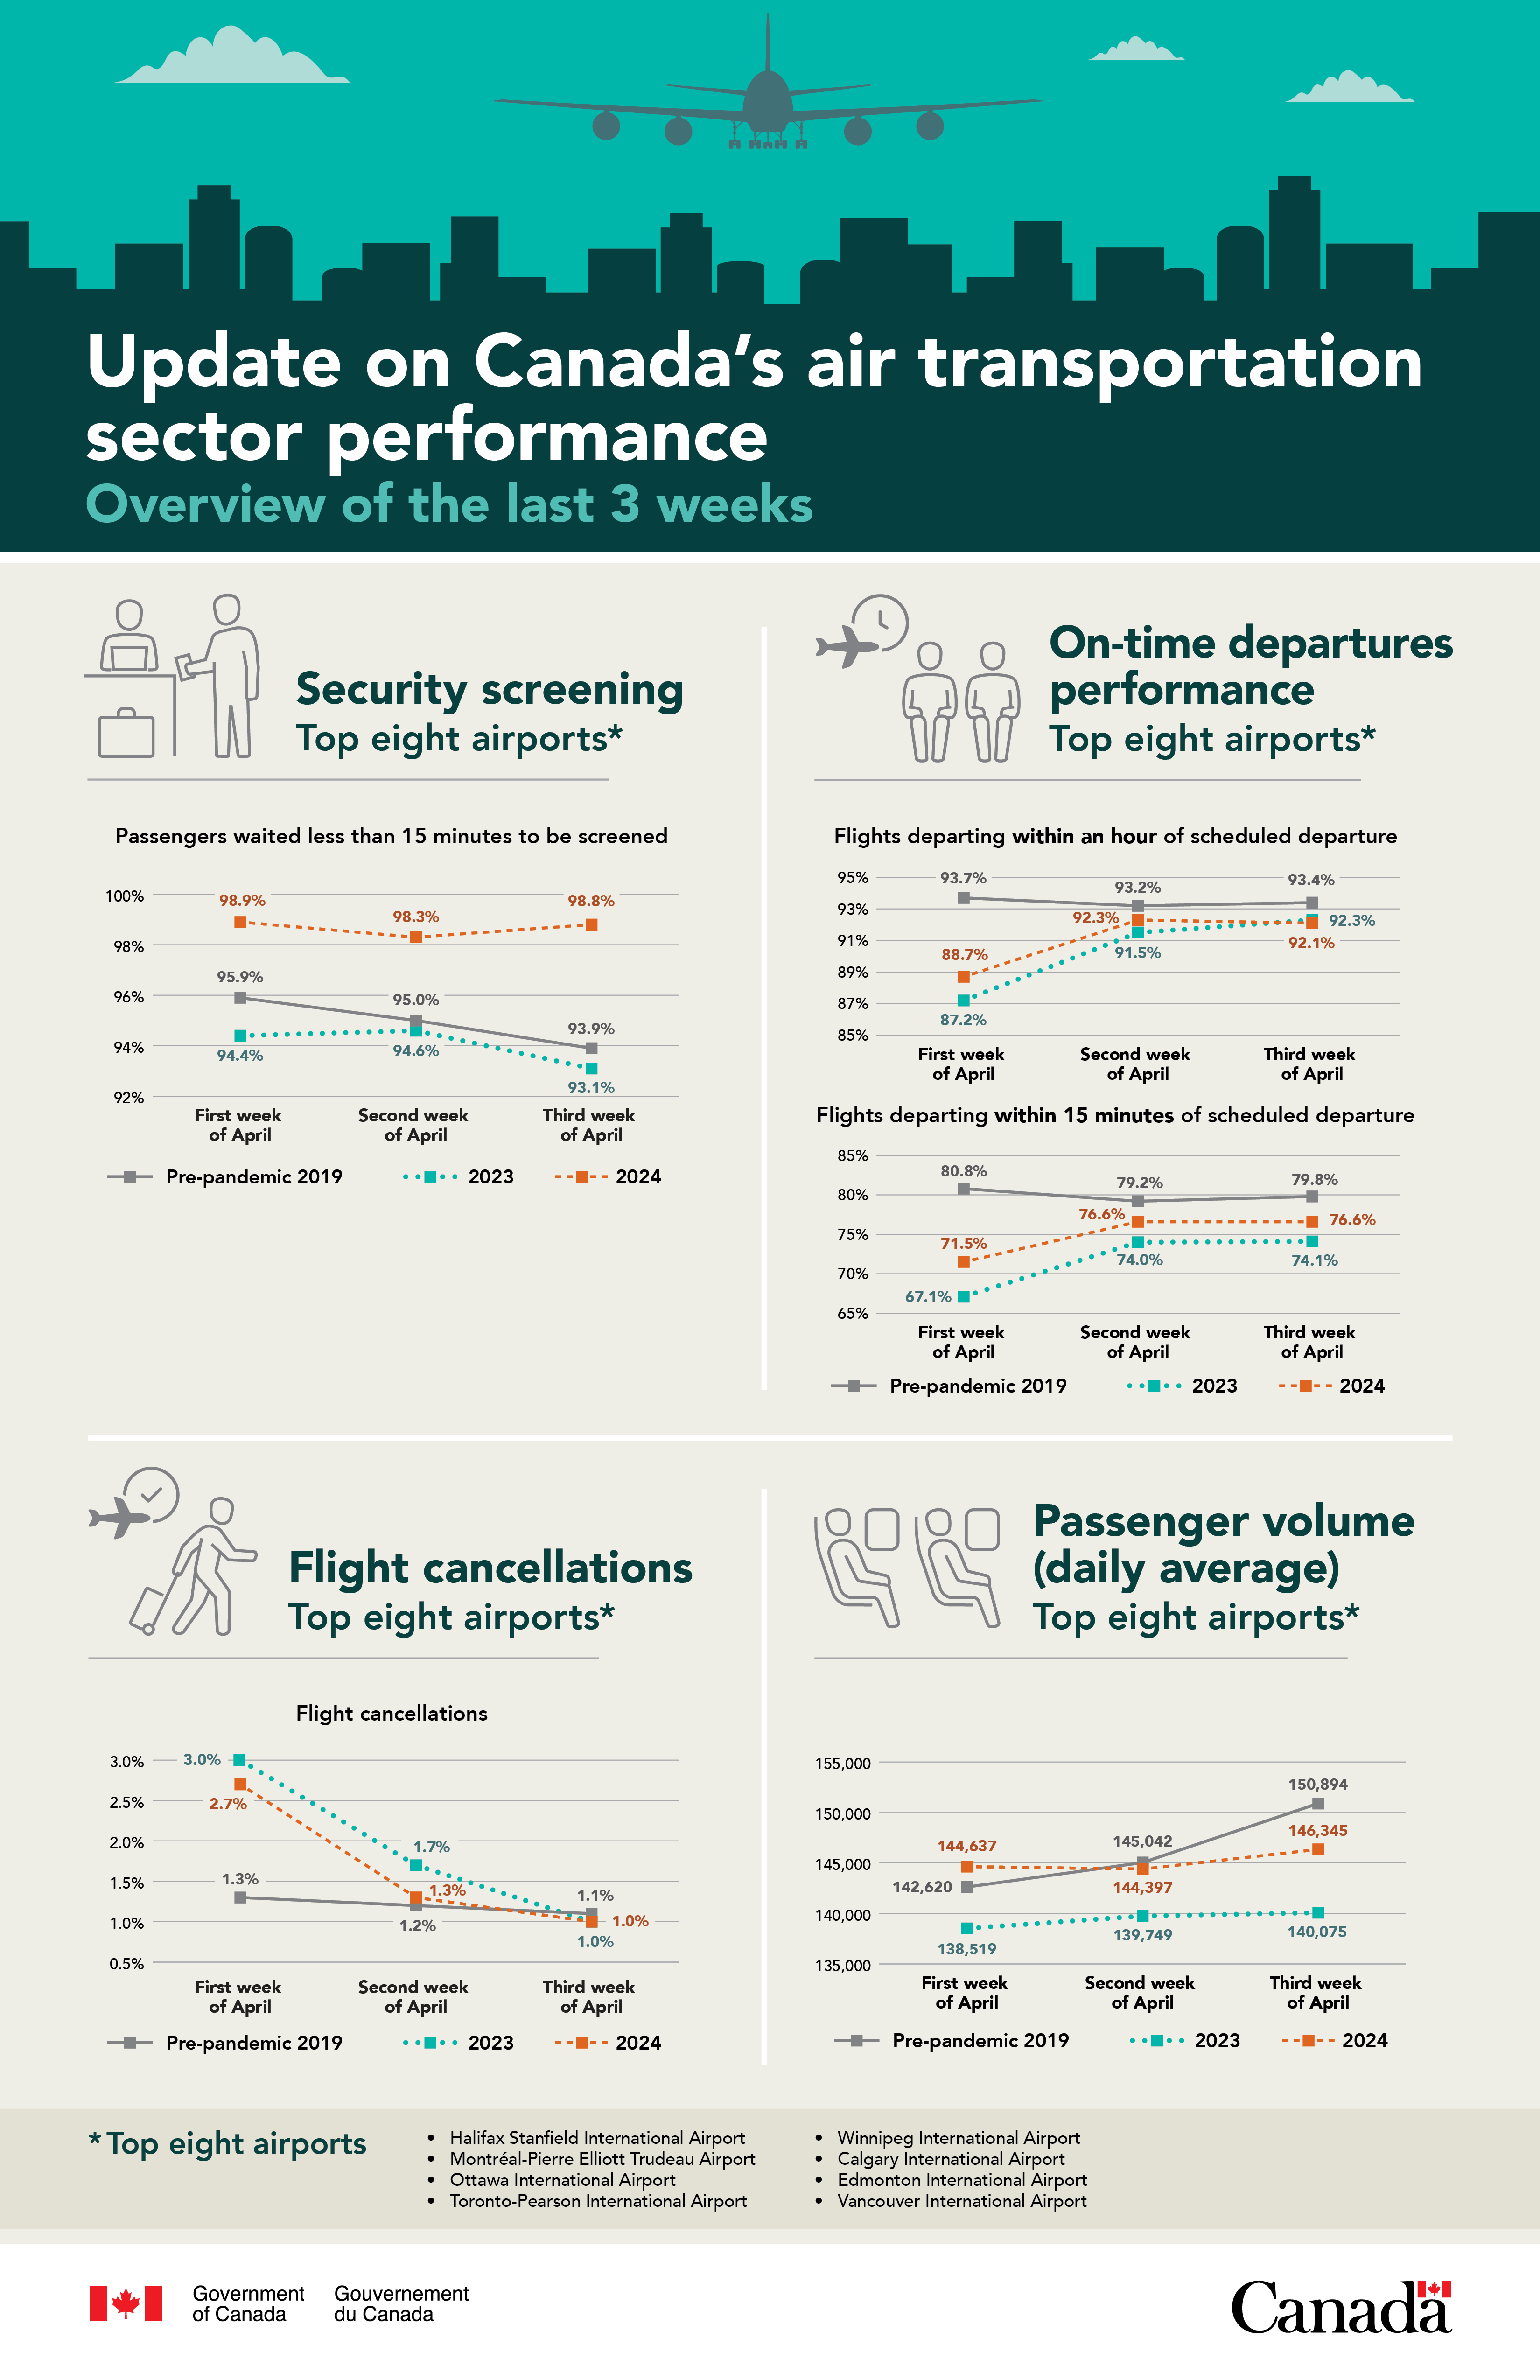
Update on Canada’s Air Transportation Sector Performance – Overview of the last 3 weeks
Security screening (Top eight airports*)
Passengers waited less than 15 minutes to be screened
|
|
Pre-Pandemic 2019 |
2023 |
2024 |
|---|---|---|---|
|
First week of April |
95.9% |
94.4% |
98.9% |
|
Second week of April |
95.0% |
94.6% |
98.3% |
|
Third week of April |
93.9% |
93.1% |
98.8% |
On-time departures performance (Top eight airports*)
Flights departing within an hour of scheduled departure
|
|
Pre-Pandemic 2019 |
2023 |
2024 |
|---|---|---|---|
|
First week of April |
93.7% |
87.2% |
88.7% |
|
Second week of April |
93.2% |
91.5% |
92.3% |
|
Third week of April |
93.4% |
92.3% |
92.1% |
Flights departing within 15 minutes of scheduled departure
|
|
Pre-Pandemic 2019 |
2023 |
2024 |
|---|---|---|---|
|
First week of April |
80.8% |
67.1% |
71.5% |
|
Second week of April |
79.2% |
74.0% |
76.6% |
|
Third week of April |
79.8% |
74.1% |
76.6% |
Flight cancellations (Top eight airports*)
|
|
Pre-Pandemic 2019 |
2023 |
2024 |
|---|---|---|---|
|
First week of April |
1.3% |
3.0% |
2.7% |
|
Second week of April |
1.2% |
1.7% |
1.3% |
|
Third week of April |
1.1% |
1.0% |
1.0% |
Passenger volume - daily average (Top eight airports*)
|
|
Pre-Pandemic 2019 |
2023 |
2024 |
|---|---|---|---|
|
First week of April |
142,620 |
138,519 |
144,637 |
|
Second week of April |
145,042 |
139,749 |
144,397 |
|
Third week of April |
150,894 |
140,075 |
146,345 |
*Top eight airports
- Halifax Stanfield International Airport
- Montréal-Pierre Elliott Trudeau Airport
- Ottawa International Airport
- Toronto-Pearson International Airport
- Winnipeg International Airport
- Calgary International Airport
- Edmonton International Airport
- Vancouver International Airport