This page contains executive summaries of transportation of dangerous goods geographic information systems (GIS) research and analysis done by the Transportation of Dangerous Goods Directorate.
On this page
- Executive summary – Transportation of dangerous goods in the Lower Mainland, BC – February 25, 2021
- Contact us
Executive summary – Transportation of dangerous goods in the Lower Mainland, BC – February 25, 2021
Key messages
- The purpose of this study, Transportation of Dangerous Goods (TDG) in the Lower Mainland, BC is to develop a portrait of dangerous goods (DG) movements in, out and through the study area. The Lower Mainland of British Columbia (the “study area”) comprises the Greater Vancouver Regional District (Metro Vancouver, with 21 municipalities) and portions of the Fraser Valley Regional District in Southwestern British Columbia (BC). As a large metropolitan area with a diversified economy and major port facilities, there DG sites located throughout the study area, including a petroleum refinery and major petroleum terminals clustered around Burnaby. All DG classes are handled within the study area.
- In 2018, there were approximately 28,000 containers carrying DGs loaded or unloaded at the Port of Vancouver (approximately 1.5% of all containers). There are also significant quantities of bulk petroleum products (Class 3 flammable liquids), chemicals (Class 8 [corrosives] and Class 3), and sulphur (Class 4.1 [flammable solids]) handled. Most DG-handling marine terminals are clustered along Burrard Inlet, with selected facilities on Roberts Bank and along the Fraser River. There are also ferry and barge operators that support inter-regional trade between the Lower Mainland and areas along the BC Coast and to Vancouver Island.
- There are significant volumes of DG intermodal (containerized) and non-intermodal (bulk) rail flows to/from the Lower Mainland.
- Based on the 2014 Metro Vancouver Truck Classification and Dangerous Goods Survey, approximately 1.9% of trucks travelling on Lower Mainland roads surveyed carried DGs. All classes of DGs were represented. Over 50% of DGs were Class 3, followed by nearly 25% of Class 2. The most important corridors by truck volume include Highway 1 (including the Port Mann and Second Narrows Bridges), Highway 91 (including the Alex Fraser Bridge), and the South Fraser Perimeter Road (Highway 17). The main truck entry points to the study area include Pacific Highway and Highway 1 at Hope.
- Vancouver International Airport is one of the largest DG generators in the Lower Mainland both in terms of air cargo as well as jet fuel (Class 3 DG) receipts. The most commonly reported DGs imported by air are lithium ion batteries and dry ice, which are categorized as Class 9 (miscellaneous substances). Dry ice is not the primary commodity being shipped, but rather used to maintain the temperature of food and other products.
Background and objective
Transport Canada’s Transportation of Dangerous Goods (TDG) Directorate’s mandate includes “protect[ing]… people from accidents and exposure to dangerous goods.” To support the TDG Directorate in carrying out its mandate, Transport Canada retained CPCS, in association with subcontractors Colledge Transportation Consulting, David Kriger Consulting Inc., and RAM Environmental Response (the “CPCS Team”), to develop a portrait of dangerous goods (DGs) moving into, out of, through and within the Lower Mainland, BC, by all modes of transport regulated by Transport Canada (air, rail, marine and road).
More precisely, the objective of this study is to collect data and information, analyze, and comprehensively describe the trends and patterns regarding the transportation of DGs by all modes (i.e. road, rail, air, marine) that move in, out and throughout the Study Area. This includes local shipments, intra-provincial shipments, transportation between the region and the provinces, import and export between Canada and the US, and international trade between Canada and the rest of the world. The five corridors of interest are:
- Marine Gateway – International trade. All shipments that enter or exit the region via marine ports and international trade, which may then be transferred to road, rail or marine for further transportation.
- Cross Border – International trade. All shipments involved with cross-border trade with the U.S. and which enter or exit the region via road, rail or marine.
- Inter-regional – Domestic trade. All shipments that originate in the region and have shipping destinations outside the region; or shipments that originate outside the region and have destinations within the Lower Mainland BC. Includes road, rail modes or marine.
- Regional / Local – Domestic trade. All shipments that have origins and destinations within the Lower Mainland BC region. Modes include road or rail.
- Air Gateway – International and Domestic trade. All shipments that enter or exit the region via air at airports, which may then be transferred to road, rail or marine for further transportation.
In turn, the purpose of this report is to address the following key questions:
- What are the DGs transported in the Lower Mainland?
- Where are the significant sites related to the production, consumption and handling of DGs?
- What are the routes for DGs transported in, out and throughout the Lower Mainland?
- What are the routes of DGs relative to population and emergency response locations?
Methodology and limitations
This report was prepared through analysis of transportation trade data provided by Transport Canada and project stakeholders. Truck routings in the Lower Mainland are modelled using the DG volume and site information described above, as well as TransLink’s Regional Transportation Model. The opinions expressed herein do not represent the views of TransLink.
While the data collected and analyzed for this report adds to the understanding of DG movements in the Lower Mainland, there are limitations to the data collected in this study. Other limitations are also flagged throughout this report, as appropriate. The overarching implication of these limitations is that it should not be assumed that all DG movements have been identified when interpreting the study results. Notable examples of where DG volumes may not be fully represented in certain datasets or analysis include non-revenue movements of DGs in datasets based on waybill data, road routes where there are regulatory DG restrictions, but DG-carrying vehicles may inadvertently use the route, etc.
Profile of dangerous goods transported
Dangerous goods, in general, make up a relatively small proportion of all goods transported, though the proportion varies by mode and location. For example, DGs transported by truck represent approximately 1.9% of all trucks operating in the Lower Mainland. To that end, the importance of providing visibility on the movement of DGs does not necessarily relate to the impacts in terms of volume to capacity, but is more concerned with providing visibility in terms of what, where and how much DGs are transported and accordingly how to allocate resources to manage the risks posed by these movements. The following summarizes these findings by corridors of interest, followed by a summary by mode of transportation.
Corridors of interest – findings
Because most data sources are mode specific and risk assessments are typically further conducted based on the risk profile of individual modes, we have organized our findings using that framework. However, past supply chain analysis and modelling work have considered the five corridors of interest to the study. The following bullets summarize key findings by corridor:
- Marine Gateway – International trade: In 2018, there were approximately 28,000 containers carrying DGs loaded or unloaded at Port of Vancouver marine terminals (approximately 1.5% of all containers). These containers are in turn handled by truck and rail services.
- Cross Border – International trade: DGs cross the Canada-US border by road and rail. Trucks containing most DG classes cross the border predominantly at Pacific Highway and to a lesser extent at Sumas-Abbotsford/Huntingdon. The largest single flow of trucks are trucks loaded with jet fuel between Washington State refineries; in total, there are about 36 loaded trucks per day (and a corresponding similar number of empty placarded trucks in return). However, this volume is expected to decline with the opening of a new fuel system via YVR around 2021, at which point barges will be used. There is also interchange rail traffic.
- Inter-regional – Domestic trade: There are DGs entering/exiting the Lower Mainland by truck, rail and marine (including truck and rail roll-on/roll-off and bulk barges). By truck, the busiest inter-regional land-based truck gateway is Highway 1/7 at Hope; there were 72 trucks reported entering/leaving the Lower Mainland via Highway 1 (62 trucks) and Highway 7 (10 trucks). There are also intermodal- and non-intermodal rail flows. By marine modes, Seaspan Ferries is a notable barge operator of DG-carrying trucks to/from Vancouver Island. Other operators of domestic marine services also provide RO/RO ferry, and RO/RO (truck and rail), containerized and bulk barge shipments of DGs to/from Vancouver Island and other areas along BC’s coast.
- Regional / Local – Domestic trade: Pure regional movements of DGs within the Lower Mainland by truck would include petroleum products delivery from liquid and gaseous bulk terminals (notably located in Burnaby), deliveries from chemical producers and distributors to consumption points such as water treatment facilities, deliveries to/from medical facilities and service vehicles containing dangerous goods.
- Air Gateway – International and Domestic trade: This corridor includes all shipments that enter or exit the region via air at airports, which may then be transferred to road, rail or marine for further transportation. The most commonly reported DGs imported by air at YVR are lithium ion batteries and dry ice, which are categorized as Class 9. It is worth noting that dry ice is not the primary commodity being shipped, but rather used to maintain the temperature of perishables. Most of the DG trucks to/from YVR supply replenish tank farms with jet fuel that supply aviation carriers, and in turn support YVR’s role as an international gateway. On average, more than 1,000 trucks per month (35 per day) transfer jet fuel from Washington State to Sea Island. These are expected to be nearly eliminated based on the opening of a new pipeline to Sea Island.
Marine transportation in the Lower Mainland is used to transport containerized, roll-on/roll-off (RO/RO), bulk DGs on tankers, ferries and barges to/from the Lower Mainland through bulk and container terminals overseen by the Vancouver-Fraser Port Authority (VFPA), and other operators. In turn, it is part of the Marine Gateway facilitating international trade, and Inter-Regional Corridor facilitating domestic trade to/from the Lower Mainland (notably to Vancouver Island and locations along the BC Coast). The following are key findings from analysis of marine DG movements:
- The VFPA provided information on containers carrying DGs reported by carriers. In 2018, there were approximately 28,000 containers carrying DGs loaded or unloaded at the Port of Vancouver (approximately 1.5% of all containers). All classes (1-9) of DGs were reported. Most containers carried either Class 8 (corrosives, 29.6%) or Class 9 DGs (miscellaneous, 28.1%), particularly those containers unloaded (collectively 67.0% across both classes) or in transit (collectively 70.4% across both classes) through the Port of Vancouver. By comparison, containers carrying Class 5.1 (oxidizing) DGs were the most common class of DGs loaded onto vessels (26.7%), followed by Class 3 (flammable liquids, 25.3%), Class 8 (19.5%) and Class 9 (16.1%).
- There are also significant quantities of bulk movements of petroleum products (various Class 3 flammable liquids); chemicals (Class 8 and Class 3); and sulphur (a Class 4.1 [flammable solid] DG) handled at the Port of Vancouver.
- BC Ferries (truck) and Seaspan Ferries (truck) also offer barge service between the Lower Mainland and Vancouver Island. There are also other providers who provide DG transport to areas along and off BC’s coast, including fuel resupply.
Rail transportation is used to transport bulk and containerized DGs to/from the Lower Mainland in rail cars designed to handle specific commodities (e.g. tank cars) and containers. In turn, it facilitates both Inter-Regional Corridor goods movement (via the CN and CP rail networks) as well as Cross-Border volumes (via BNSF). In addition, the Southern Railway of BC (SRY), a shortline, provides switching services within the Lower Mainland as well RO/RO barge service to Vancouver Island; however, we are not aware of any pure Regional / Local DG movements. Further information on rail movements cannot be provided as it could be used to identify the flows on a specific company’s network.
Road transportation is used to facilitate the movement of bulk, breakbulk and containerized DGs, as well as DGs contained within service vehicles, across all of the corridors considered in this study. The following are key findings from analysis of road DG movements:
- Based on a 2014 survey in the Lower Mainland, approximately 1.9% of trucks surveyed carried DGs.
- A 2016 truck survey at the Canadian-Mainland Washington State Border, identified that approximately 3.6% of all trucks surveyed (loaded or empty) were placarded. Approximately 1.9% of trucks surveyed were loaded carrying DGs. To estimate truck movements on a monthly basis, we expanded the survey results in part to make the results more relatable. In addition, due to border opening hours that differ at each location, the raw results likely under- or over-state the importance of different border crossings.
- Most DG truck Canada-US crossings occurred at Pacific Highway (an estimated 1,800 trucks per month out of 2,094 total border crossings). The majority of all DG crossings were Class 3 (approximately 1,100 per month). Specifically, there were over 800 trucks per month carrying jet fuel, predominantly destined to the Vancouver International Airport (YVR). There were also crossings of Class 2 (approximately 275 trucks per month), 8 (corrosives, approximately 400 trucks per month), Class 9 (approximately 275 per month). Class 5 and 7 DGs were also reported.
Air transport is considered its own corridor within the context of the study. The following are key findings from analysis of air-related DG movements:
- Airports are not only transit points for DGs, but also major consumption points of aviation fuel to support aircraft movements. In particular, Vancouver International Airport pointed us to data indicating that these movements could be upwards of 1,000 loaded trucks per month (35 loaded trucks per day) to supplement an existing pipeline between Burnaby and YVRFootnote 1. However, there is a project under construction to re-route these movements via a marine terminal and pipeline between the South Arm of the Fraser River and YVR, with an expected completion in 2021, which would nearly eliminate these truck movements.
- The most commonly reported DGs imported by air at YVR are lithium ion batteries and dry ice, which are categorized as Class 9. It is worth noting that dry ice is not the primary commodity being shipped, but rather used to maintain the temperature of perishables.
DG sites
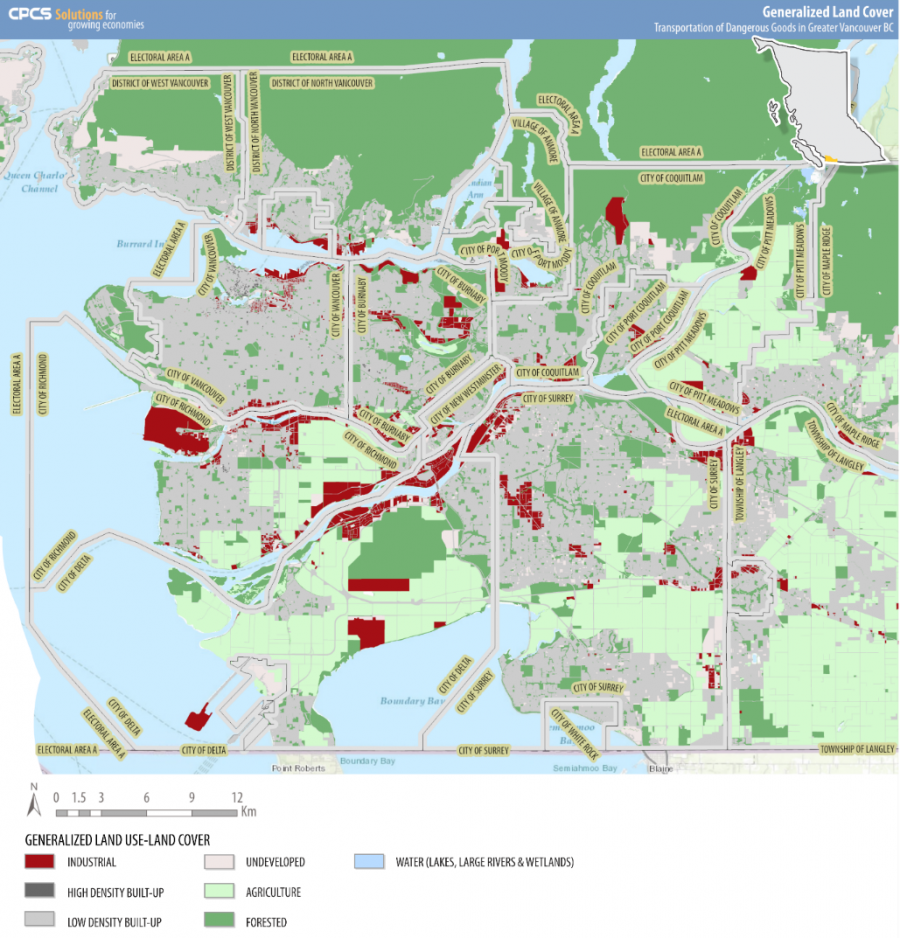
The Lower Mainland, as a large metropolitan area with a diversified economy and major port facilities, has DG sites located throughout the study area, including a petroleum refinery and petroleum terminals. Large-volume DG sites typically coincide with industrial land use (Figure ES-1 in red). However, DG sites can be nearly anywhere in the study area. As an example, fuelling stations handling Class 3 DGs are located throughout the Lower Mainland. However, the volumes at some of these sites are typically relatively small (e.g. up to one truck per day at fuelling station).
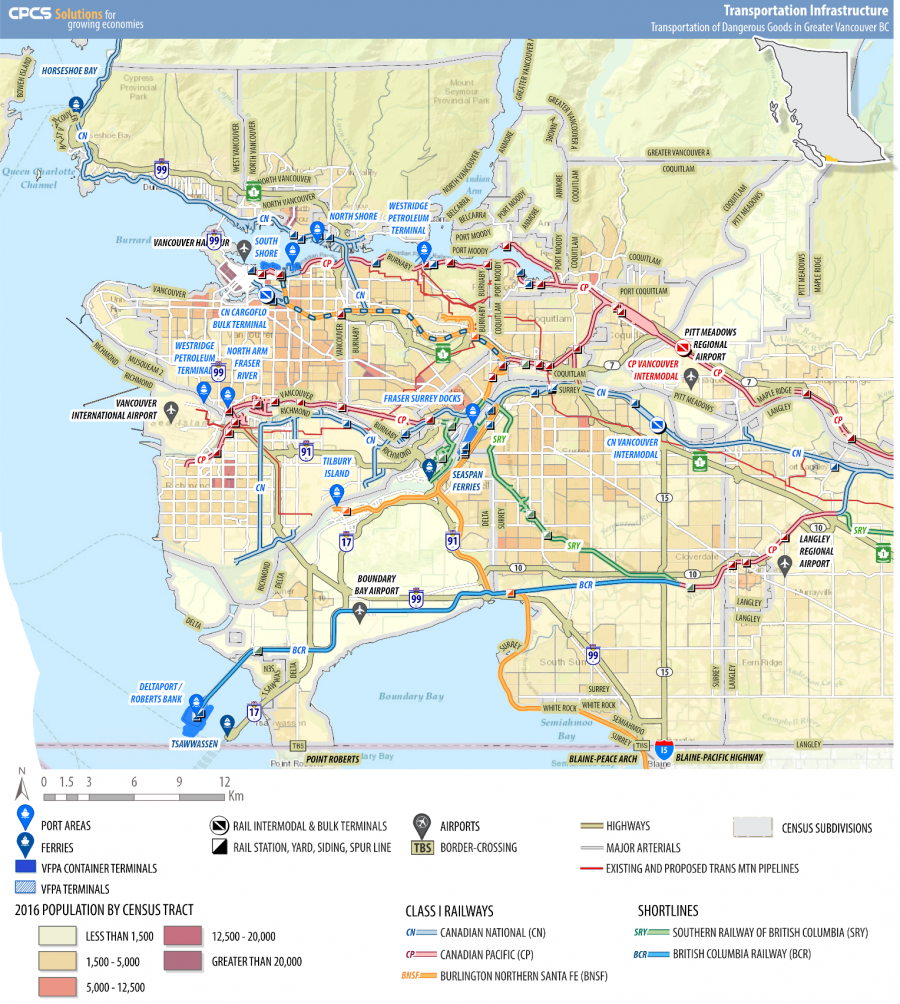
Burrard Inlet contains the highest concentration of large-volume marine terminals handling DGs, including containers with DGs (on the South Shore in Vancouver), petroleum (predominantly South Shore in Burnaby and in Port Moody) and other dry and liquid bulk chemical terminals (North Shore in North Vancouver and South Shore in Burnaby) (Figure ES-2). The Fraser River has rail and truck barge services (notably at Tilbury and Surrey), as well as a small container terminal. The largest container terminal handling DGs in the Lower Mainland is located at Roberts Bank. Other facilities are located throughout the Lower Mainland, including rail intermodal and bulk transloading facilities.
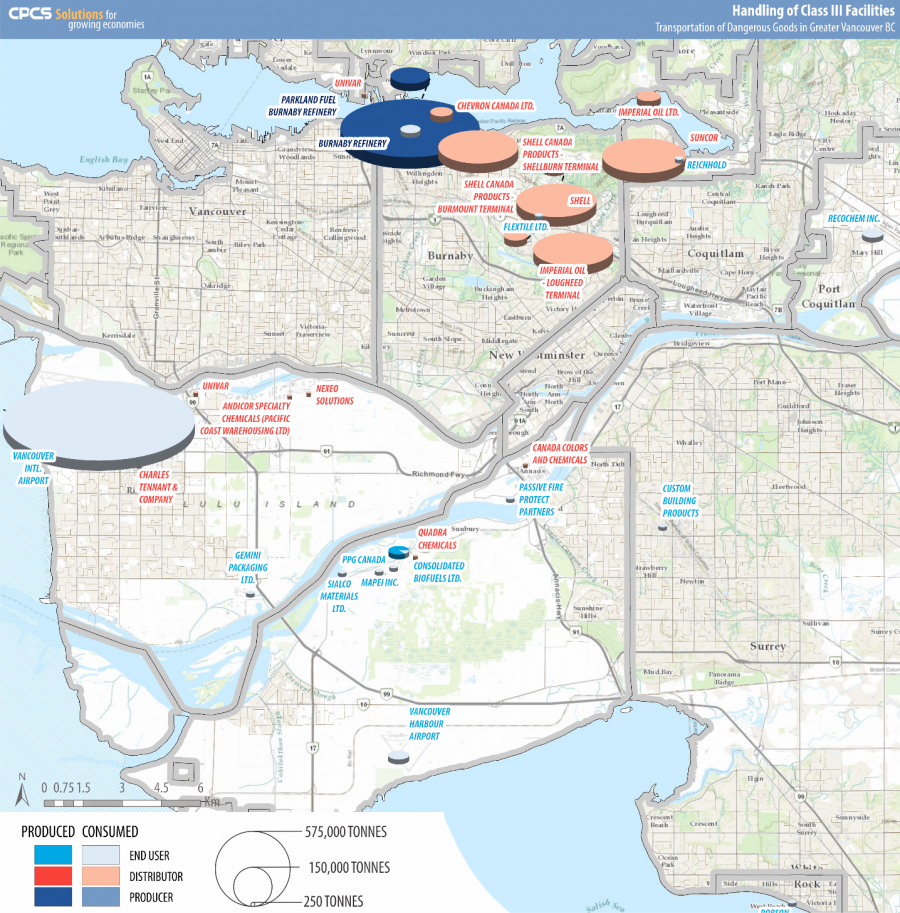
Some of the largest DG sites by volume are petroleum facilities (a refinery and terminals) handling Class 3 DGs concentrated along Burrard Inlet and in central Burnaby (Figure ES-3). Several facilities in this area handle of the order of 300,000 tonnes (t) per year. The largest single generator of DG movements in the Lower Mainland is YVR, which relates to jet fuel deliveries to supply air carriers transporting people and goods. Fuel truck movements are expected to be nearly eliminated following the completion of the fuel facility pipeline by Vancouver Airport Fuel Facilities Corporation (VAFFC).
Figure ES-1: Land use and cover in Metro Vancouver
Source: CPCS based on BC Open Data Portal.
Figure ES-2: Transportation infrastructure and potential DG handling facilities in Metro Vancouver
Source: CPCS based on multiple sources.
Figure ES-3: Estimated volumes of Class 3 liquids produced, consumed or distributed, tonnes
Source: CPCS based on data compiled for Transport Canada.
DG truck routes
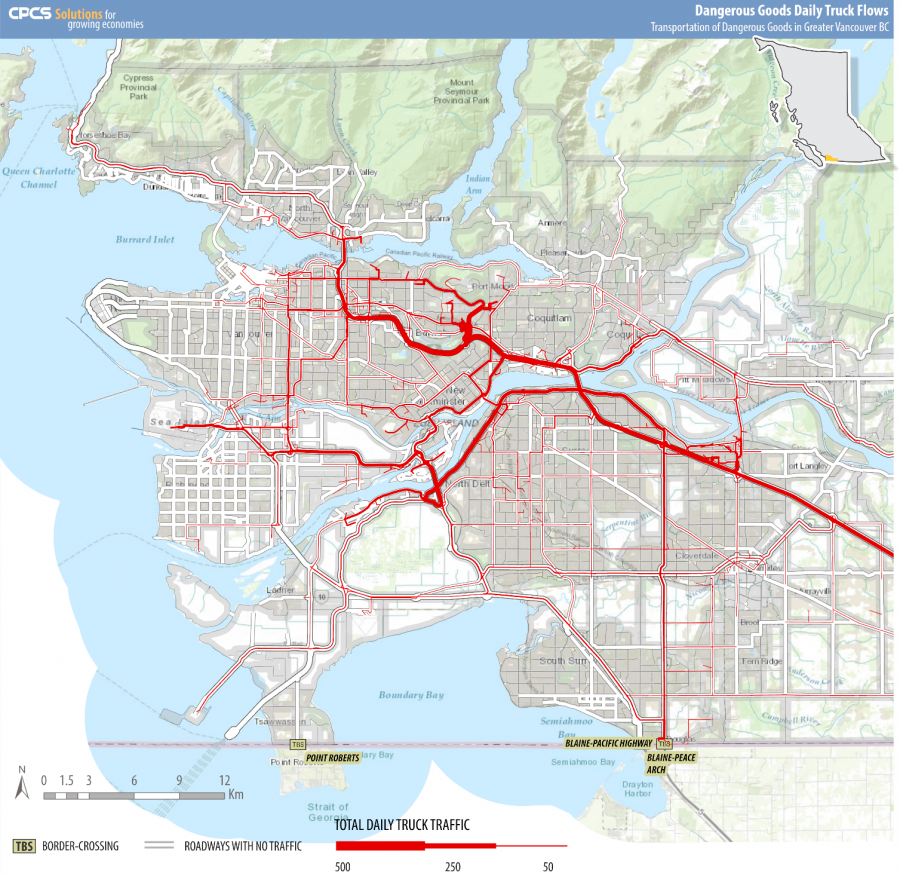
Figure ES-4 shows the modelled truck volumes in Metro Vancouver (Lower Mainland: Appendix E, Figure E-2). DGs transported by truck operate throughout the Lower Mainland, but are concentrated on key corridors. Important DG corridors in the Lower Mainland include:
- Highway 1 is the most important DG road corridor in the Lower Mainland by overall DG truck volume, with the highest volume occurring near North Road in Burnaby. At this location, in 2014, 310 DG trucks passed this location (between 7:00-17:30), of which is expected to be at least 445 trucks in 24-hours by 2017Footnote 2. As the main corridor through the Lower Mainland, nearly all classes are observed at this location; however, the majority are Class 3 (67% of all trucks), Class 2 (21%) and Class 8 (8%).Footnote 3
- All major bridge crossings are important DG corridors, with the Port Mann Bridge (Highway 1), Alex Fraser Bridge (Highway 91) and Second Narrows Bridge (Highway 1) having the highest volumes. In particular, the Alex Fraser Bridge accommodates traffic that would otherwise be routed on Highway 99 through the Massey Tunnel (notably jet fuel destined to YVR), and the Second Narrows Bridge accommodates all DG traffic to/from the North Shore.
- The South Fraser Perimeter Road (Highway 17) is an important DG route connecting industrial areas at Tilbury and Annacis Islands with Highways 91 and 1. Unlike Highway 1 (which is heavily weighted towards Class 3 volumes), in 2014, Class 2 DGs made up the highest fraction of DG-carrying trucks (31%), followed by Class 3 (26%), DANGER placards (19%) and Class 8 (16%).
Figure ES-4: Estimated total daily DG truck volumes (all classes) in Metro Vancouver
Source: CPCS analysis of TransLink RTM and other DG data sources.
Learn more
To obtain a copy of the report, please contact us.
Contact us
Safety Research and Analysis Branch
Transportation of Dangerous Goods Directorate
Transport Canada
Email: LMBCStudy-EtudeLMCB@tc.gc.ca


