
Passenger Arrivals to Canada and Passengers Screened at Departure
Average Daily Passenger Arrivals

Average Daily Passenger Arrivals

Average Daily Passenger Arrivals by Comparable Weeks *
| Sector | Jan 2 - Jan 8, 2023 | Jan 7 - Jan 13, 2019 | Ratio 2023/2019 |
|---|---|---|---|
| United States | 43,490 | 43,982 | 98.90% |
| Sun Destinations | 31,658 | 29,895 | 105.90% |
| Overseas | 27,689 | 31,433 | 88.10% |
| Total | 102,837 | 105,311 | 97.70% |
Canada vs US Departures: Comparison of 2023 vs 2019 Levels (in Ratio)

Average Daily Passengers Screened at Departures

Daily Screened Traffic by Comparable Weeks by Airport
| Airports | Jan 2 – Jan 8, 2023 | Jan 7 - Jan 13, 2019 | Ratio 2023/2019 |
|---|---|---|---|
| Toronto | 50,823 | 50,863 | 99.90% |
| Vancouver | 25,086 | 26,283 | 95.40% |
| Montreal | 24,855 | 22,092 | 112.50% |
| Calgary | 16,881 | 15,149 | 111.40% |
| Others | 39,145 | 39,834 | 98.30% |
| Total | 156,791 | 154,222 | 101.70% |
Sources: CBSA and CATSA * Note: Sun Destinations include the Caribbean, Central America and Mexico; 7DMA = 7-Day Moving Average
International Arrivals Forecast
Estimated weekly CBSA international arrivals projection
Week of Jan 3 to 9, 2022 - week of Jan 23 to 29, 2023

Sources: CBSA international arrivals, Transport Canada April 2022 updated air passenger recovery scenarios – optimistic and reference cases
Screened Traffic Forecast
Estimated weekly CATSA (15 airports) screened traffic projection
Week of Jan 3 to 9, 2022 - week of Jan 23 to 29, 2023

Sources: CATSA screened traffic, Transport Canada April 2022 updated air passenger recovery scenarios – optimistic and reference cases
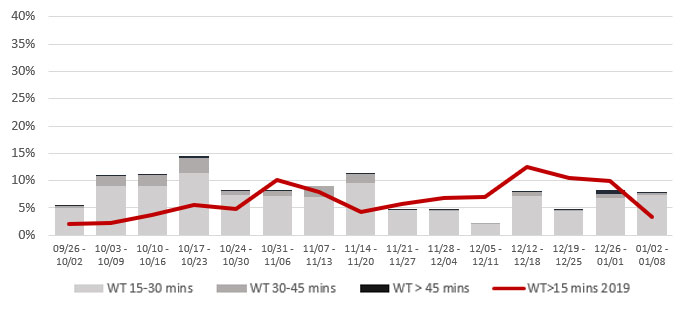
Performance Indicators: Wait Time at Top 15 Canadian Airports
Screened Passenger Departures (CATSA) Wait Times: Proportion of Passengers Waiting More than 15 Minutes Before Screening (by 15-minute Range)

[ Redacted ]
Sources: CATSA [ Redacted ]
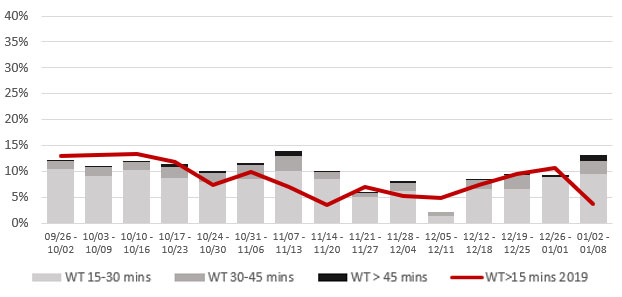
Performance Indicators: Wait Time at Top 4 Canadian Airports
Screened Passenger Departures (CATSA) Wait Times: Proportion of Passengers Waiting More than 15 Minutes Before Screening (by 15-minute Range) at the Top 4 Airports

[ Redacted ]
Sources: CATSA [ Redacted ]
Performance Indicators: Wait Time at Top 4 Canadian Airports
Screened Passenger Departures (CATSA) Wait Times: Proportion of Passengers Waiting More than 15 Minutes Before Screening (by 15-minute Range)
Toronto (YYZ)
Vancouver (YVR)

Montreal (YUL)

Calgary (YYC)
Source: CATSA
[ Redacted ]
Additional Background Information
Count of Screening Officers as a Proportion of Full Workforce Target (Including Officers in Training)

[ Redacted ]
[ Redacted ]
Sources: CATSA and GTAA
Additional Background Information
Average Percentage Wait Times Over 15 Minutes for Transborder Checkpoints Relative to All Checkpoints, January 2 - 8, 2023

Source: CATSA