Maps
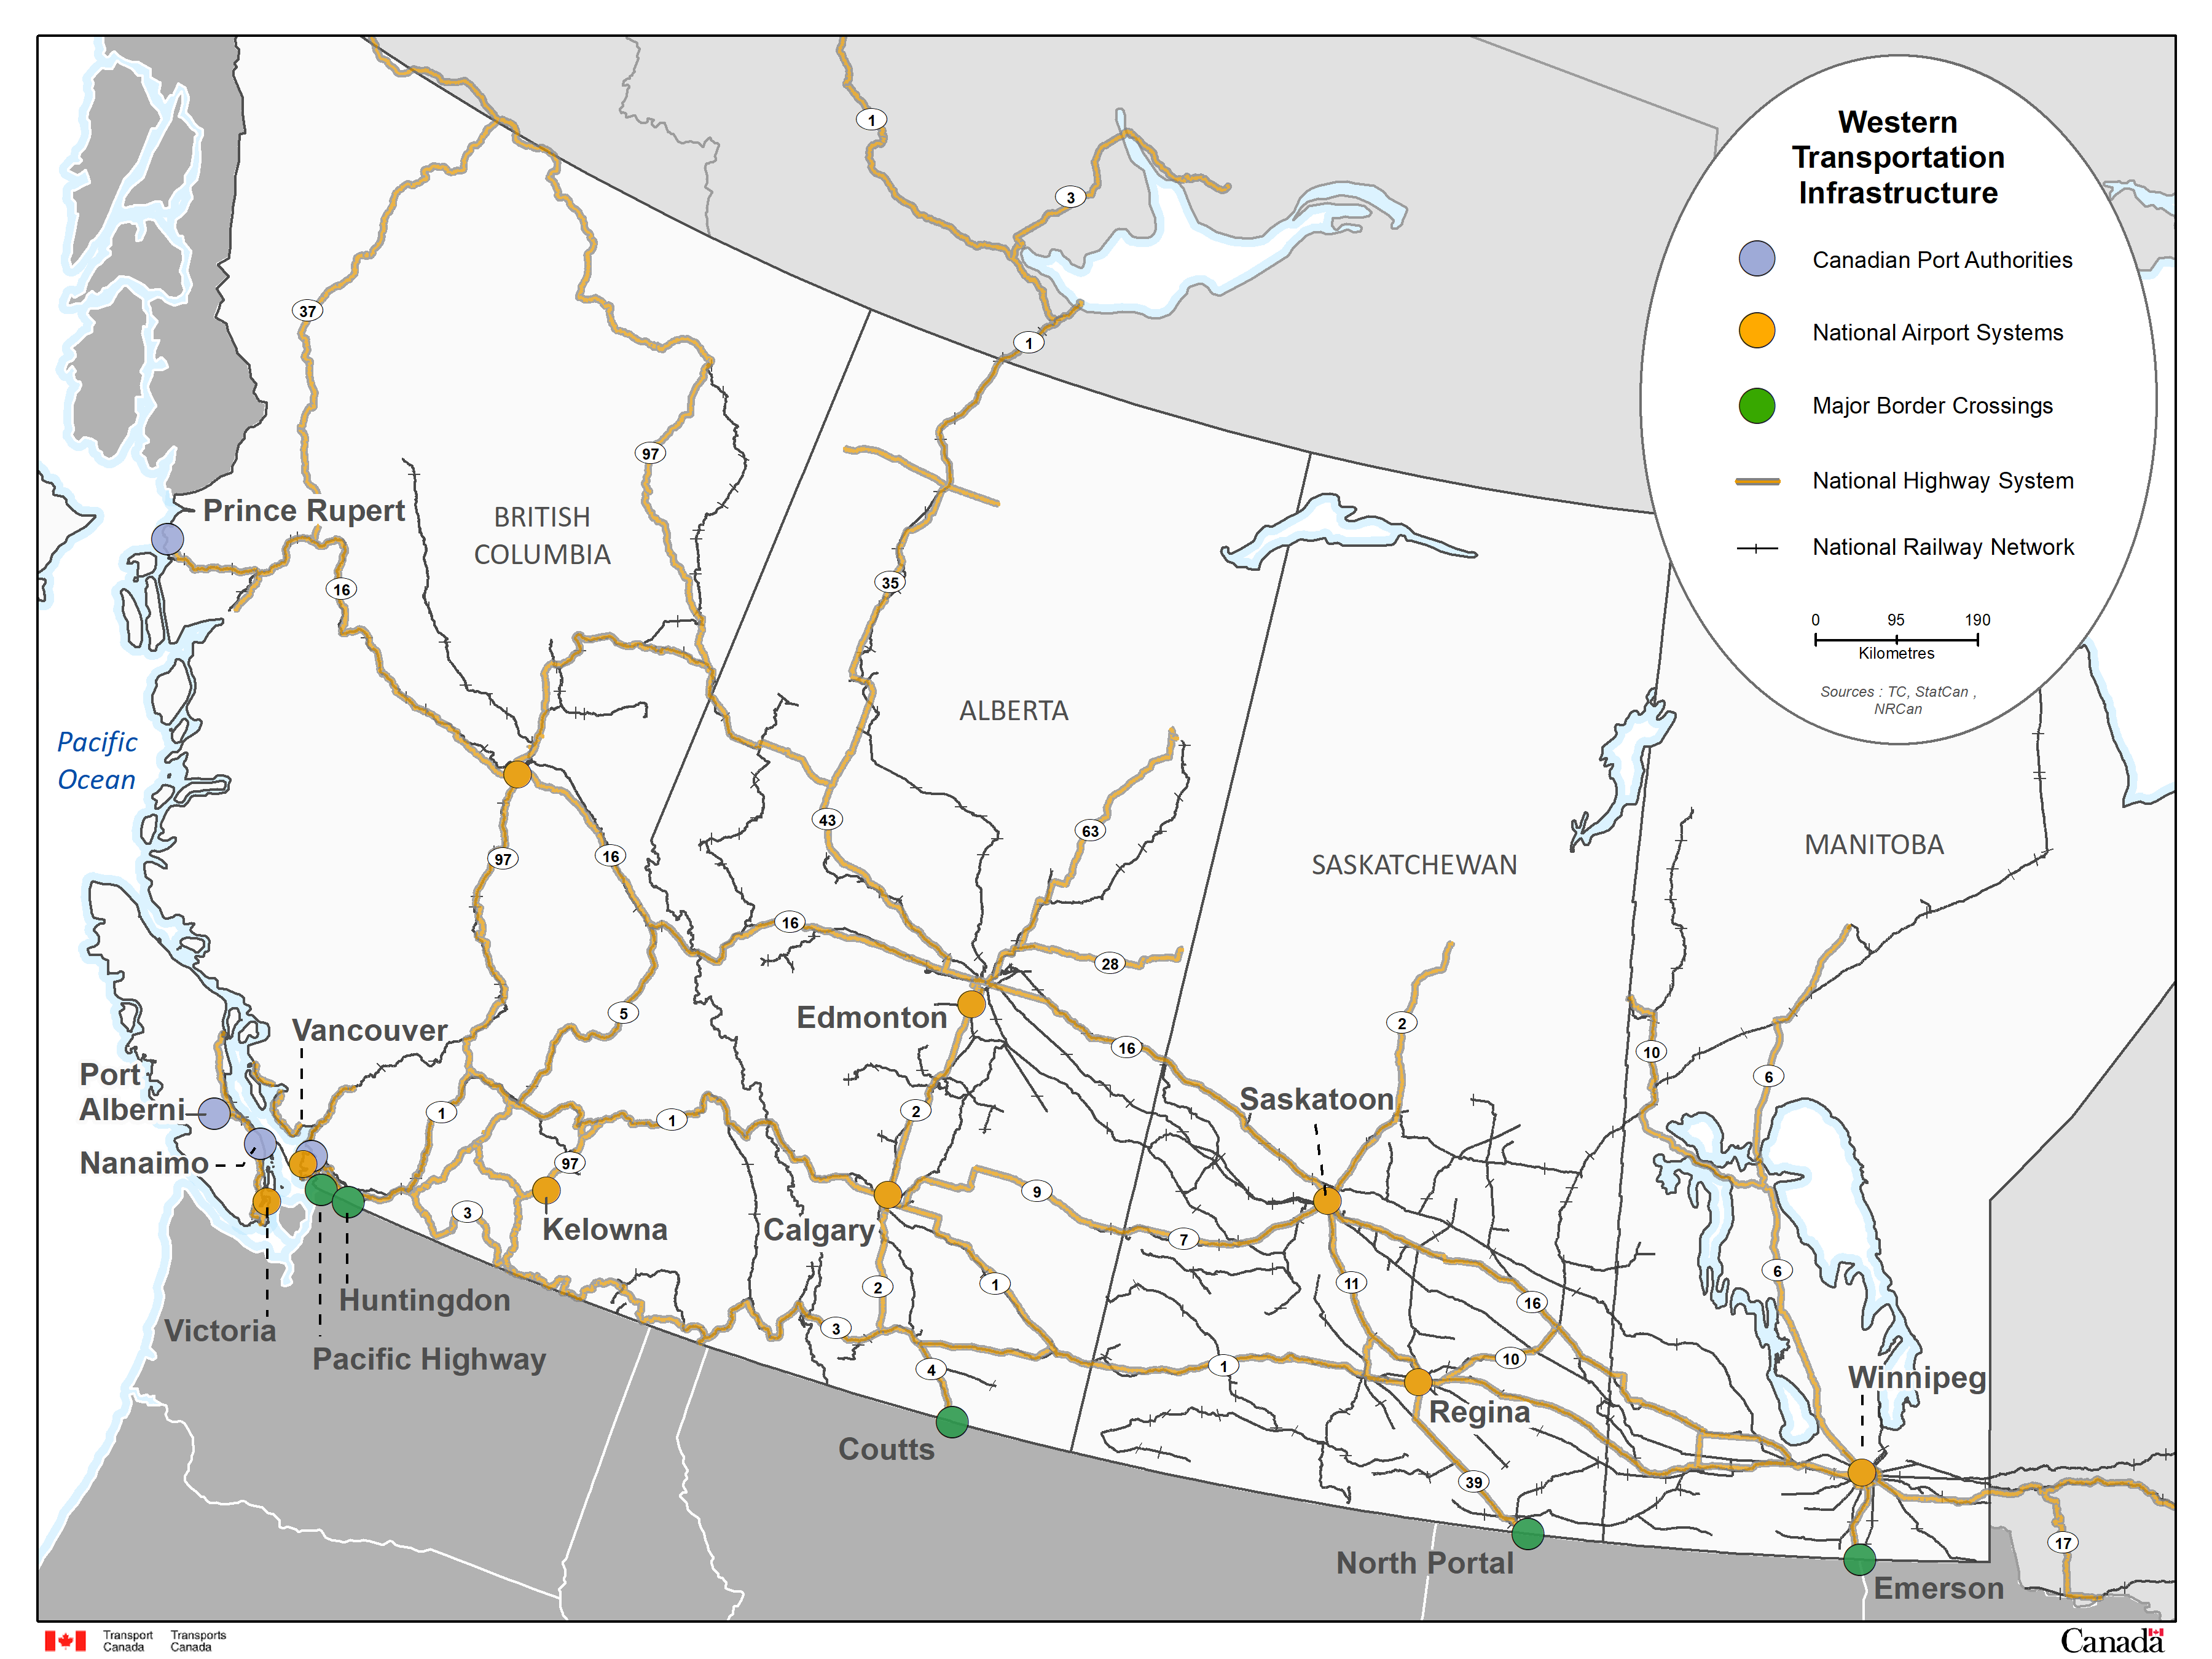
Map 1: Western Region
Image description - Map 1: Western Region
The map of the four Western provinces, British Columbia, Alberta, Saskatchewan and Manitoba, shows transportation infrastructure of the Western Region. NAS airports are identified geographically by an orange circle; six airports are located in the Prairie Provinces and three in British Columbia. CPA’s infrastructure is identified geographically by a blue circle; four of the 17 CPA are located in British Columbia. Border crossings are represented geographically by green circles. National Railway Network is represented by black lines and the National Highway System by brown lines.
Map 2: Central Region
Image description - Map 2: Central Region
The map of the two central provinces, Ontario and Quebec, shows transportation infrastructure of the Central Region. NAS airports are identified geographically by an orange circle; three airports are in Québec and four in Ontario. Ports are identified geographically by a blue circle; 9 out of the 17 CPA are located in the Central Region. Border crossings are identified geographically by green circles. National Railway Network is represented by black lines and National Highway System by brown lines.
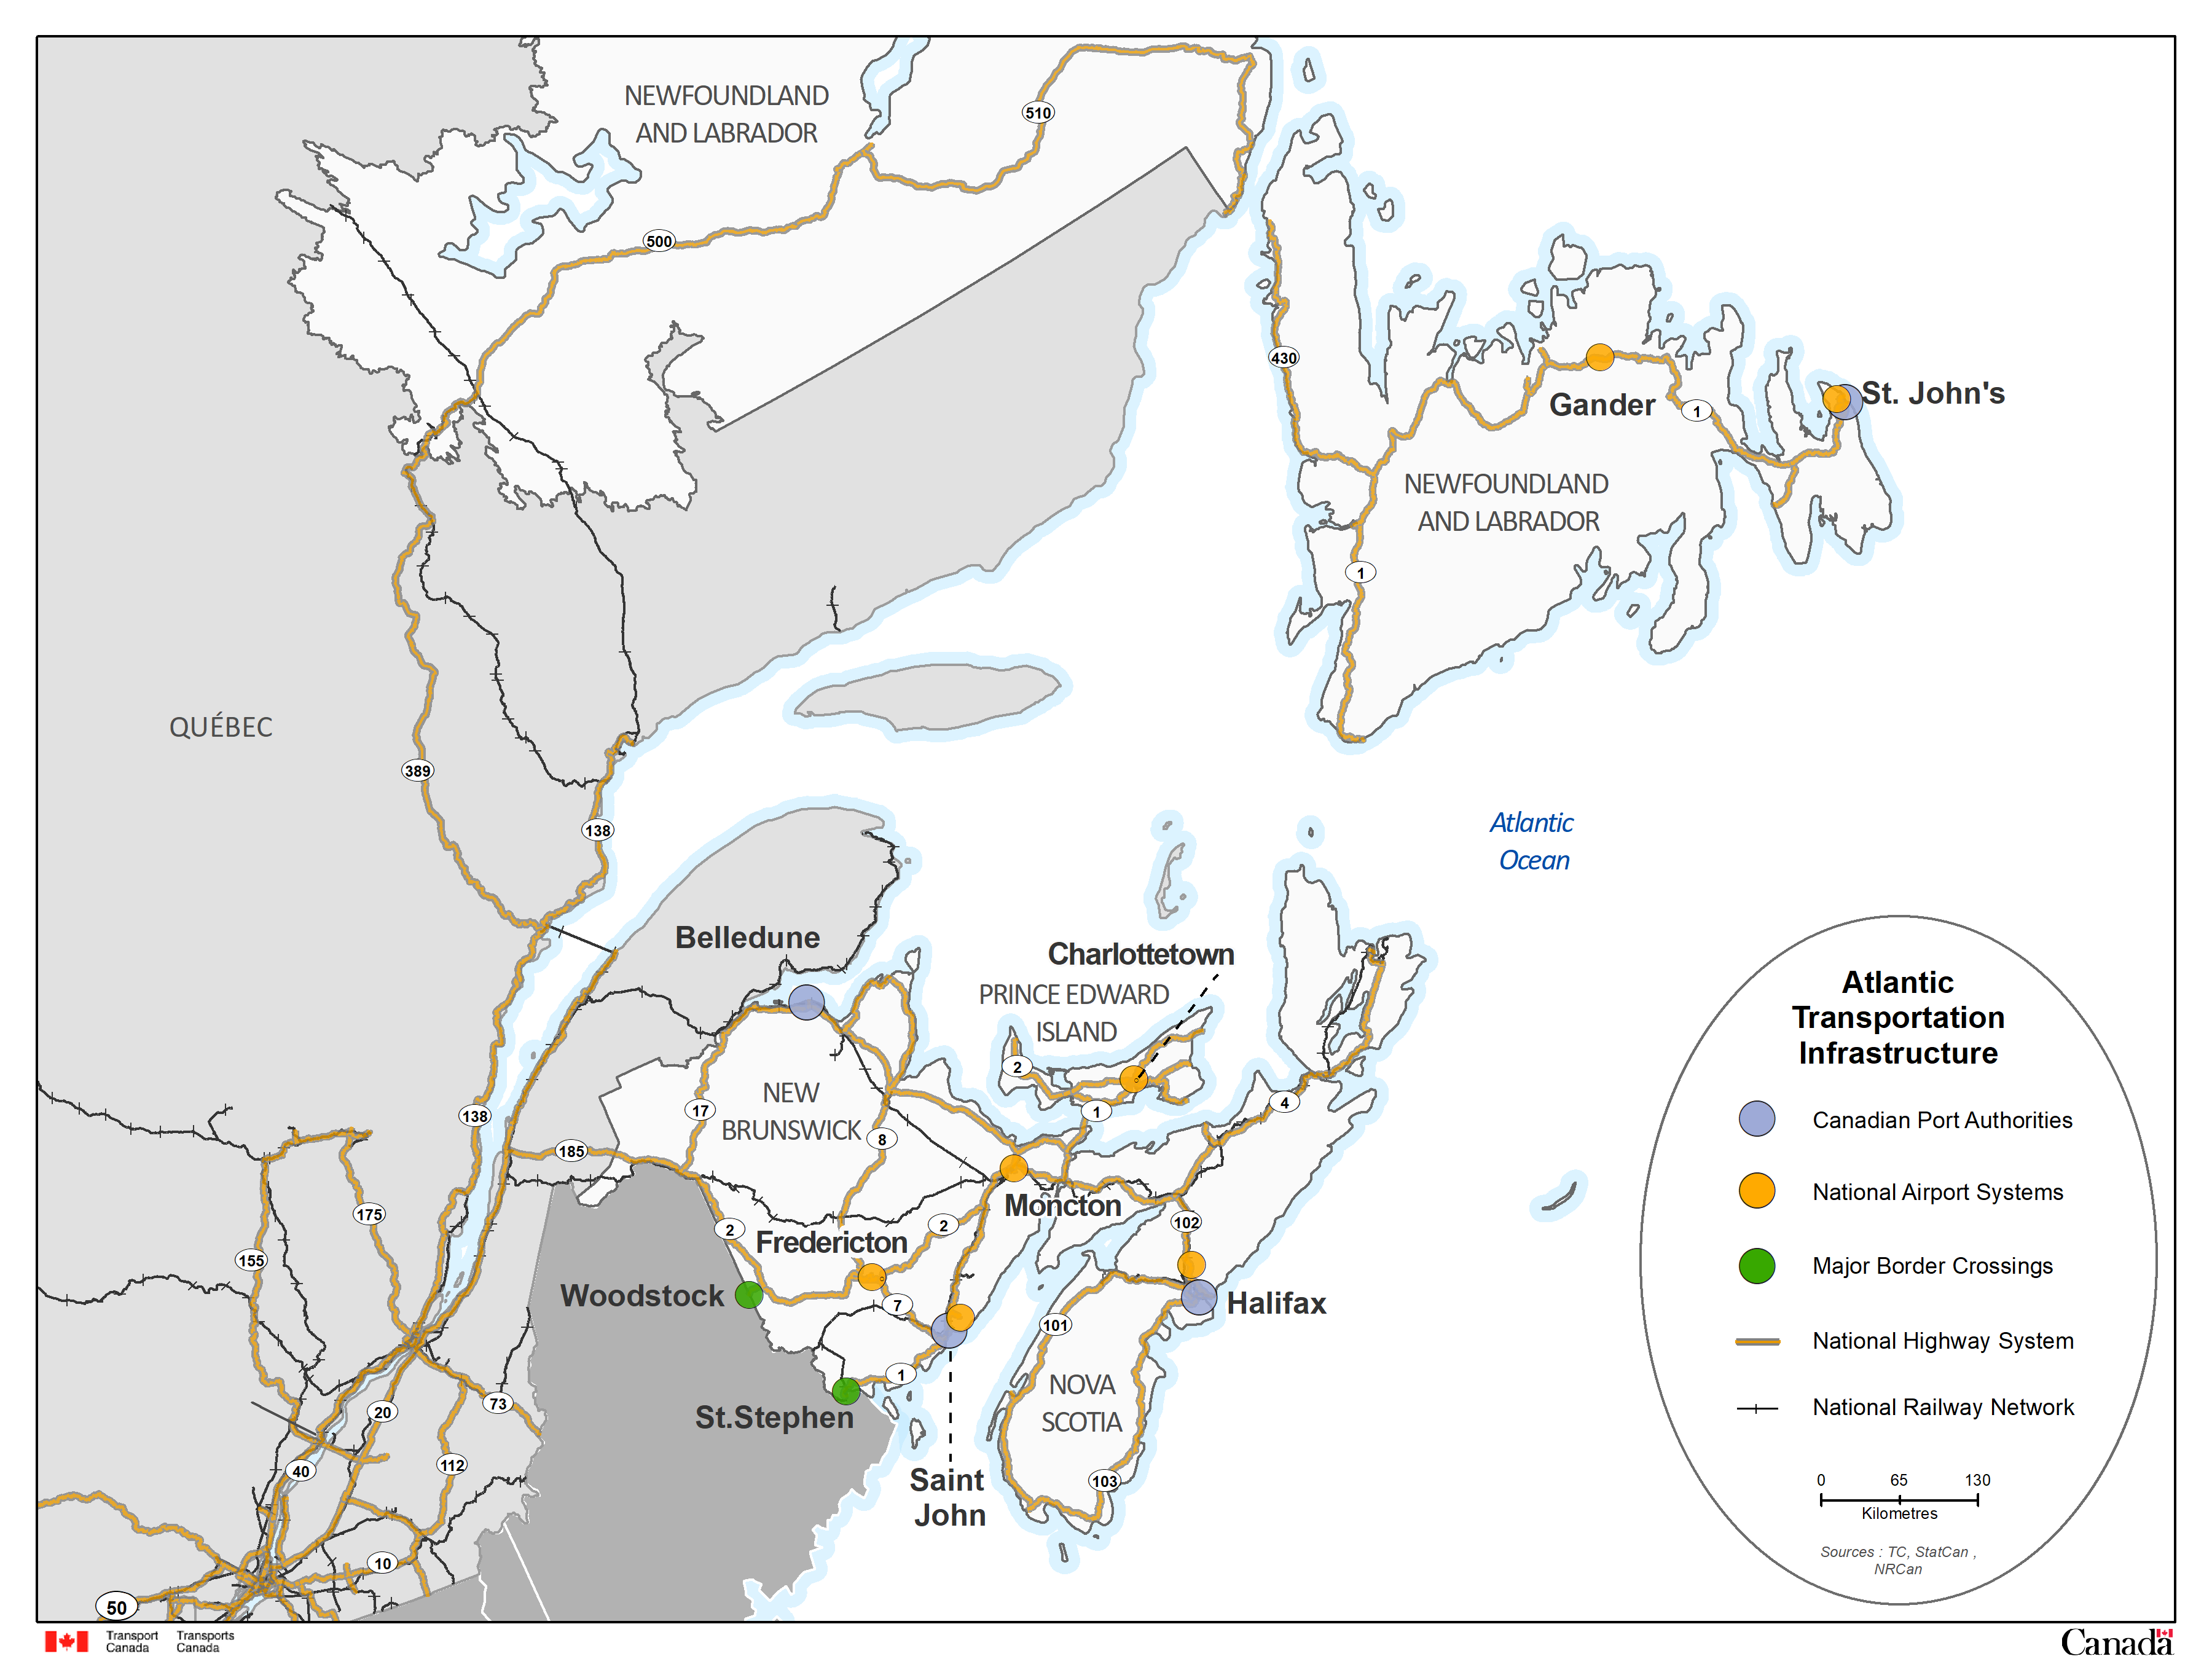
Map 3: Eastern Region
Image description - Map 3: Eastern Region
The map of the four Eastern provinces, New Brunswick, Nova Scotia, Prince Edward Island and Newfoundland and Labrador, shows transportation infrastructure of the Eastern Region. NAS airports are identified geographically by an orange circle; seven of these airports are located in the Atlantic Provinces. Ports are identified geographically by a blue circle; four out of the 17 CPA are located in Eastern Canada. Border crossings are represented geographically by green circles. National Railway Network is represented by black lines and National Highway System by brown lines.
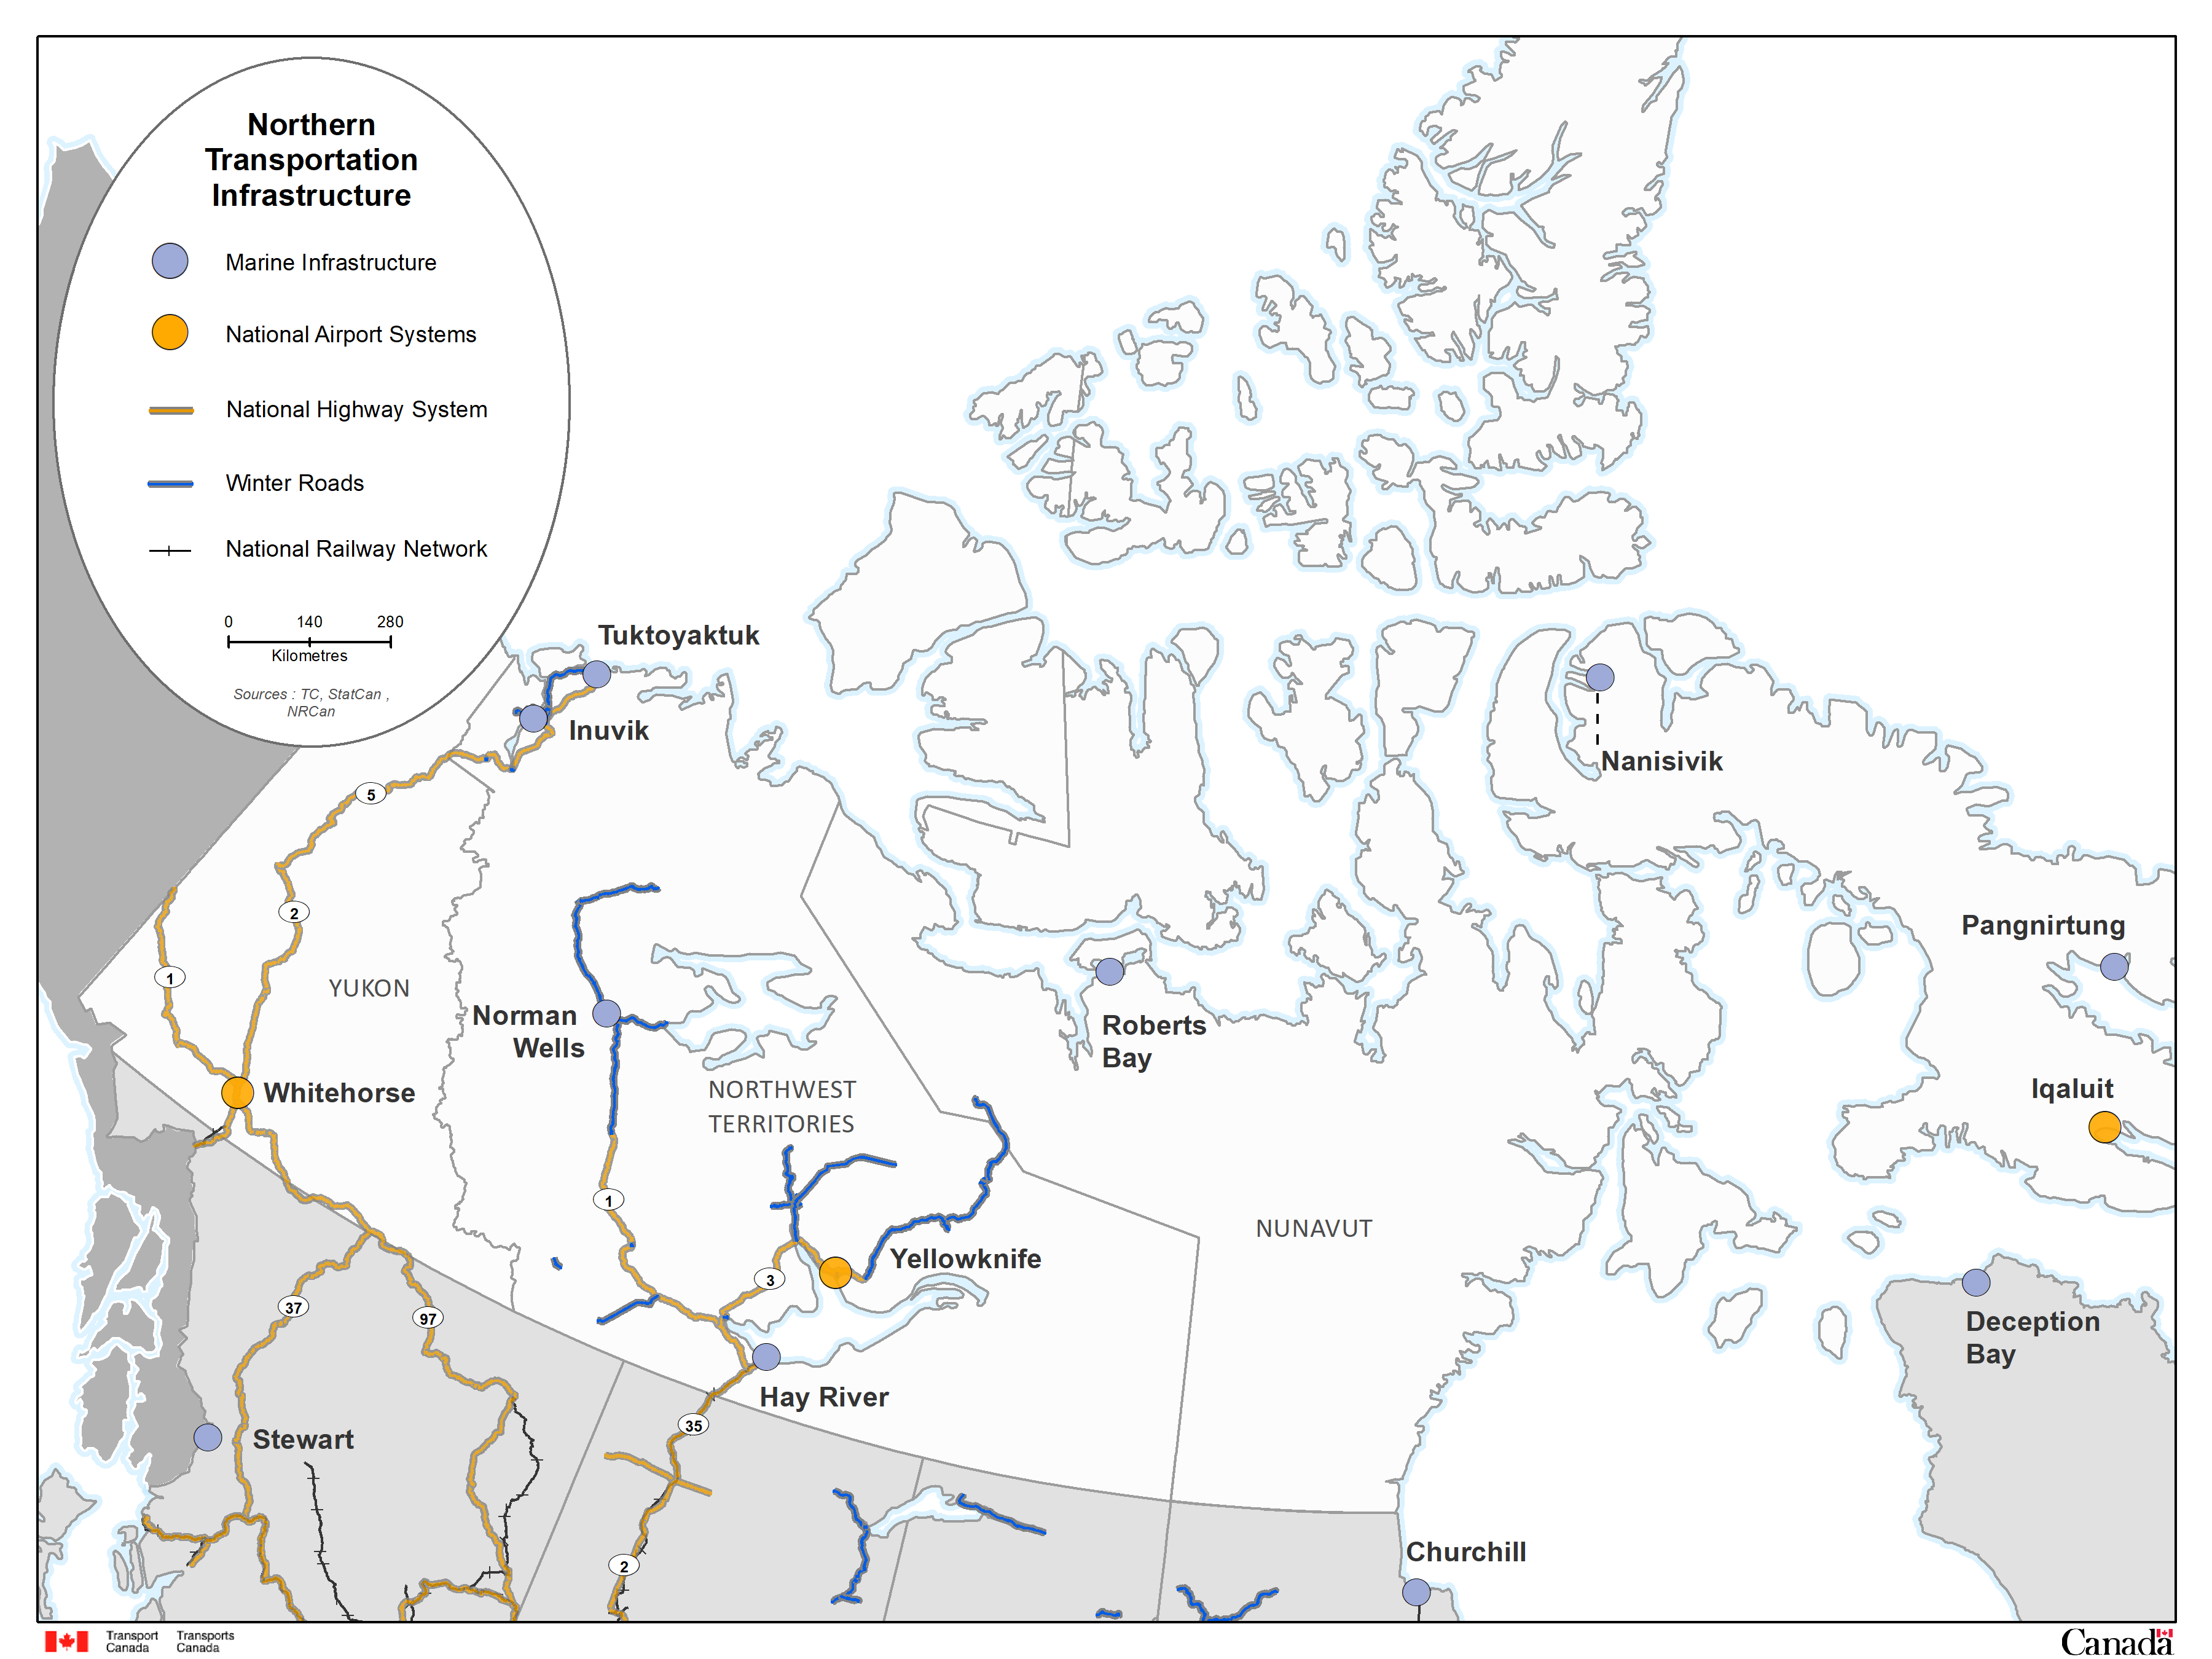
Map 4: Northern Region
Image description - Map 4: Northern Region
The map of the three territories, Yukon, Northwest territories and Nunavut, shows transportation infrastructure of the Northern Region. NAS airports are identified geographically by an orange circle; three airports are found in the capital of each territory. Marine infrastructure is geographically represented by a blue circle. National Railway Network is represented by black lines and National Highway System by brown lines.
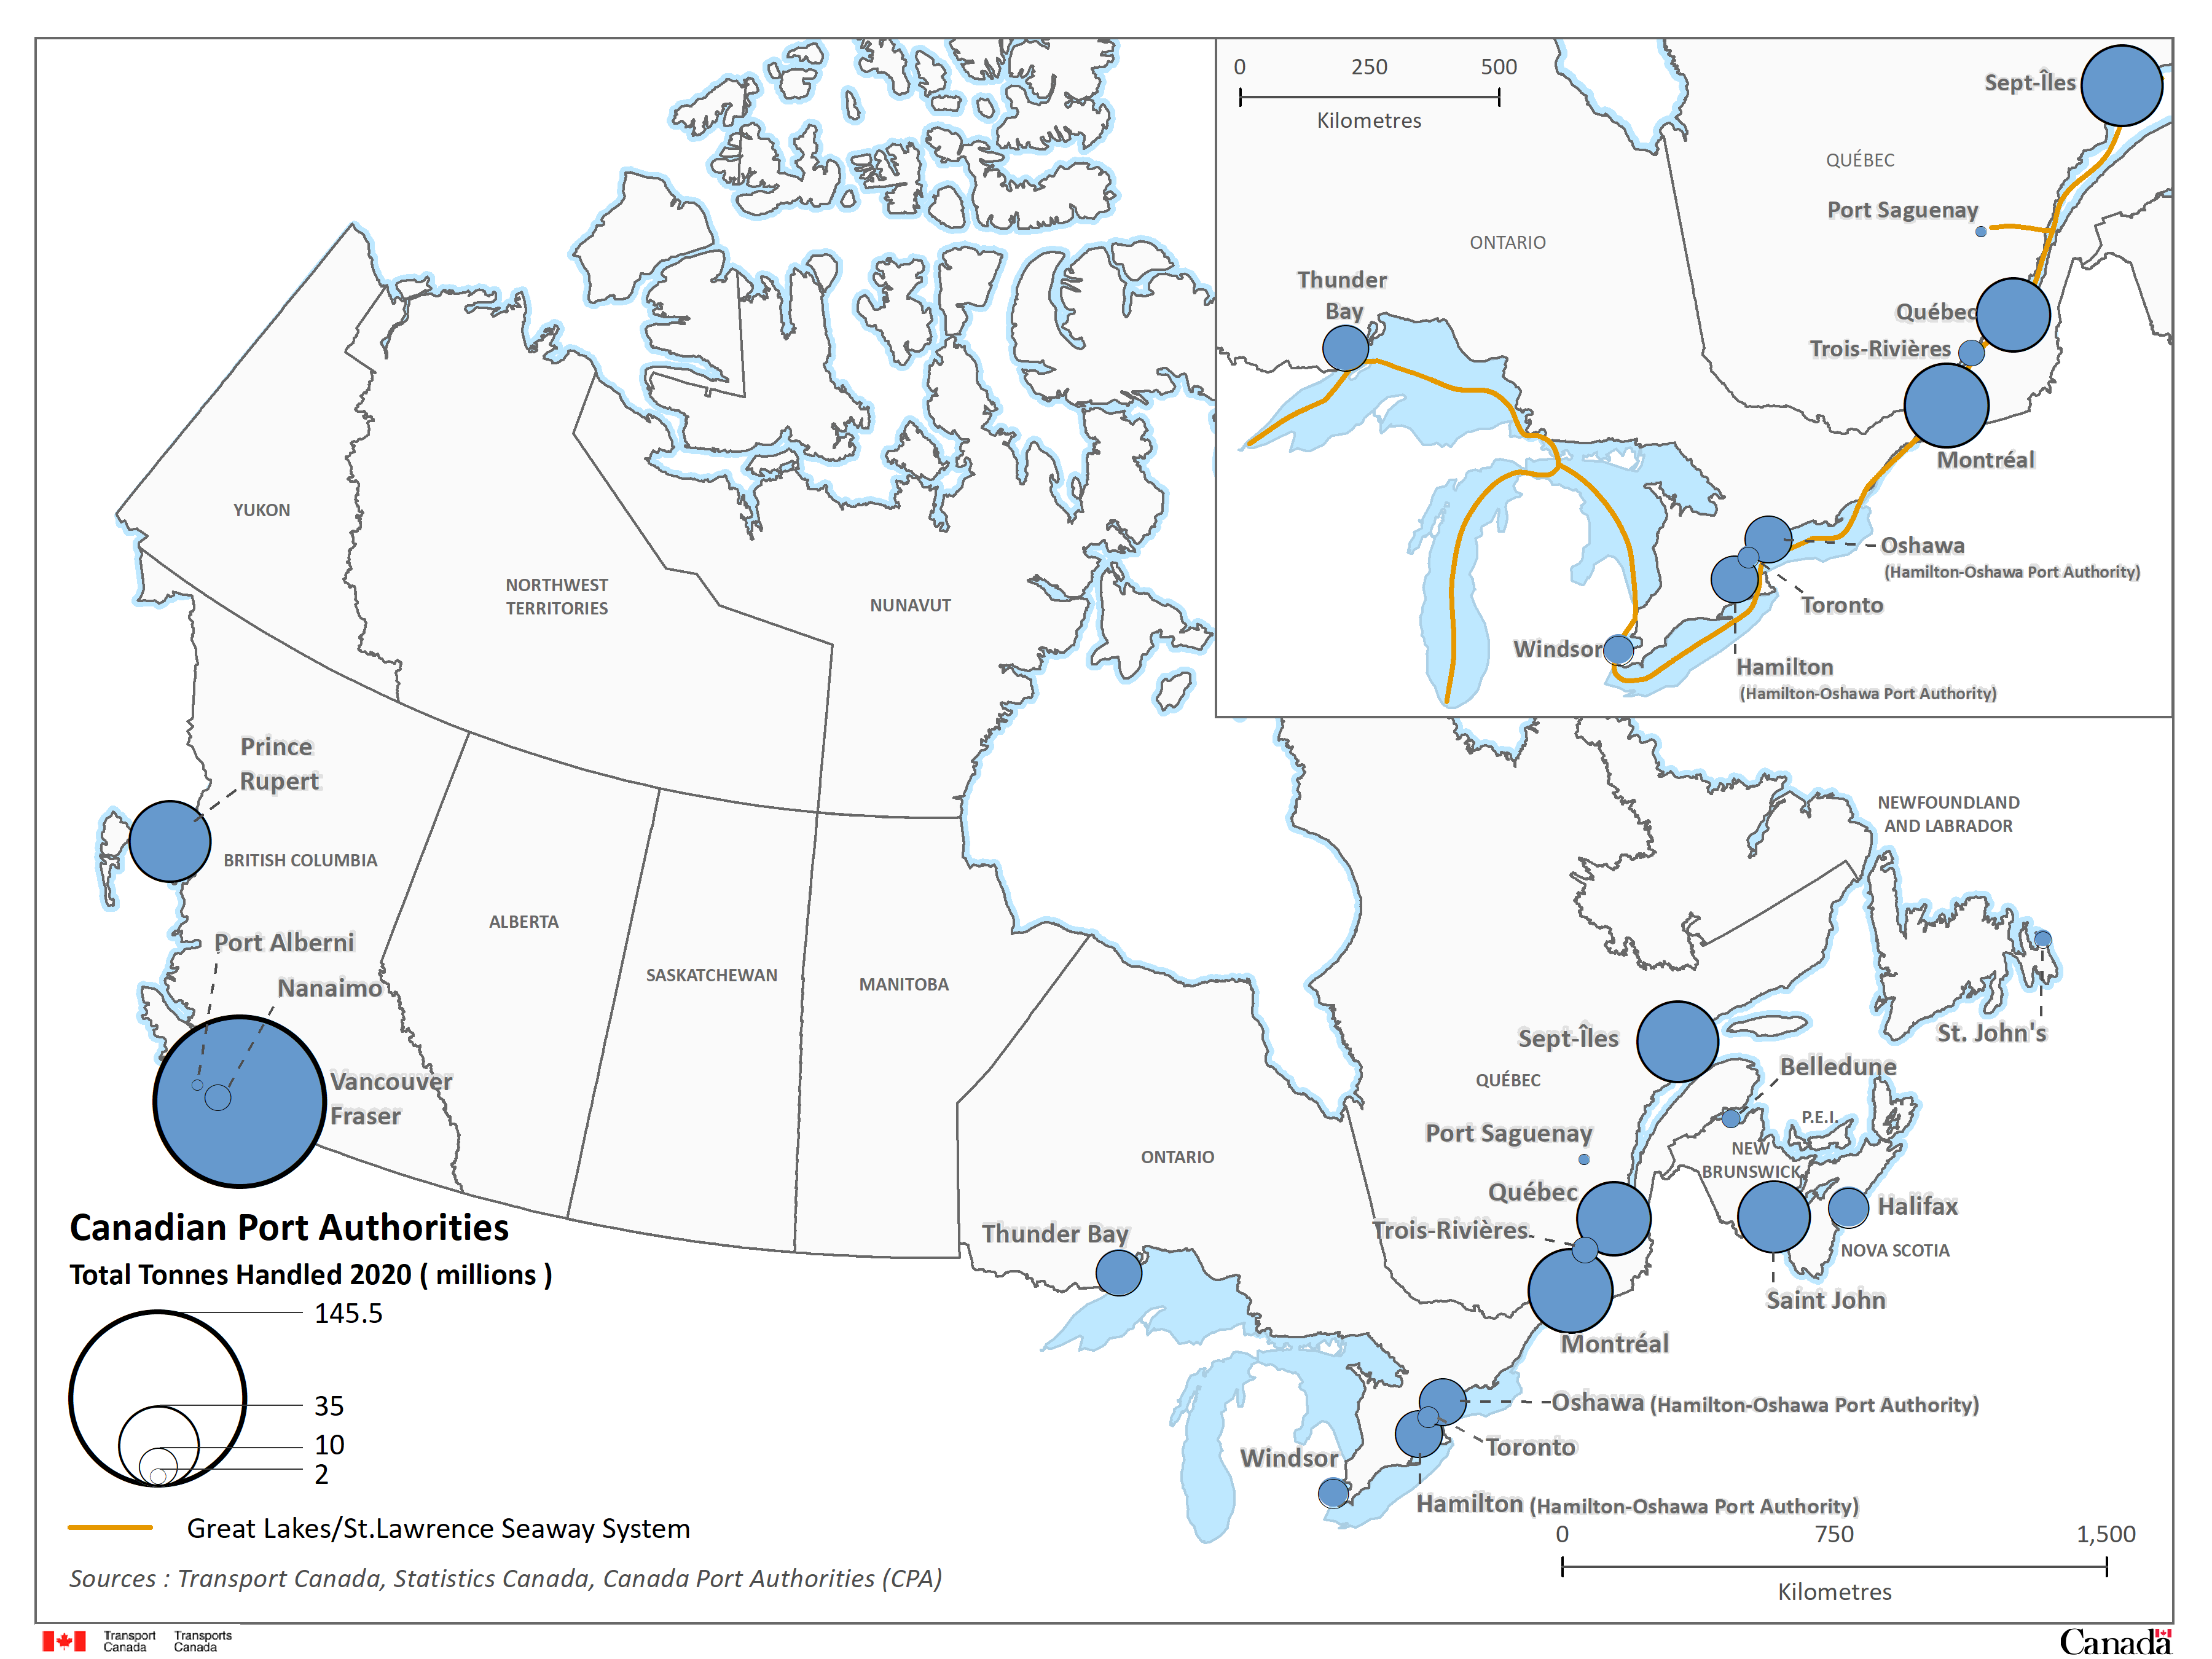
Map 5: Canadian Port Authorities
Image description - Map 5: Canadian Port Authorities
The map of Canada shows the geographical locations of the CPA infrastructure and provides information on the total tonnes handled by each port in 2020. Each port is represented on the map by a blue circle and is graduated in size proportional to the total tonnes handled. The highest total tonnes handled in 2020 was 145.5 million tonnes by Vancouver Fraser Port Authority.
An insert at the top right of the map shows the Great Lakes/St. Lawrence Seaway System (represented by an orange line). This system provides a strategic waterway into the North American Heartland and Overseas markets.
Sources: Transport Canada, Canada's Port Authorities
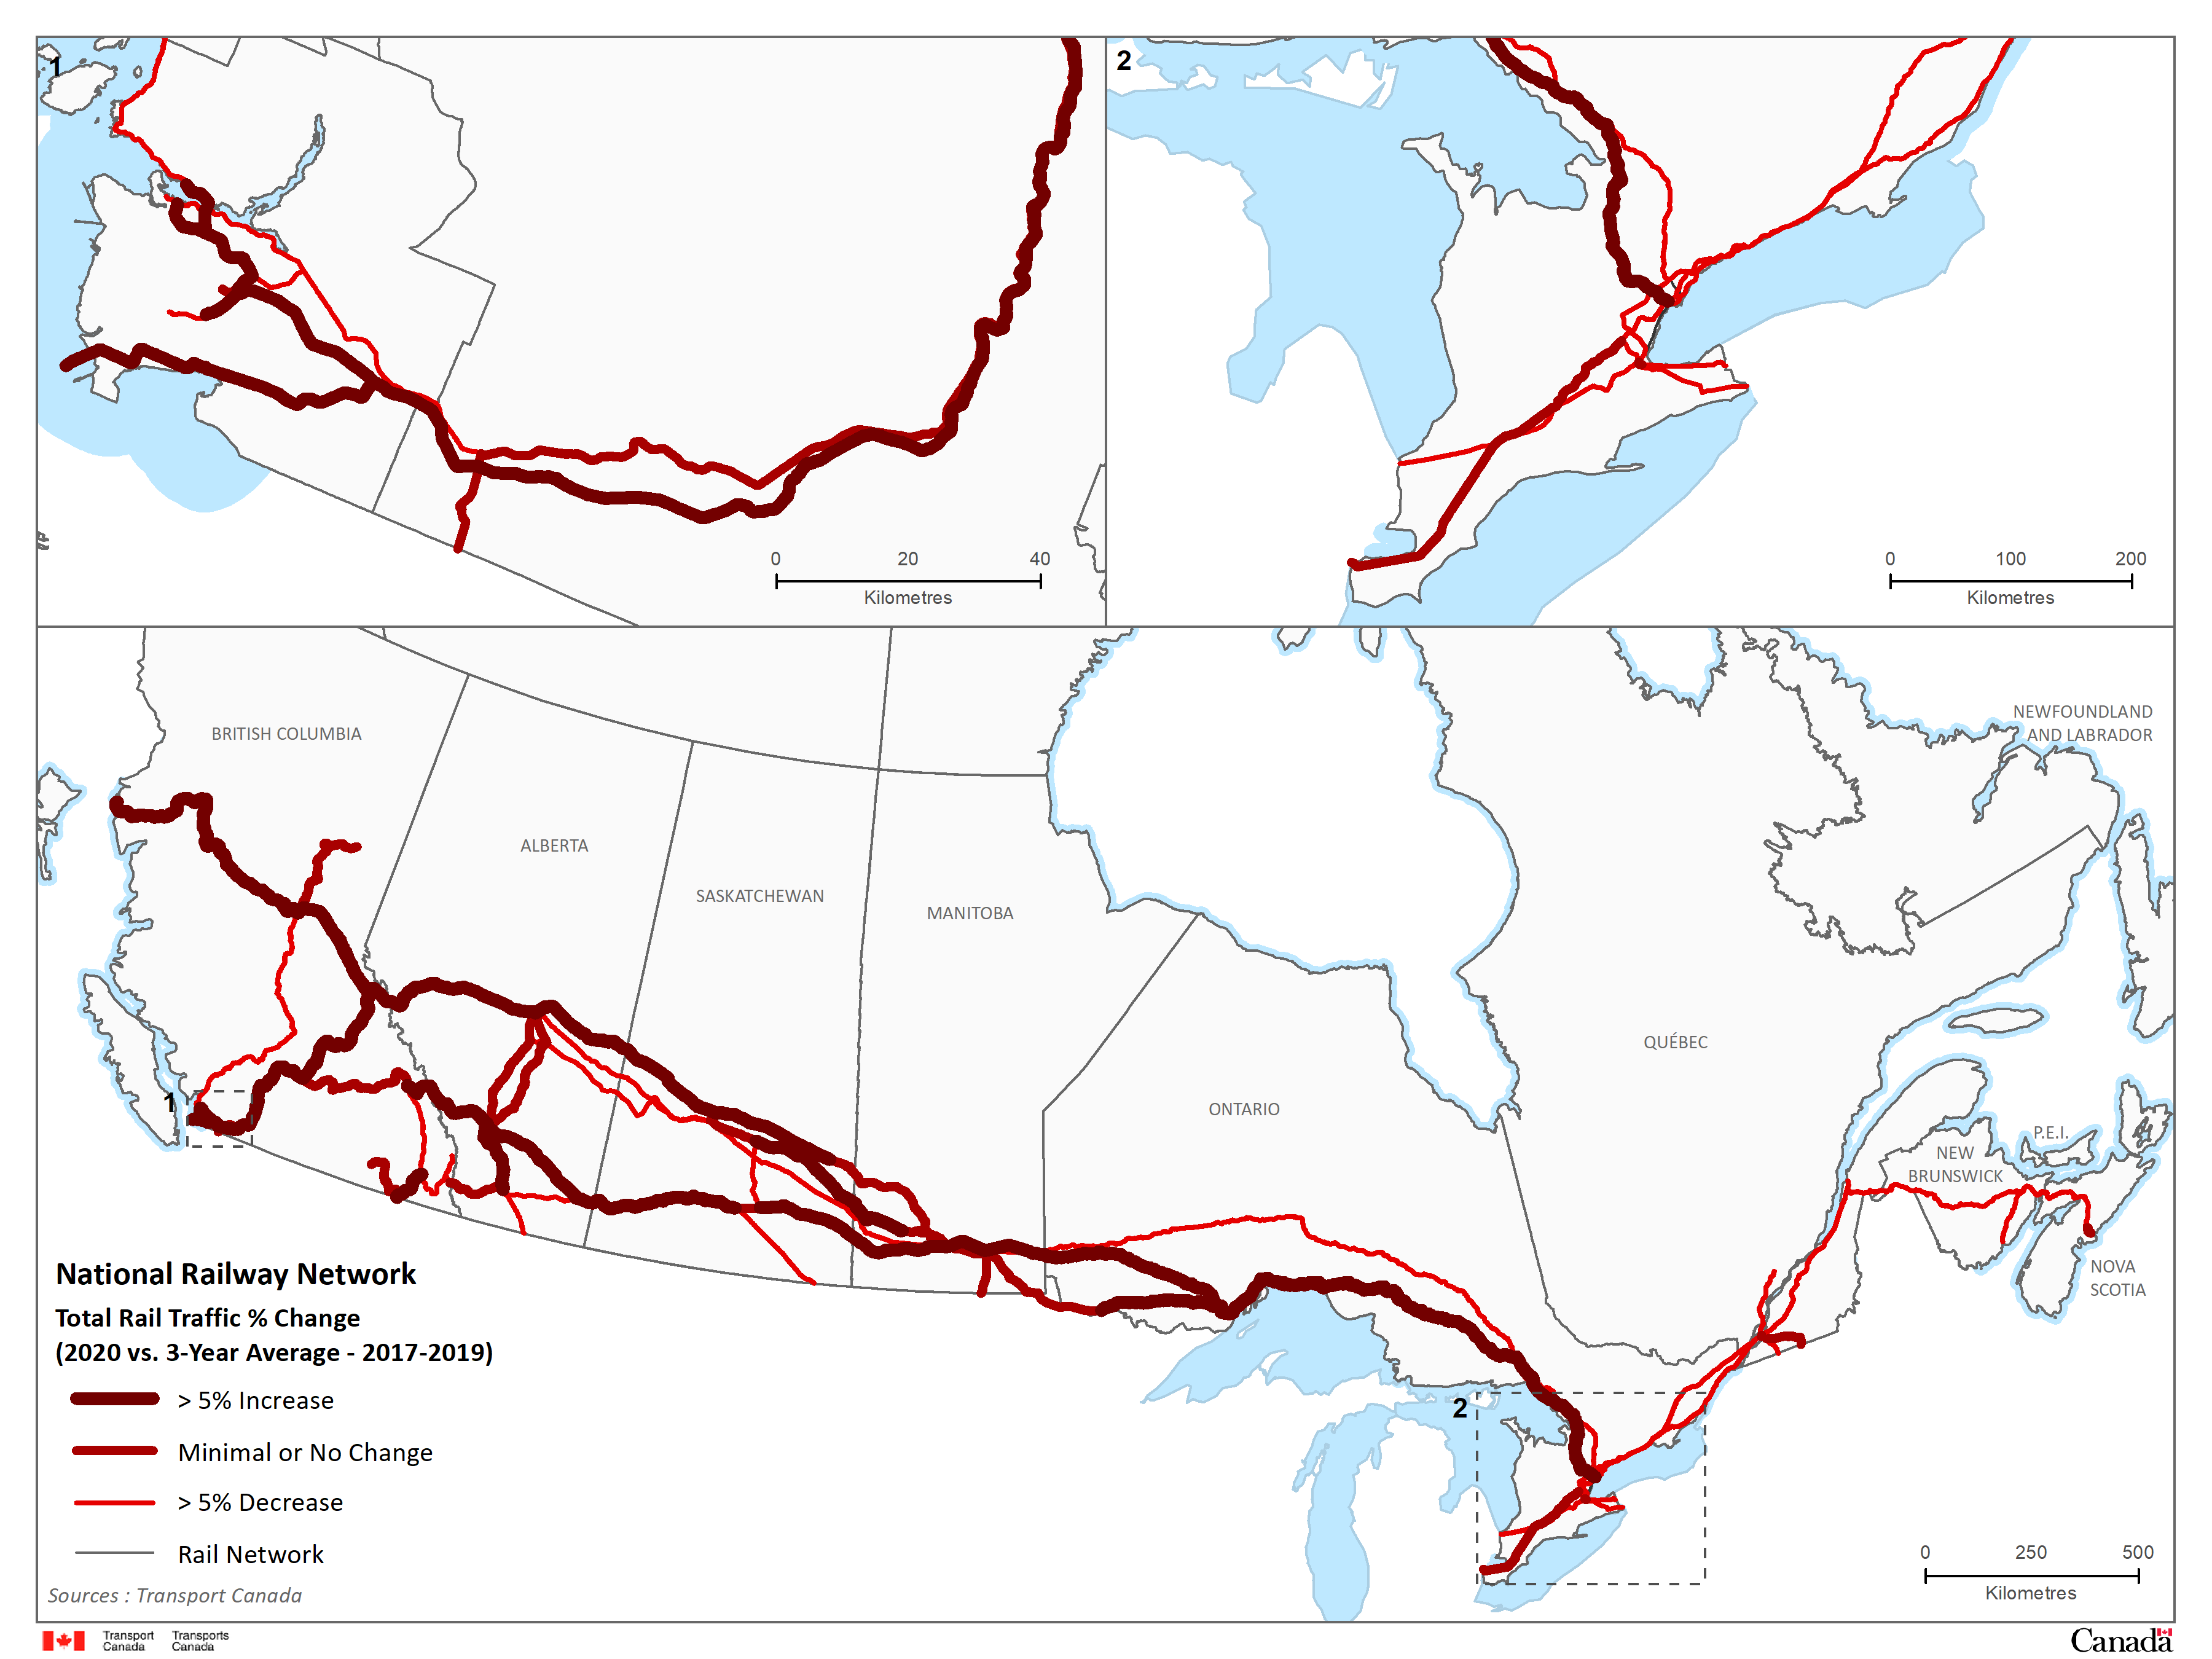
Map 6 - Rail system flow comparison, total traffic 2020 compared to 3 year average
Image description - Map 6: Rail System Flow Comparison: Total Traffic 2020 Compared to 3 Year Average
The map shows the change in total rail traffic flow along Canada’s railway network in 2020 compared to the previous 3-year average.
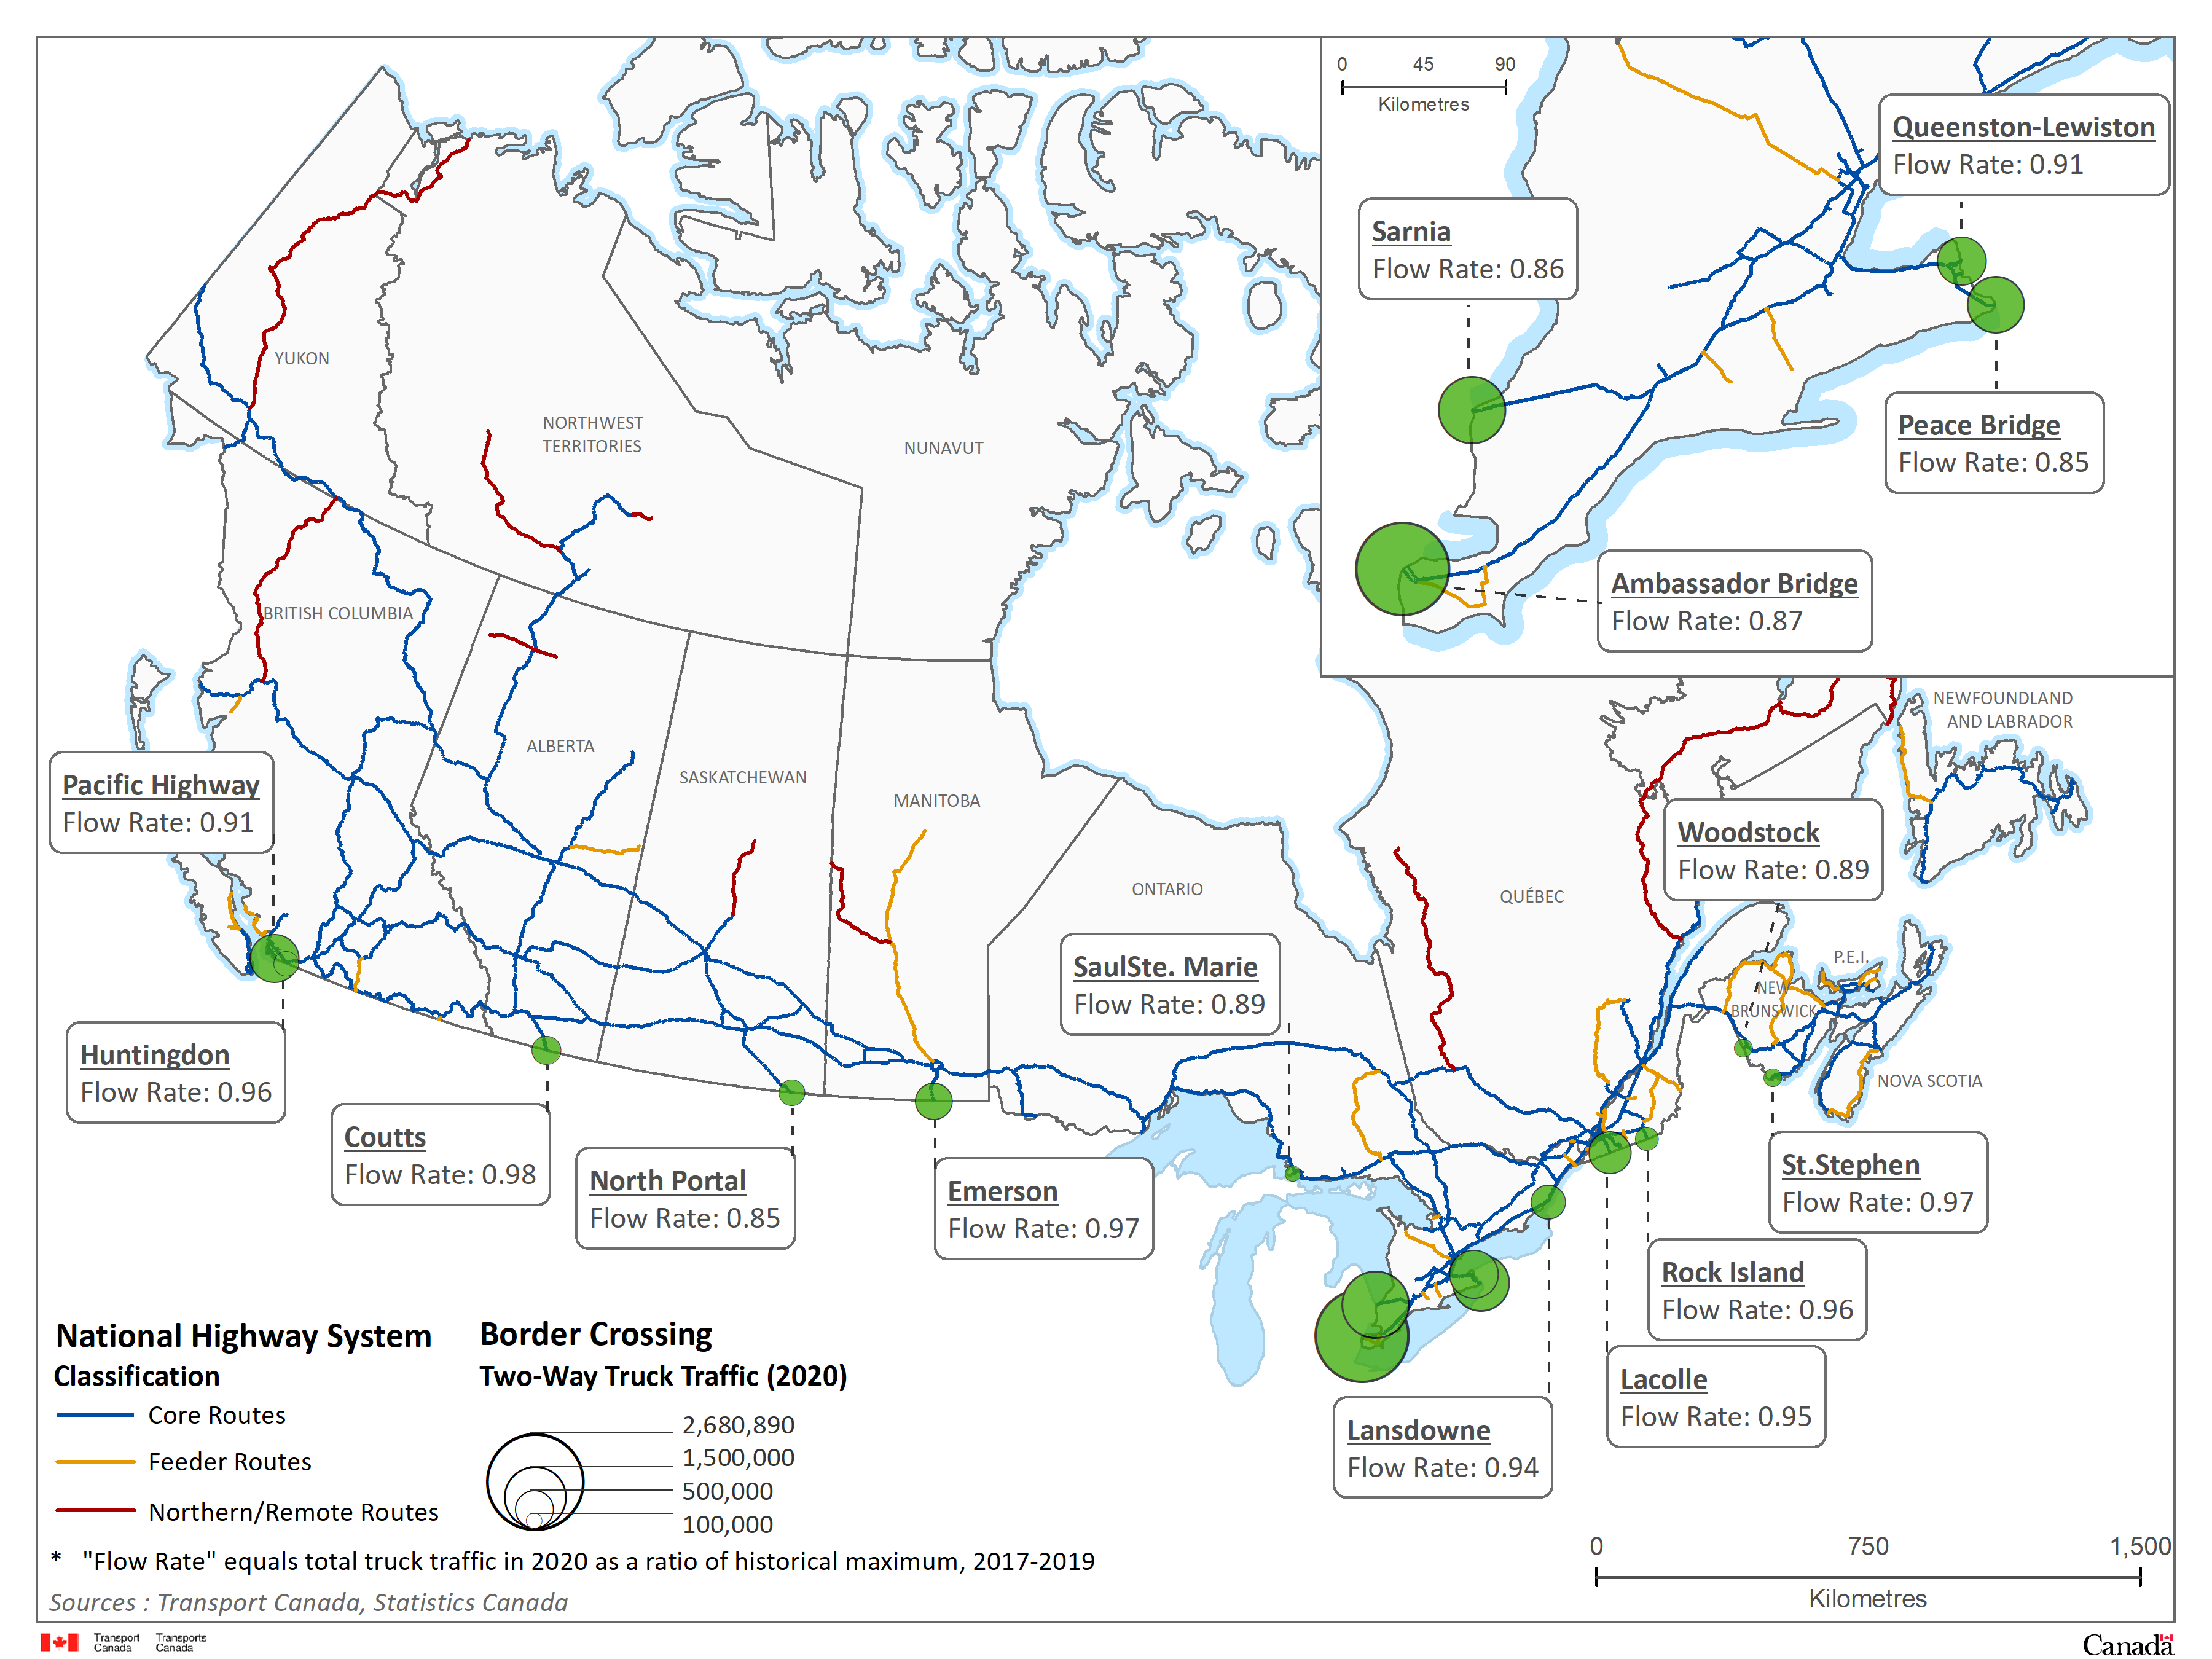
Map 7 - Truck border crossing performance metrics, traffic flows
Image description - Map 7: Truck Border Crossing Performance Metrics: Traffic Flows
The map shows 15 major border crossings along the Canadian – U.S. border. At each border crossing, green circles are used to represent their location and are graduated in size to represent the amount of commercial two-way truck traffic handled in 2020.
Sources: Transport Canada, Statistics Canada
Note: Flow rate equals total truck traffic in 2020 as a ratio of historical maximum, 2017-2019
Map 8 - National Airport System
Image description - Map 8: National Airport System
The map of Canada shows the NAS airports as well as the amount of enplaned/deplaned revenue passengers for each airport. Each airport is identified geographically by an orange circle that also provides information on the enplaned/deplaned revenue passengers in 2020; the larger the circle the higher the number of enplaned/deplaned revenue passengers at this airport.
Sources: Transport Canada, Statistics Canada
Note: "N/A" values were represented cartographically by using a symbol smaller than used for Prince George - 0.5 millions of E/D revenue passengers
List of Addendum Tables and Figures
Transportation and the Economy
General
Table EC1: Economic Indicators, 2020
Table EC2: Transportation Sector GDP and GDP Shares by Province and Territory, 2017
Table EC3: Aggregate Household Final Consumption Expenditures on Transportation, 2020
Table EC4: Volume of Goods in Domestic Trade, by Sector and Mode of Transport, 2009–2018
Merchandise Trade
Table EC5: Modal Shares in Canada’s International Trade, 2011–2020
Table EC6: Modal Shares in Canada-United States Trade, 2011–2020
Table EC7: Modal Shares in Canada-Other Countries Trade, 2011–2020
Table EC8: Canada–United States Trade, by Main Trade Flows, 2019–2020
Table EC9: Canada’s Exports and Imports, by Origin, Destination and Mode of Transport, 2020
Table EC10: Canada’s Merchandise Trade–Top 25 Partners, 2019–2020
Travel and Tourism
Table EC11: Visits by Canadians to All Countries, 2016–2017
Table EC12: Canada - United States Travel, by Mode of Transport and by Purpose, 2017
Table EC13: Canada - Overseas Travel, by Mode of Transport and by Purpose, 2017
Labour
Table EC14: Employment in the Transportation Sector, 2011–2020
Figure EC15: Labour in Transportation Modes in Canada, by Age Range, 2020
Table EC16: Average Weekly Earnings by Selected Transportation Industries, 2011–2020
Table EC17: Labour Actions in the Transport Sector, by Mode, 2010–2019
Price Performance of Transport
Table EC18: Average Crude Oil Prices - Canadian and U.S. $ per Barrel, 2011–2020
Table EC19: Retail Price of Regular Road Gasoline and Diesel For Selected Cities, 2011–2020
Table EC20: Price of Other Transportation Fuels, 2011–2020
Table EC21: Price and Output Indicators, Transport Industries, 2014–2019
Table EC22: Efficiency Indicators, Transport Industries, 2014–2019
Table EC23: Cost Structure of Transport Industries, 2016–2019
Table EC24: Financial Performance of Transportation Industries, 2013–2019
Government Spending and Revenues on Transportation
Table G1: Summary of Transportation Expenditures and Revenues by Level of Government, 2010/11–2019/20
Table G2: Transportation Expenditures and Revenues by Mode and Level of Government, 2010/11–2019/20
Table G3: Detailed Federal Transport Expenditures, by Mode and by Department/Agency, 2010/11–2019/20
Table G4: Government Revenues from Transport Users, 2010/11–2019/20
Table G5: Summary of Provincial Transport Expenditures by Province/Territory, 2010/11–2019/20
Table G6: Detailed Provincial/Territorial Expenditures by Mode and by Province/Territory, 2010/11–2019/20
Environment and Energy
Figure EN1: Greenhouse Gas Emissions, by Economic Sector, 2018
Figure EN2: Greenhouse Gas Intensity of End-Use Sectors, 2009 and 2018
Table EN3: Transportation Energy Consumption, by Type and Mode, 2010–2019
Table EN4: Total Transportation Greenhouse Gas Emissions, All Modes, 2000–2018
Table EN5: Air Pollutant Emissions from the Transportation Sector, by Type of Pollutant, 2010–2019
Figure EN6: Transportation Mode Share of Air Pollutant Emissions, 2019
Table EN7: Aviation Greenhouse Gas Emission Intensity, by Region of Operation, 2009–2018
Table EN8: Aviation Fuel Consumption, by Region of Operation, 2009–2018
Table EN9: National Aerial Surveillance Program Key Metrics, 2010/11–2019/20
Table EN10: Rail Greenhouse Gas Emission Intensity, by Type of Operation, 2009–2018
Table EN11: Railway Fuel Consumption, 2010–2019
Figure EN12: Zero Emission Vehicle (ZEV) Market Share, 2016–2020
Transportation Safety and Security
General
Table S1: Summary of Transportation Safety Statistics for Aviation, Marine, Rail, Road and TDG, 2011–2020
Figure S2: Accidents and Accident Rates per Activity Measure for Rail, Road, Marine and Aviation, 2010–2020
Rail Occurences
Table S3: Railways Under Federal Jurisdiction, Accidents and Incidents, 2011–2020
Table S4: Railways Under Federal Jurisdiction, Accidents by Province/Territory, 2011–2020
Table S5: Railways Under Federal Jurisdiction, Crossing and Trespasser Accidents, 2011–2020
Road Occurences
Table S6: Road Casualty Collisions, Fatalities and Injuries, with Rates (per 10,000 MVR and Billion Vehicle-Kilometres), 2010–2019
Table S7: Road Casualty Rates (Fatalities and Injuries per Billion Vehicle-Kilometres) by Province/Territory, 2018–2019
Table S8: Commercial and Other Vehicles Involved in Fatal Collisions, by Vehicle Type, 2014–2019
Table S9: Fatalities Resulting from Commercial and Other Vehicles Involved in Fatal Collisions, by Vehicle Type, 2014–2019
Table S10: Fatalities by Road User Class, 2014–2019
Table S11: Vehicles Involved in Fatal Collisions, by Vehicle Type, 2014–2019
Marine Occurences
Table S12: Marine Occurrences, 2010–2020
Table S13: Small Canadian Vessels Engaged in Commercial Activity–Marine Occurrences, 2010–2019
Table S14: Small Canadian Vessels Engaged in Commercial Fishing Activity, Marine Occurrences, 2010–2020
Air Occurences
Table S15: Aviation Occurrences and Casualties Involving Aircraft Operating Under CARs, 2015–2020
Table S16: Summary of Aviation Occurrences Reported to the Transportation Safety Board, 2015–2020
Table S17: Canadian-Registered Aircraft (CRA) Accident Rates for Aircraft Operating Under CARs, 2015–2020
Table S18: Accidents Involving Aircraft Operating under CARs, by Province/Territory, 2015–2020
Dangerous Goods Occurences
Table S19: Reportable Accidents Involving Dangerous Goods by Mode and Phase of Transport, 2010–2019
Table S20: Deaths and Injuries Attributed to the Dangerous Goods at Reportable Accidents, 2010–2019
Air Transportation
Airports
Table A1: Number of Aerodromes in Canada 2011–2020
Table A2: Airport Capital Assistance Program Expenditures, by Province/Territory 2011/12–2020/21
Table A3: Airport Authorities Financial Performance, 2019
Table A4: Airport Improvement Fees (AIF) at National Airport System (NAS) Airports 2011–2020
Table A5: Air Travellers Security Charge (ATSC) 2002–2020
Table A6: Top 10 Busiest Canadian Airports in Terms of Aircraft Movements 2011–2020
Aircraft and Licences
Table A7: Licence Authorities Held by Air Carriers as of December 31, 2020
Table A8: Civil Aviation Personnel Licences and Permits by Category as of December, 2020
Table A9: Personnel Licences and Permits, by Province/Territory, as of December, 2019–2020
Table A10: Total Operating Revenues of Canadian Air Carriers, 2010–2019
Table A11: Annual Labour Costs per Employee of Canadian Air Carriers, 2008–2019
Table A12: Average Scheduled Daily Seat-Kilometres, by Air Carrier, Domestic Sector, 2019–2020
Passenger Traffic
Table A13: Competition in the Top, 25 Domestic Air Markets as of December 31, 2020
Table A14: Top, 20 Busiest Canadian Airports in Terms of Enplaned/Deplaned Revenue Passengers, 2011–2020
Table A15: Top 10 Busiest Canadian Airports in Terms of Enplaned/Deplaned Revenue Passengers, by Sector, 2011–2020
Freight Traffic
Table A16: Volume of Traffic Carried by Canadian Air Carriers, 2011–2020
Table A17: Top 10 Busiest Canadian Airports in Terms of Loaded/Unloaded Revenue Cargo, by Sector, 2011–2020
Table A18: Air Exports and Imports, by World Region, 2019–2020
Table A19: Main Commodity Groups Shipped by Air in Canada’s International Trade, 2019–2020
Marine Transportation
Ports
Table M1: Port Classifications, as of December 31, 2020
Table M2: Number of Port Sites Under the Control and Administration of Transport Canada, by Province, 2011–2020
Table M3: Status of Transport Canada Port Facilities, 2020
Financial Profiles
Table M4: Canada Port Authorities (CPA) Financial Results, 2019
Table M5: Canada Port Authorities (CPA) Financial Comparison, 2018–2019
Table M6: Financial Results for Transport Canada Ports, 2011/12–2020/21
Table M7: St. Lawrence Seaway Financial Performance, 2009/10–2018/19
Table M8: Pilotage Authorities Financial Results, 2011–2020
Fleet and Pilotage
Table M9: Total Pilotage Assignments and Assignments Per Pilot, 2011–2020
Table M10: Canadian-Registered Fleet, by Vessel Type, 2000, 2010, and 2020
Vessel Movements
Table M11: Vessel Trips in Canadian Waters, by Vessel Type, 2016–2020
Table M12: Vessel Trips in Canadian Waters, by Vessel Flag, 2016–2020
Freight Traffic
Table M13: Total Tonnage Handled by Canada’s Port Authorities (CPAs), 2011–2020
Table M14: St. Lawrence Seaway Cargo Traffic, 2011–2020
Table M15: St. Lawrence Seaway Traffic, by Commodity, 2011–2020
Table M16: International Cruise Ship Traffic at Selected Canadian Ports, 2011–2020
Table M17: Canada’s Marine Traffic Handled by Canada Port Authorities (CPAs), 2011–2020
Table M18: Canada’s Leading Ports Handling Containerized Freight, 2011–2020
Table M19: Main Commodities Shipped in Canada’s International Marine Trade, by Market, 2020
Table M20: End-to-End Transit Times from Shanghai to Toronto via British Columbia Ports using a Direct Rail Model, 2011–2020
Table M21: Key Performance Indicators for Selected Intermodal Container Ports, 2018–2020
Rail Transportation
Railway Profile
Table RA1: Length of Railways in Canada, 2019
Table RA2: Railway Revenues, 2008–2019
Table RA3: Railway Fleet, 2010–2019
Figure RA4: Average Monthly Train Velocity, by Rail Carrier, 2020
Table RA5: Revenue Tonne-Kilometres, by Railway Sector, 2010–2019
Freight Traffic
Table RA6: Overall Rail Traffic Characteristics, 2011–2020
Table RA7: Traffic Received and Forwarded by Canadian-Based Class II Carriers, 2011–2020
Table RA8: Volume of Rail Exports and Imports, by Commodity, 2011–2020
Table RA9: Value of Rail Exports and Imports by Commodity, 2011–2020
Table RA10: Dangerous Goods Shipments on Rail, 2010–2020
Table RA11: Volume of Rail Exports and Imports, by Province/Territory of Origin, 2011–2020
Table RA12: Value of Rail Exports by Port of Exit and Clearance, 2011–2020
Table RA13: Volume of Rail Marine Exports and Imports, 2011–2020
Table RA14: Volume of Rail Marine Exports and Imports, by Commodity, 2010–2019
Table RA15: CN and CPR Intermodal Traffic, 2011–2020
Passenger Traffic
Table RA16: Passenger and Passenger-Kms for VIA Rail Canada and Other Carriers 2011–2020
Road Transportation
Road Network
Table RO1: Length of the National Highway System, 2017
Table RO2: Length of the Public Road Network in Canada, 2019
Truck - Profile and Activity
Table RO3: Traffic Volume by Canadian For-Hire Carriers, 2014–2018
Table RO4: Canadian International Trade Value Shipped by Trucks, by Commodity Groups, 2019–2020
Table RO5: Canada’s Road Trade with the United States, by Busiest Border Crossing Points, 2019–2020
Table RO6: Twenty Busiest Border Crossings for Cars/Other Vehicles, 2016–2020
Table RO7: Twenty Busiest Border Crossings for Trucks, 2016–2020
Table RO8: Border Wait Times for Southbound Trucks at Selected Crossings, 2020
Table RO9: Annual Trucking Bankruptcies, by Region, 2011–2020
Bus and Urban Transit - Profile and Activity
Table RO10: Bus Industry Revenues by Service Lines, 2009–2018
Table RO11: Urban Transit Passengers Carried and Vehicle-Kilometres, 2010–2019
Table RO12: Urban Transit Fleet Composition, 2010–2019
Table RO13: Average Annual Compensation in the Bus Industry, 2009–2018
Table RO14: Selected Provincial Systems Indicators for Urban Transit, 2019
