
Evaluation report outlining results of the Evaluation of the Airports Capital Assistance Program at Transport Canada.
On this page
- Executive summary
- Background
- Methodology
- Findings: Relevance
- Findings: Performance
- Finding: Efficiency
- Recommendations
- Management Action Plan
- Appendix A: Evaluation Matrix
- Appendix B: Data Tables
Executive summary
Airports capital assistance program (ACAP)
About the evaluation
The evaluation of ACAP assessed the issues of relevance, performance, and efficiency and economy. A variety of data collection methods were used, including: document review, interviews, and data review. The scope of the evaluation covered the period from 2014-15 to 2020-21, and part of 2021-22.
What the evaluation found
There is an ongoing need for safety improvements at small Canadian airports and ACAP helps to address this need. The demand for ACAP funding has remained strong over the seven years covered by the evaluation.
ACAP has contributed to enhancing safety at eligible airports through the provision of funding for safety-related infrastructure projects and mobile equipment. The vast majority of ACAP funding was dedicated to safety-related airside projects, like rehabilitating runways, which serves the dual purpose of enhancing the quality of the infrastructure while also extending its useful life, which in turn, allows the airport to meet safety standards and remain operational. In terms of mobile equipment, and especially for snow removal equipment like sweepers, the standard 20-year lifecycle did not work equally well across the country given Canada’s diverse climatic regions. This situation created funding pressures for airports who use their equipment frequently and were not able to meet the 20-year benchmark.
Over the years examined, it was found that ACAP was delivered in an efficient manner, especially following the centralization of the program. ACAP is currently transitioning to the Surface Infrastructure System (SIS) to help the department standardize and digitize the way it delivers grants and contributions (G&C) programs and to facilitate the analysis and reporting of G&C data. There is a risk that during the transition, program efficiency relating to processing claims will be negatively impacted. Change management strategies are being implemented to offset these risks.
About the program
Created in 1995, ACAP is a contribution program funded through Transport Canada’s existing reference levels. ACAP’s funding envelope is $38 million per year.
The objectives of the program are to: (1) maintain or increase the safety of Canada’s airport system; and (2) contribute to the protection of assets and infrastructure.
Recommendations
The findings from this evaluation led to the following recommendation:
- It is recommended that the Program reexamine the average lifecycle of 20 years for snow-related mobile equipment to determine if it could be better aligned to account for regional differences (e.g., climatic regions).
Background
Program context
Canada’s air transport sector plays a critical role in connecting regions and communities to each other, particularly in rural and remote areas. Contributing to this important role are Canada’s small airports (i.e., ACAP eligible regional and local airports), which make up nearly 40% of the more than 500 airports in Canada. Many of these eligible airports are in smaller, isolated communities, and provide an essential link to the rest of Canada.
Between 2014-15 and 2020-21, there were a total of 200 eligible airports that could apply for ACAP funding. The majority of ACAP eligible airports are owned by provinces or territories (60%); the remainder (40%) are owned by municipalities and other entities (e.g., not-for-profits, airport societies, etc.).
According to document reviews and some interviews, many small airports in Canada are faced with ongoing and evolving challenges to maintain the safety standards required for continued operation. These challenges include:
- Insufficient revenues to cover operating costs;
- Limited sources for funding capital projects;
- Potentially increased costs associated with meeting new regulatory requirements (e.g., emergency services, security, winter maintenance, and wildlife control); and
- Reduced revenues as a result of reduced passenger traffic volumes (e.g., consolidation of airlines, COVID-19 travel restrictions and containment measures).
In keeping with the 1994 National Airports Policy (NAP), the federal government recognized that capital investments for major infrastructure projects would be beyond the means of non-federally owned airports. As part of the NAP divestiture process, ACAP was implemented to provide a source of funds for safety projects at regional and local airports.
Program description
Implemented in 1995, ACAP is a contribution program funded through Transport Canada’s existing reference levels. ACAP’s funding envelope is 38 million per year; it has remained unchanged since 2000.
The objectives of the program are: (1) to maintain and/or increase the safety of Canada’s airport system; and (2) to contribute to the protection of assets and infrastructure.
The program funds projects based on three priority levels:
Priority 1: Safety-related airside projects such as rehabilitation of runways, taxiways, aprons, associated lighting, visual aids, sand storage sheds, utilities to service eligible items, related site preparation costs including directly associated environmental costs, aircraft firefighting equipment and equipment shelters which are necessary to maintain the airport’s level of protection as required by regulation.
Priority 2: Heavy airside mobile equipment (safety-related) such as runway snowblowers, runway snowplows, runway sweepers, spreaders, winter friction testing devices, and heavy airside mobile equipment shelters.
Priority 3: Air terminal building/groundside (safety-related) such as sprinkler systems, asbestos removal, barrier-free access.
ACAP funding is provided to eligible airports on a cost-sharing basis, based on passenger volumes.
- Airports with less than 50,000 scheduled commercial passengers per year are funded 100% by the Program.
- There is a five percent (5%) reduction in funding level per additional 25,000 passengers up to 524,999 scheduled commercial passengers.
Methodology
Evaluation context
Evaluation scope
- The evaluation was conducted by Transport Canada’s Evaluation and Advisory Services (EAS).
- The evaluation covered the period between 2014-15 and 2020-21, and part of 2021-22.
- ACAP is subject to the mandatory evaluation provisions listed in section 42.1 of the Financial Administration Act, which requires that all programs of grants or contributions be evaluated every five years. Due to this requirement, ACAP has been evaluated on four separate occasions since the year 2000 (e.g., 2000, 2004, 2009, and 2015).
Evaluation questions
- The evaluation questions focused on the core issues of relevance, performance, and efficiency and economy. These questions are listed in the ACAP Evaluation Matrix (refer to Appendix A).
Evaluation challenges and limitations
- In general, quantitative data to demonstrate the impact of certain capital projects were not readily available. ACAP must rely on funding recipients to provide this airport-specific data and, in most cases, ACAP funded airports lack the capacity to track this data in a reliable and rigorous manner.
Evaluation methods
- A mixed-methods approach was utilized. Data collection methods included:
- Document Review
- Review of program foundational documents, external documents such as studies and reports, and government priority setting documents, to inform issues of relevance and performance.
- Interviews (n=35)
- Semi-structured individual and group interviews, comprised of:
- Internal stakeholders (18)
- External stakeholders: Recipients (12); and Industry Associations (5) representing six industry associations;
- Semi-structured individual and group interviews, comprised of:
- Data Review (where available)
- Review of performance-related data
- Review of program-related operational data
- Review of human resource and financial data
- Document Review
ACAP Results Chain
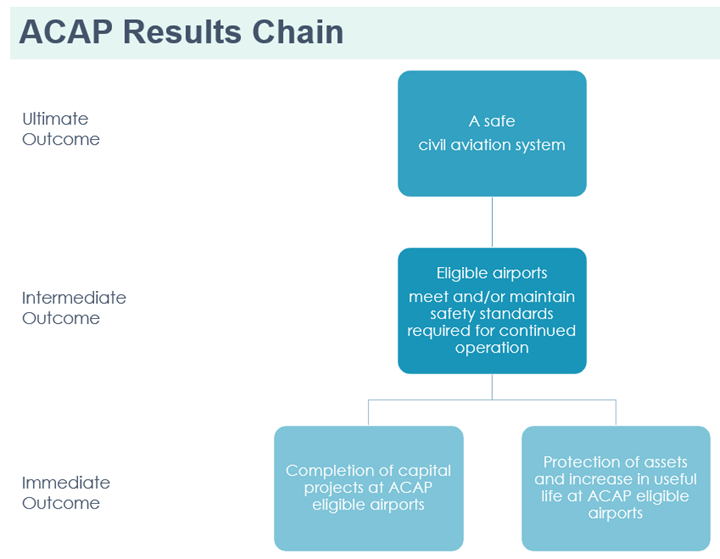
Source: Airports Capital Assistance Program (ACAP) Terms and Conditions, 2020
Text version - ACAP Results Chain
This figure displays four hierarchical relationship boxes, progressing from top to bottom. Each box identifies an outcome related to the ACAP result chain.
At the top, the first box represents the ultimate outcome “A safe civil aviation system”.
In the middle, the first box represents the intermediate outcome “Eligible airports meet and/or maintain safety standards required for continued operation”.
At the bottom, there are two boxes representing the immediate outcomes. The first box represents the “Completion of capital projects at ACAP eligible airports” immediate outcome. The second box represents the “Protection of assets and increase in useful life at ACAP eligible airports” immediate outcome.
Findings: Relevance
Program relevance
Finding: There is an ongoing need for safety improvements at small Canadian airports. Demand for ACAP funding has remained strong over the seven years covered by the evaluation.
Figure 1, on the next page, shows that ACAP received a total of 408 applications between 2014-15 and 2020-21. The number of applications received for funding over this period has been variable, with a strong increase from 2019-20 to 2020-21. Interviewees noted that the demand for ACAP funding is expected to increase over the next several years due to the two-year increase in ACAP funding (2021-22 to 2022-23) in response to the COVID-19 pandemic.
There are a few reasons for the varying number of applications received over this period, and these factors are generally not within the control of ACAP program management.
- The types of projects that the ACAP can fund are subject to asset lifecycles, so the volume of applications may increase or decrease based on where assets are in their lifecycle.
- Recipients like the province of Ontario, which owns many airports, often choose to submit applications in batches in one year, so the volume of applications may increase or decrease accordingly.
About 50% of applications that were not approved for funding between 2014-15 and 2020-21 were placed on a reserve list. These “reserved” applications have also contributed to the demand for ACAP and these projects will remain on a reserve list until ACAP funding becomes available. Interviewees indicated that some of their projects received funding after two to three years in the queue.
Survey results from the Program’s annual survey (i.e., a 3-year forecast on the demand for ACAP funding) also revealed that the estimated future demand for ACAP funding has remained strong, greatly exceeding the annual program budget of $38 million. For example, in 2019-20, survey results found that the forecasted demand for ACAP funding to support capital investments over the next three fiscal years (2021-22 to 2023-24) ranged from 104.4 million to 224.7 million to finance 249 eligible projects.
Figure 1. Number of ACAP applications received, 2014-15 to 2020-21
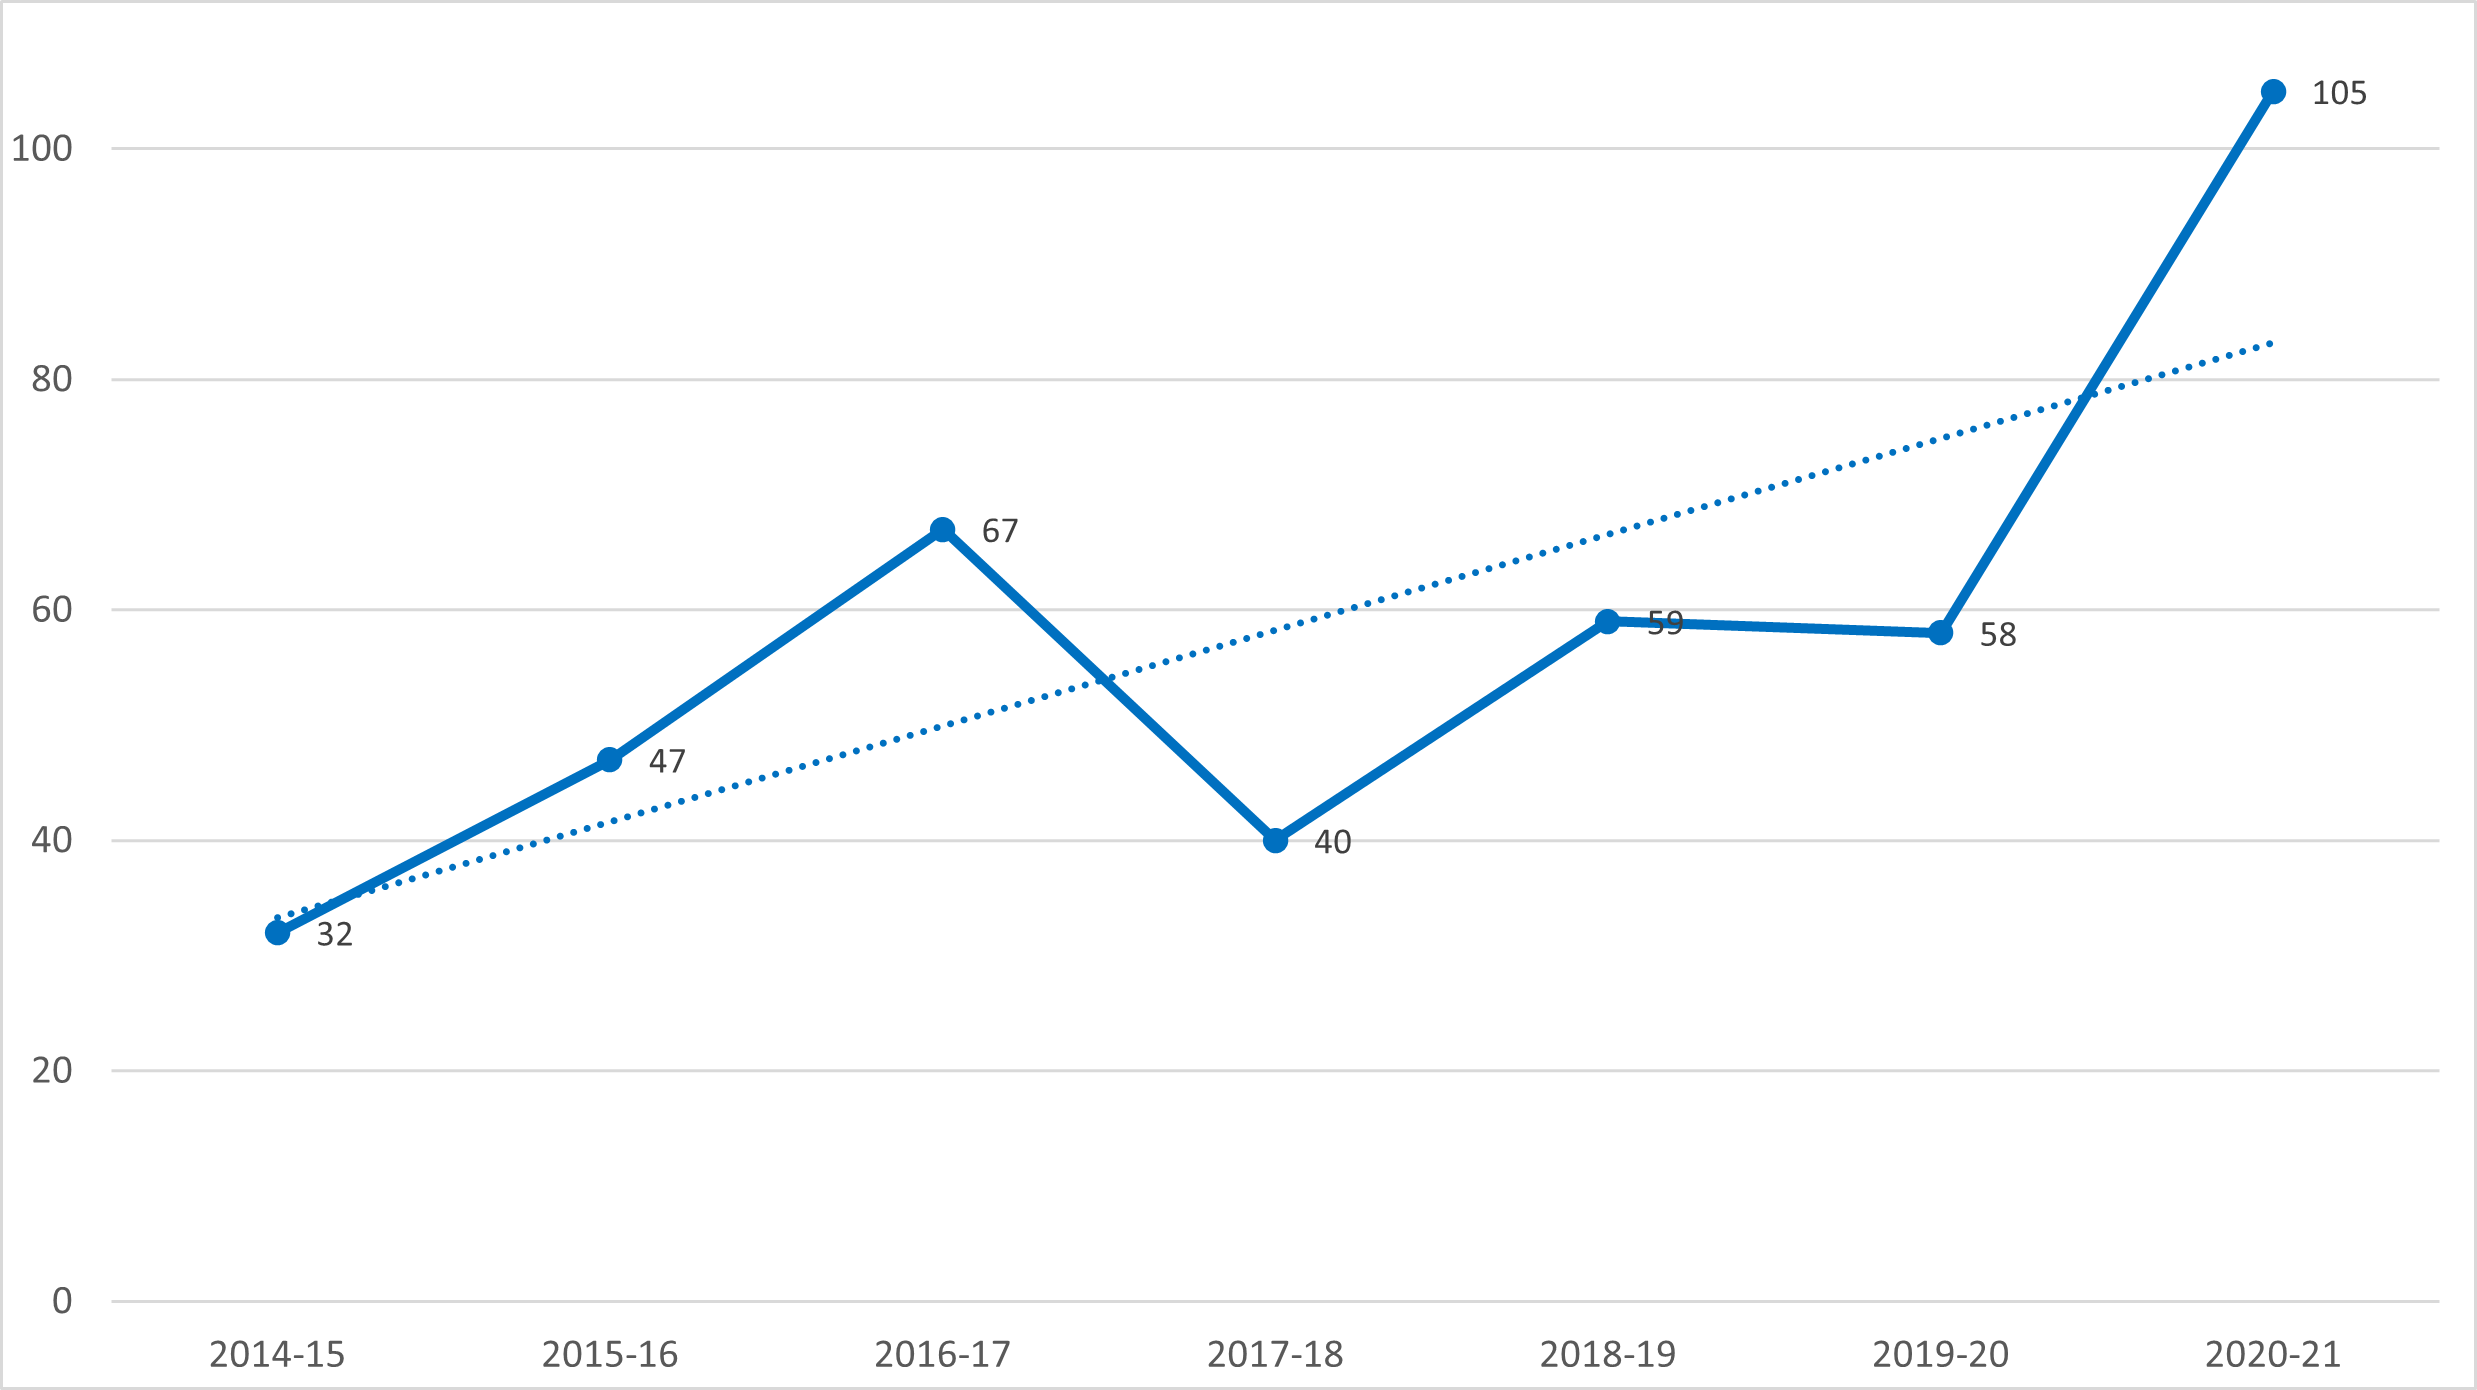
Source: Program data, March 2022. Note 1: ACAP does not track applications by project types and priorities. Note 2: There were a total of 200 eligible airports that could apply for ACAP funding between 2014-15 and 2020-21.
Text version - Figure 1. Number of ACAP applications received, 2014-15 to 2020-21
This figure shows a line graph with a linear trend line. The line graph illustrates the number of ACAP applications received for funding, from 2014-15 to 2020-21. ACAP received a total of 408 applications over this period.
ACAP received the lowest number of applications in 2014-15, at 32 applications, followed by 47 applications in 2015-16, and 67 applications in 2016-17. The number of applications received continued to vary, with 40 applications in 2017-18, 59 applications in 2018-19, and 58 applications in 2019-20. ACAP received the highest number of applications in 2020-21, at 105 applications.
The trend line on this graph indicates that over time, the number of applications received for ACAP funding is increasing.
Program relevance
Finding: There is an ongoing need for safety improvements at small Canadian airports. Demand for ACAP funding has remained strong over the seven years covered by the evaluation. (cont’d)
“The program is essential for our airport...we wouldn’t be able to function without ACAP. All the ACAP funded projects that we got are essential to the survival of this airport.”
“...without ACAP, the safety level would decrease, and there would be airports that will lose certification. ACAP is essential to keeping air traffic moving in the province and country.”
There is a perception among stakeholders that the existing funding is insufficient to address airport infrastructure safety issues.
The 2015 Review of the Canada Transportation Act recommended that the Government of Canada “significantly increase funding for the ACAP to support safer, more efficient, reliable services at regional and local airports.”
Interviewees agreed that ACAP funding is essential to support their capital projects to maintain safety levels at regional and local airports, noting that some airports still find it difficult to cover their share of project costs.
Federal funding is required to complete capital projects.
Interviewees noted that without ACAP funding, many projects would not proceed, and some projects would be delayed or be slower to complete.
Interviewees also noted that without ACAP funding, many small airports would be unable to maintain safety standards as required by regulations, and, as a result, would lose their airport certification and cease operations.
Additionally, some interviewees mentioned that it would not be possible to transfer the costs of completing capital projects to travelers (e.g., greater fare increases) because this could result in significant decreases in passenger traffic.
Findings: Performance
Program performance
Finding: ACAP has been successful in achieving its immediate outcomes by providing funding so that capital projects can be completed and mobile equipment purchased. Specifically, ACAP funded 240 projects and awarded $301.7 million in contributions over the evaluation period.
At a glance, ACAP’s funding statistics:
Figures 2 and 3 on the next two pages illustrate that over the seven-year period from 2014-15 to 2020-21, a total of $301.7 million in ACAP contributions were awarded to 240 completed projects. (Appendix B includes the data tables for these figures).
Of the $301.7 million awarded to airport recipients, approximately 90% of the funding was allocated to Priority 1 projects.
The largest proportion of projects (30.8%) were funded in the Prairie and Northern Region (PNR) between 2014-15 and 2020-21, accounting for $128.2 million (42.5%) of the total ACAP budget. The amount of funding in the PNR reflects the high number of ACAP-eligible airports in this region. Specifically, 43.5% of ACAP eligible airports are in the PNR (87 of 200). Most of the region’s funding (43.7%) was allocated to Priority 1 projects.
Though the Pacific Region (PAC) has about half the number of eligible airports (22) when compared to the Ontario Region (46), PAC received the second highest number of funded projects (64 projects) and the second highest amount of approved funding ($70.6 million).
Interviews with program staff indicated that 60.9% of eligible airports in Ontario (28 airports) have not applied for ACAP funding in recent years. The majority of these airports are owned by Ontario’s Ministry of Transportation and funding applications are typically sent in batches, which is not within the control of ACAP program staff.
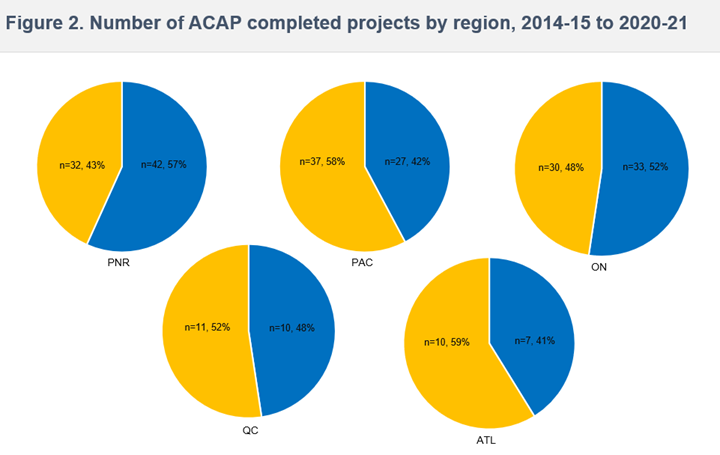
Source: Program data, April 2022. Note 1: A completed project is defined as one for which all forecast payments were made by year-end 2020-21 (March 31, 2021). Note 2: Based on this definition, two projects were not included in the analysis. Note 3: The chart does not include a Priority 3 project (n=1) that was awarded to the Quebec region in the amount of $ 0.1 million between 2014-15 and 2020-21.
Text version - Figure 2. Number of ACAP completed projects by region, 2014-15 to 2020-21
This figure displays five pie charts. Each pie chart provides the distribution of the type of projects completed by Transport Canada's five regions, from 2014-15 to 2020-21. Over this period, 119 Priority 1 projects were completed, representing Airside Rehabilitation & Aircraft Rescue and Firefighting, and 120 Priority 2 projects were completed, representing Mobile Equipment.
In the Prairie and Northern Region (PNR), 42 (57%) Priority 1 projects and 32 (43%) Priority 2 projects were completed. The largest proportion of the projects were funded in PNR.
In the Pacific Region (PAC), 27 (42%) Priority 1 projects and 37 (58%) Priority 2 projects were completed.
In the Ontario Region (ON), 33 (52%) Priority 1 projects and 30 (48%) Priority 2 projects were completed.
In the Quebec Region (QC), 10 (48%) Priority 1 projects and 11 (52%) Priority 2 projects were completed.
In the Atlantic Region (ATL), 33 (52%) Priority 1 projects and 30 (48%) Priority 2 projects were completed. The smallest proportion of the projects were funded in ATL.
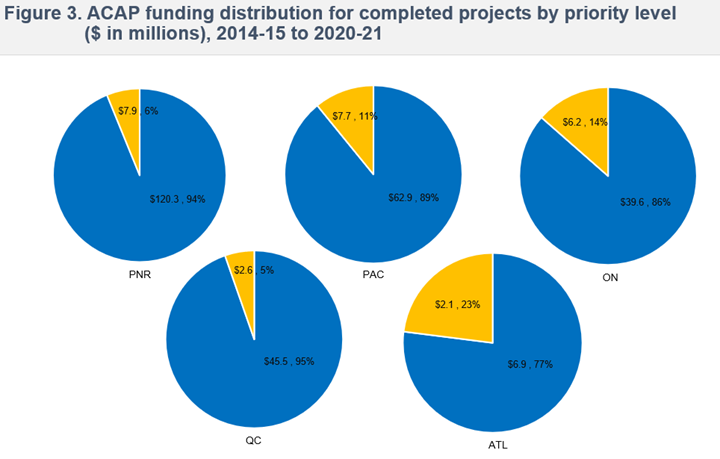
Source: Program data, April 2022. Note 1: A completed project is defined as one for which all forecast payments were made by year-end 2020-21 (March 31, 2021). Note 2: Based on this definition, two projects were not included in the analysis. Note 3: The chart does not include a Priority 3 project (n=1) that was awarded to the Quebec region in the amount of $ 0.1 million between 2014-15 and 2020-21.
Text version - Figure 3. ACAP funding distribution for completed projects by priority level ($ in millions), 2014-15 to 2020-21
This figure displays five pie charts. Each pie chart provides the distribution of the funding amounts by the type of projects completed by Transport Canada's five regions, from 2014-15 to 2020-21. Over this period, $275.2 million was allocated to Priority 1 projects, representing Airside Rehabilitation & Aircraft Rescue and Firefighting, and $26.4 million was allocated to Priority 2 projects, representing Mobile Equipment.
In the Prairie and Northern Region (PNR), $120.3 million (94%) was allocated to Priority 1 projects and $7.9 million (6%) was allocated to Priority 2 projects. PNR received the largest proportion of funding.
In the Pacific Region (PAC), $62.9 million (89%) was allocated to Priority 1 projects and $7.7 million (11%) was allocated to Priority 2 projects.
In the Ontario Region (ON), $39.6 million (86%) was allocated to Priority 1 projects and $6.2 million (14%) was allocated to Priority 2 projects.
In the Quebec Region (QC), $45.5 million 95%) was allocated to Priority 1 projects and $2.6 million (5%) was allocated to Priority 2 projects.
In Atlantic Region (ATL), $6.9 million (77%) was allocated to Priority 1 projects and $2.1 million (23%) was allocated to Priority 2 projects. ATL received the smallest proportion of funding.
Program performance
Finding: ACAP has been successful in achieving its immediate outcomes by providing funding so that capital projects can be completed and mobile equipment purchased. Specifically, ACAP funded 240 projects and awarded $301.7 million in contributions over the evaluation period. (cont’d)
The evaluation found that ACAP funded projects have contributed to improving safety at airports. Internal and external interviewees agreed that safety-related improvements such as airside rehabilitations (e.g., runways, taxiways, aprons), and improvements to heavy airside mobile equipment (e.g., snowblowers, snowplows, sweepers) greatly enhances safety at airports.
Further, according to findings from document reviews and interviews, mobile equipment funded projects have also contributed directly to protecting and maintaining airport assets and infrastructure (e.g., essential mobile equipment for snow and ice removal to protect and maintain runway assets and reduce weather damages and help to reduce airport closures due to inclement weather).
To demonstrate the contributions (and to some extent, the impacts) of ACAP on the safety of airports, two recipient airports were selected to showcase the results of their ACAP funded projects between 2014-15 and 2020-21.
- The first example selected is Red Lake Airport (ON region), which illustrates a very small airport with less than 50,000 passengers per year and, thus, qualifies for 100% of ACAP funding.
- The second example selected is Grande Prairie Airport (PNR region), which illustrates a small airport with more than 350,000 passengers per year and, thus, qualifies for 25% of ACAP funding.
Red Lake Airport (ON)
Red Lake is a municipality located 535 kilometres northwest of Thunder Bay and less than 100 kilometres from the Manitoba border. The municipality consists of six small communities, including Balmertown, Cochenour, Madsen, McKenzie Island, Red Lake and Starratt-Olsen, with a population of approximately 4500 people.
Red Lake’s major industries are gold mining, tourism, forestry, and transportation. The town acts as a cargo, passenger, and tourism hub for Northwestern Ontario and services over 20 northern communities. The residents and the stakeholders of the gold mines, forestry and tourism industries rely on the airport and the airlines to provide dependable passenger and cargo services.
Background:
ACAP funded five projects between 2014-15 and 2020-21, representing $11.1 million in contributions awarded to three airside rehabilitation projects [i.e., 1) runway, taxiway, apron; 2) electrical; and 3) lighting] and two mobile equipment projects [i.e., 1) de-icing trailer and 2) sweeper].
Among the projects funded, the airport received 10 million in 2018-19 toward the Rehabilitation of Runway 08-26, Taxiway A, B, C and Air Terminal Building Apron IIA, which accounts for 95.9% of total funding. The project experienced delays due to weather conditions and runway closures. This project was completed in 2021.
Results:
- Improved airport safety to maintain safety levels required for continued operation. “We would have lost our airport certification because our runway would have cracks.”
- Anecdotally, interviewees reported reduced maintenance costs and failures of airport infrastructure and assets post project completion (e.g., less lighting failures due to replacement and upgrade of the system).
Grande Prairie Airport (AB)
Grande Prairie is in northwest Alberta, 450km northwest of Edmonton and 160km east of the Rocky Mountains. The Peace River County consists of the City of Grande Prairie (with a population of approximately 64,000 people); the towns of Beaverlodge, Sexsmith, and Wembley; and the village of Hythe. Grande Prairie is a major northern hub providing services and support to the agriculture, forestry, and petroleum industries. Grande Prairie is home to over 900 businesses supporting the petroleum industry.
The Grande Prairie Airport serves the community of Grande Prairie and the surrounding area as a regional transportation hub. The Grande Prairie Airport is functioning as the preferred airline hub for all flights north and south, providing service to communities in Northern Alberta and beyond. Travelers can fly direct to the major international hubs of Vancouver and Calgary.
Background
- ACAP funded five projects between 2014-15 and 2020-21, representing $6.9 million in contributions awarded to:
- two airside rehabilitation projects: runway and apron; and, wildlife fence.
- two Aircraft Rescue and Fire Fighting (ARFF) projects: fire trucks and shelters; and, mobile equipment project (i.e., friction tester and Runway Condition Reporting System).
- the airport received funding in 2019-20 to install a wildlife fence. The existing wildlife fence was inadequate and allowed wildlife uncontrolled access to airside/runway areas, creating a safety issue. The fence was approximately 50 years old.
Results:
- Provided adequate protection from wildlife incursions to ensure airport safety and to meet regulations (i.e., Wildlife Control Procedures Manual 4th Edition).
- Following the installation of the new fence, aviation incident data from CADORS show that there have been no wildlife incursions related to deer and moose at the airport. Prior to installing the new fence in 2019-20, the airport reported 12 wildlife incursions, including seven moose incidents and five deer incidents between 2014 and 2020.
- Helped Grande Prairie to “maintain and supply that level of safety” at the airport through improved airside rehabilitations of runway and apron areas, along with essential airside equipment.
Source: Civil Aviation Daily Occurrence Reporting System (CADORS)
Finding: ACAP funding has contributed to extending the life of airport infrastructure by improving asset conditions and, in turn, airport assets remain operational.
In response to a recommendation made in the 2015 evaluation report to improve the asset life performance measure, the Program updated the indicator in 2016, as follows:
- Revised indicator: “Extend life of airport infrastructure by improving asset conditions”
- Original indicator: “# of years the life of the asset has been increased as a result of ACAP funding”
Evidence suggests that ACAP has contributed to maintaining existing airport infrastructure by improving asset conditions at funded airports. For example, by rehabilitating a runway, the conditions of that runway are improved. Program staff and subject matter experts (i.e., engineers) estimate that, in general, runway rehabilitations extend the life of a runway to approximately 20 years. When the condition of an asset has been improved, it will last longer, enabling the airport to remain operational so that travelers can continue to utilize and access the airport.
It should be noted that specific, quantitative data on asset life is not systematically tracked by the Program. Due to this, quantitative analyses on asset life for ACAP funded projects was not possible.
Asset life expectancies must expire before eligible airports can re-apply for ACAP funding for that specific asset.
- For example, for all completed construction projects (Priority 1; n=119), the new estimated asset life expectancy is between 20-40 years, depending on the type of project, according to program staff.
- For completed mobile equipment projects (Priority 2; n=120), the estimated asset life expectancy is between 10-25 years, depending on the type of equipment, according to program staff.
Finding: The 20-year lifecycle for snow-related mobile equipment does not work equally well across the country, given Canada’s diverse climatic regions (e.g., Arctic Tundra vs. Pacific Coast). This creates funding pressures for airports who use their equipment frequently and are not able to meet the 20-year benchmark.
The life cycle is different from region to region… every airport is eligible for the same equipment on the same life cycle, but airports in Northern Ontario are going to be using their plow 3 to 4 times a week whereas someone in Southern Ontario might be using them 3 to 4 times a month.”
“For a piece of equipment, 20 years here is more challenging because of the weather…storms and salt. We have variations of weather…that makes operation at our airport extremely challenging.”
Through meetings and consultations with the industry, the Program implemented a simplified application process for mobile equipment in 2016 (compared to a more complicated process, which assessed many factors including location and weather). This change resulted in the establishment of asset lifecycles for mobile equipment, which was based on historical project data. The average lifecycle for replacement was established at 20 years for all snow and ice control equipment (e.g., snow blowers, snowplow trucks, sweepers).
In 2016, the Regional Community Airports of Canada (RCAC) requested a reduction in the lifecycle of snow-related sweepers to 15 years. ACAP staff indicated that they were willing to incorporate this change if the RCAC could provide evidence that 15 years was the approximate industry average. However, at the time of writing, ACAP has not received the lifecycle documentation from the RCAC.
Similarly, some interviewees also indicated that the useful life for snow-related mobile equipment has not reached the entire lifecycle of 20 years because of the frequency and intensity of equipment use. Interviewees noted that some airports used some of their equipment more frequently due to their geographical location and associated weather patterns. For example, the Charlo airport (in New Brunswick) operates in very challenging winter conditions, with frequent, heavy snowfall. Their snow equipment is frequently used.
Stated differently, most interviewees indicated that the one-size-fits-all approach for the lifecycle expectancies of mobile equipment is not equitable (i.e., 20 years for snow-related mobile equipment across all the regions) and creates additional funding and operational pressures for airports that frequently use their snow-related equipment.
Findings from document reviews also suggest that there is no industry standard for the lifecycle of mobile equipment. For example, the Airport Improvement Program* (AIP) in the United States, identifies a minimum useful life of 15 years for mobile equipment. This suggests that the lifecycle of 20 years for mobile equipment under ACAP may be overly optimistic.
*Source: AIP Handbook, Table 3-7 Minimum Useful Life
Finding: ACAP funded airports have maintained their certifications from 2014-15 to 2020-21.
At a glance, an overview of air accidents* in Canada:
Figure 4 on the next page shows that overall aviation safety remained strong in Canada and that the number of accidents decreased from 2011 to 2020 at Canadian airports. Over this period, accidents at ACAP airports (including funded and not funded) accounted for 15.7% (363 of 2313 accidents) of the total accidents in Canada.
*Note: Air accidents are measured by the number of “aviation accidents resulting directly from the operation of an aircraft”.
Source: Transportation Safety Board (TSB)
An analysis of the evidence related to ACAP’s long-term safety outcomes suggests that the Program has contributed to a safer civil aviation safety system in Canada.
An analysis of data from the National Aerodrome Safety database confirmed that no ACAP funded airports have lost their airport certification between 2014-15 and 2020-21. ACAP funding has contributed to helping regional and local airports maintain the safety standards required for continued operation.
Along the same lines, interviews with Civil Aviation Safety inspectors confirmed that ACAP funded airports have continued to meet minimum safety levels to maintain airport certification. However, it was also suggested that ACAP funding will be important to help airports keep pace with potential changes to the Canadian Aviation Regulations (CARs).
Figure 4 displays the trends in accidents at all Canadian airports and ACAP eligible airports. Overall, there is a decreasing trend in the number of accidents across all Canadian airports. When looking at ACAP eligible airports, the trend is flat, showing no obvious increase or decrease in the number of yearly accidents.
A detailed analysis of accident data at ACAP funded airports revealed that few accidents reported to the Transportation Safety Board (TSB) between 2014 and 2020 (5 of 167 or 2.9%) were found to be related to the condition of airport infrastructure. This supports the argument that the vast majority of accidents at ACAP funded airports are due to factors outside of ACAP’s scope and sphere of influence. Further analyses of these data found that the condition of the infrastructure reported in the five accidents were primarily associated with airside surfaces (e.g., snow on runway surface, ice on apron surface, no markings between taxiway and apron surfaces).
Findings from document reviews and interviews found that overall, ACAP funding for safety related projects has allowed these airports to remain open. In turn, these airports provide Canadians living in these communities with greater access to air travel and the National Airports System* (NAS) airports.
*Note: The National Airports System (NAS) airports are federally owned airports operated by private airport authorities (i.e., airport assets are owned by the federal government). The NAS airports receive more than 525,000 passengers per year (e.g., Victoria International Airport, Ottawa/Macdonald-Cartier International).
Figure 4. Reported air transportation accidents, 2011 to 2020
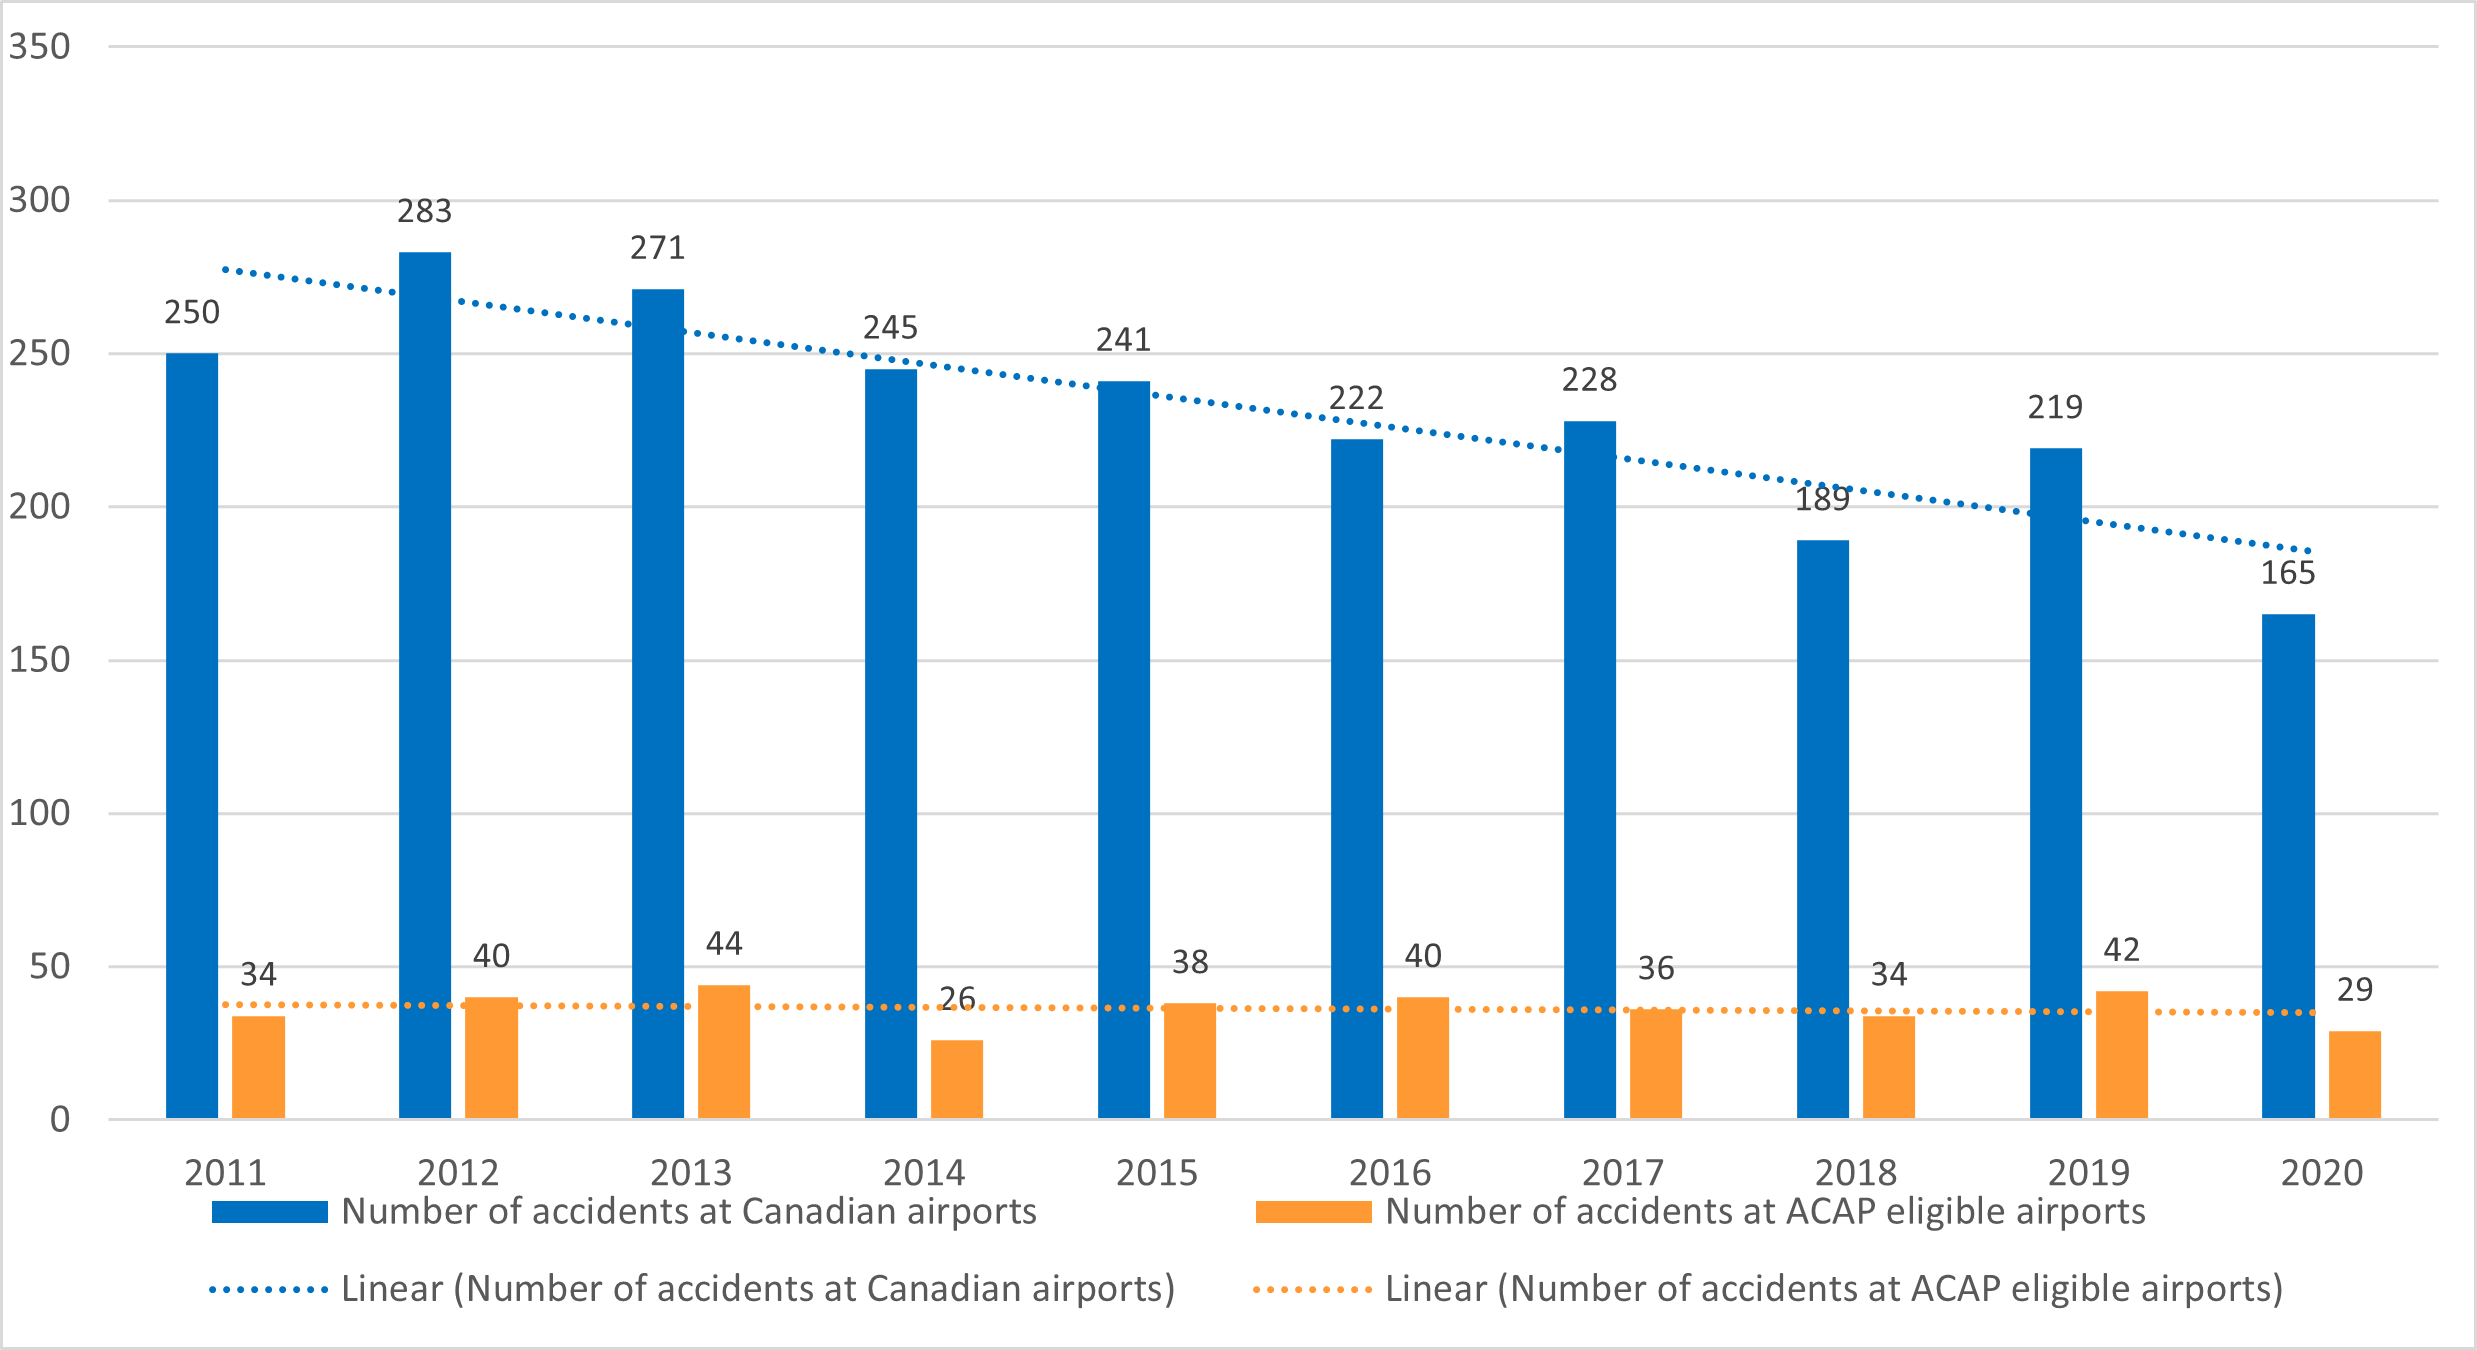
Source 1: Accident data at Canadian airports, Transportation Safety Board's website. Note 1: Data includes accident occurrences in Canada (not including outside of Canada and in other air space under Canadian air traffic control).
Source 2: Accident data at ACAP eligible airports, Transportation Safety Board's Aviation Safety Information System (ASIS) database, April 2022. Note 2: Data includes accident occurrences at ACAP eligible airports (both funded and not funded).
Text version - Figure 4. Reported air transportation accidents, 2011 to 2020
This is a clustered bar graph with linear trend lines, comparing the number of air transportation accidents at all Canadian airports and ACAP eligible airports, from 2011 to 2020.
In 2011, there were 250 accidents at Canadian airports and 34 accidents at ACAP eligible airports.
In 2012, there were 283 accidents at Canadian airports and 40 accidents at ACAP eligible airports.
In 2013, there were 271 accidents at Canadian airports and 44 accidents at ACAP eligible airports.
In 2014, there were 245 accidents at Canadian airports and 26 accidents at ACAP eligible airports.
In 2015, there were 241 accidents at Canadian airports and 38 accidents at ACAP eligible airports.
In 2016, there were 222 accidents at Canadian airports and 40 accidents at ACAP eligible airports.
In 2017, there were 228 accidents at Canadian airports and 36 accidents at ACAP eligible airports.
In 2018, there were 189 accidents at Canadian airports and 34 accidents at ACAP eligible airports.
In 2019, there were 219 accidents at Canadian airports and 42 accidents at ACAP eligible airports.
In 2020, there were 165 accidents at Canadian airports and 29 accidents at ACAP eligible airports.
The trend lines on this graph indicate that over time, the number of accidents at all Canadian airports is decreasing, while the number of accidents at ACAP eligible airports is flat.
Finding: Efficiency
Program efficiency
Finding: ACAP is delivered in an efficient manner. Program staff reported that various efficiencies were gained once ACAP was centralized.
Program management undertook various reallocation reviews of ACAP to improve program delivery. As a result of these exercises, ACAP was reorganized in terms of its delivery structure to support national consistency in program delivery and to ensure the efficient allocation of resources. These changes can be summarized as follows:
- In 2015-16, ACAP was partially centralized and delivered from three regions (PNR, ON, QC) as opposed to all five. This change resulted in a reduction in FTEs, from 20 to 13.5.
- In 2017-18, ACAP was fully centralized and managed and delivered from one region, the NCR. This change resulted in an additional reduction in the total number of program FTEs, from 13.5 to 7 FTEs even though the same funding envelope continued to be delivered.
ACAP streamlined and standardized the following activities to improve efficiency.
- Application forms were streamlined and transferred to a web-based interface. Program staff reported that digitizing and streamlining the application form has improved program efficiency.
- The mobile equipment application form was simplified, and asset lifecycle requirements and criteria were introduced. Program staff and recipients reported that this change improved efficiency and that new application forms could be completed faster than in the past.
- Contribution agreement templates were standardized for construction projects and mobile equipment projects. Program staff reported that this change improved program efficiency by reducing the amount of time required to prepare contribution agreements
- Quantitative data was not available to demonstrate the magnitude of the efficiency gains mentioned above.
Finding: ACAP is delivered in an efficient manner. Program staff reported that various efficiencies were gained once ACAP was centralized. (cont’d)
When it comes to the ACAP funding, we also have to take into account the time it takes for the approval to kick in, that affects us a lot because of the short construction season.”
As illustrated in Table 3 and 4 on the following pages, the financial data shows that the total planned spending (i.e., program budget) of $266 million was over-committed, which is an accepted funding strategy to mitigate the risk that some projects will not be completed according to the proposed timelines, as reported by program staff.
Cumulatively, comparisons between the total actual spending to the total planned spending resulted in a 5% surplus of the program’s budget remaining to be spent (i.e., lapsed funding).
There are a few reasons for the lapsing of funds, and these factors are generally not within the control of ACAP program management.
- The timing of airport recipients’ planning and budgeting cycles do not align with TC’s internal approval and announcement schedules.
- The construction season is short in many parts of Canada and due to the misalignment of planning and budgeting cycles, the window of opportunity to complete certain projects is small, which can result in completion delays and funds not being spent as originally planned.
Another measure of efficiency, which is used by some other contribution programs at TC, is to calculate the ratio of O&M (Salaries and Other Operating Costs) to the value of contribution disbursements.
- As illustrated in Table 4 on the next page, the ratio of O&M to contributions disbursed ranged from 1.3% to 2.9% from 2015-16 to 2020-21. These ratios help to demonstrate the efficiency gains made once the program was centralized, given that in 2014-15, when ACAP was still delivered out of 5 regions, the ratio was higher at 4.8%.
- Following the full centralization of ACAP in 2017-18, the 3-year average ratio of O&M funding to the contributions made was calculated at 1.6% (from 2018-19 to 2020-21).
| 2014-15 | 2015-16 | 2016-17 | 2017-18 | 2018-19 | 2019-20 | 2020-21 | Total | |
|---|---|---|---|---|---|---|---|---|
| Planned spending | 38.0 | 38.0 | 38.0 | 38.0 | 38.0 | 38.0 | 38.0 | 266.0 |
| Funds committed | 40.8 | 54.2 | 33.7 | 42.5 | 40.8 | 47.0 | 50.9 | 309.8 |
| Actual spending | 27.3 | 46.9 | 32.3 | 34.9 | 38.7 | 35.5 | 37.0 | 252.7 |
| Variance | 28.1% | -23.5% | 14.9% | 8.1% | -1.8% | 6.7% | 2.5% | 5.0% |
| Source: Finance data, March 2022. Note 1: Financial data is based on actuals (i.e., claims processed and reported by fiscal year). Note 1: Planned spending is ACAP’s program budget. Note 2. Variance (%) is the proportion of the program's budget that was not spent within the fiscal year. | ||||||||
| Type Expenditure | 2014-2015 | 2015-2016 | 2016-2017 | 2017-2018 | 2018-2019 | 2019-2020 | 2020-2021 | Total |
|---|---|---|---|---|---|---|---|---|
| Salaries | 1,156,401 | 951,232 | 881,117 | 859,060 | 464,146 | 500,403 | 676,697 | 5,489,056 |
| OOC | 143,017 | 76,975 | 43,777 | 52,331 | 39,585 | 32,861 | 23,000 | 411,546 |
| Sub-Total | 1,299,418 | 1,028,207 | 924,895 | 911,391 | 503,731 | 533,265 | 699,697 | 5,900,604 |
| Contribution disbursements | 27,326,439 | 46,935,184 | 32,323,739 | 34,929,182 | 38,685,347 | 35,452,781 | 37,040,655 | 252,693,327 |
| % of Contribution | 4.8% | 2.2% | 2.9% | 2.6% | 1.3% | 1.5% | 1.9% | 2.3% |
Finding: ACAP is currently transitioning to the Surface Infrastructure System (SIS) to help the department standardize and digitize the way it delivers grants and contributions (G&C) programs and to facilitate the analysis and reporting of G&C data. There is a risk that during the transition, program efficiency relating to processing claims will be negatively impacted. Change management strategies are being implemented to offset this risk.
As part of the departmental-wide change management initiative to integrate all grants and contributions (G&C) programs to one centralized data platform, ACAP has been transitioning to the Surface Infrastructure System (SIS) and using some of its associated modules/functions for various activities (e.g., Risk Assessment module, Proactive Disclosure module). Ultimately and with time, transitioning to SIS should help the department to standardize and digitize the way TC delivers G&C programs, from application intake to project close out. SIS is also projected to facilitate analysis and reporting of G&C data, which should help to enhance program management’s ability to make evidence-informed decisions.
ACAP is currently in the process of fully transitioning to SIS. Interviews with program staff indicate that there are certain limitations and inefficiencies to using SIS. For example, interviewees noted that they found inefficiencies (e.g., more time, more steps) to process claims using the Claims Management module in SIS, as compared to the Program’s current claim process using Microsoft Outlook and the Oracle Financial System.
Further review comparing both claim processes shows that there are additional steps required to process a claim in SIS compared to using ACAP’s existing claim process.
Evidence suggests that it will be important for the Program to review and map changes to internal processes and controls as it relates to processing claims from their current state to their future state in order to ensure continued program efficiency. As part of the transition to SIS, change management strategies (e.g., training) are being implemented to ensure that program staff can effectively use the system.
Recommendation
Overall, the findings from this evaluation led to the following recommendation:
1. Reexamine mobile equipment lifecycle: It is recommended that the Program reexamine the average lifecycle of 20 years for snow-related mobile equipment to determine if it could be better aligned to account for regional differences (e.g., climatic regions).
Management action plan
| # | Recommendation | Management action | Target date | Responsible lead |
|---|---|---|---|---|
| 1 | Reexamine mobile equipment lifecycle: It is recommended that the Program reexamine the average lifecycle of 20 years for snow-related mobile equipment to determine if it could be better aligned to account for regional differences (e.g., climatic regions). |
Management agrees with the recommendation to reexamine the lifecycle of mobile equipment.
|
2023/Q1 | ADM, Programs |
Appendix A. Evaluation Matrix
| Evaluation Questions | Indicators | Source | Methods |
|---|---|---|---|
| Relevance | |||
| Is there a need for ACAP and, if so, to what extent is ACAP meeting the needs of eligible airports? |
|
|
|
| To what extent was there sufficient demand from eligible airports to consume ACAP’s contribution budget from FY 2014/15 – 2020/21? |
|
|
|
| Performance | |||
|
What is the breakdown of capital projects completed by project type/category and region?
|
|
|
|
|
To what extent has ACAP achieved its desired outcomes?
|
|
|
|
| Efficiency & economy | |||
|
To what extent is ACAP delivered in an efficient manner?
|
|
|
|
Appendix B. Data Tables
| Region | Projects | Priority 1: Airside Rehabilitation & Aircraft Rescue and Firefighting | Priority 2: Mobile Equipment | Priority 3: Air Terminal Rehabilitation | ||||
|---|---|---|---|---|---|---|---|---|
| # | % | # | % | # | % | # | % | |
| PNR | 74 | 30.8% | 42 | 35.3% | 32 | 26.7% | - | 0.0% |
| PAC | 64 | 26.7% | 27 | 22.7% | 37 | 30.8% | - | 0.0% |
| ON | 63 | 26.3% | 33 | 27.7% | 30 | 25.0% | - | 0.0% |
| QC | 22 | 9.2% | 10 | 8.4% | 11 | 9.2% | 1 | 100.0% |
| ATL | 17 | 7.1% | 7 | 5.9% | 10 | 8.3% | - | 0.0% |
| Total | 240 | 100% | 119 | 100% | 120 | 100% | 1 | 100% |
| Source: Program data, April 2022. Note 1: A completed project will be defined as one for which all forecast payments were made by year-end 2020-21 (March 31, 2021). Note 2: Based on this definition, two projects will not be included in the analysis. | ||||||||
| Region | Funds awarded | Priority 1: Airside Rehabilitation & Aircraft Rescue and Firefighting | Priority 2: Mobile Equipment | Priority 3: Air Terminal Rehabilitation | ||||
|---|---|---|---|---|---|---|---|---|
| $ | % | $ | % | $ | % | $ | % | |
| PNR | 128.2 | 42.5% | 120.3 | 43.7% | 7.9 | 29.9% | - | 0.0% |
| PAC | 70.6 | 23.4% | 62.9 | 22.9% | 7.7 | 29.1% | - | 0.0% |
| QC | 48.1 | 15.9% | 45.5 | 16.5% | 2.6 | 9.7% | 0.1 | 100.0% |
| ON | 45.8 | 15.2% | 39.6 | 14.4% | 6.2 | 23.4% | - | 0.0% |
| ATL | 9.0 | 3.0% | 6.9 | 2.5% | 2.1 | 7.8% | - | 0.0% |
| Total | 301.7 | 100.0% | 275.2 | 100.0% | 26.4 | 100.0% | 0.1 | 100.0% |
| Source: Program data, April 2022. Note 1: A completed project will be defined as one for which all forecast payments were made by year-end 2020-21 (March 31, 2021). Note 2: Based on this definition, two projects will not be included in the analysis. | ||||||||