Road Safety in Canada
(PDF, 2.1 MB)
Motor Vehicle Safety
with support from the Public Health Agency of Canada
Cat. T46-54/1-2011E
ISBN 978-1-100-18621-4
2011
Table of Contents
- 1.0 Introduction
- 2.0 Current State of Road Safety in Canada
- 3.0 Major Road Safety Topics
- 3.1 Seat Belt and Child Restraint Usage
- 3.2 Aggressive Driving
- 3.3 Young/Novice Drivers
- 3.4 Alcohol Impaired Driving
- 3.5 Impaired Driving by Other Drugs
- 3.6 Distracted Driving
- 3.7 Impaired Driving by Fatigue
- 3.8 Vulnerable Road Users
- 3.9 Medically-at-risk Drivers
- 3.10 Motor Carriers
- 3.11 Road Infrastructure and Traffic Engineering
- 3.12 Vehicle Engineering
- 3.13 General Population
- 4.0 Future Challenges
- 5.0 References
1.0 Introduction
1.1 Purpose
The purpose of this booklet is to provide information to road safety professionals to assist them in their efforts to promote road safety and to encourage the commitment of all Canadians to rethink road safety and to adopt safer behaviour. This booklet is being published at this time to publicize the Canadian Year of Road Safety which runs throughout 2011, the launch of Canada’s third national road safety program called Road Safety Strategy (RSS) 2015, and the launch of the United Nations’ Decade of Action for Road Safety (2011-2020). Each of these initiatives is described below.
1.2 Canadian Year of Road Safety 2011
The purpose of the Canadian Year of Road Safety 2011 is to raise awareness about road safety in Canada, given that traffic collisions are a major cause of death for those aged 5 to 34 and that the injuries sustained in collisions by all Canadians are a major burden on our health care system in terms of emergency treatment, chronic care, and rehabilitation (Ramage-Morin, 2008).
This Year of Road Safety has been planned by the Canadian Global Road Safety Committee, a multi-stakeholder road safety coalition, in partnership with the Canadian Council of Motor Transport Administrators (CCMTA), federal, provincial, territorial governments, the Public Health Agency of Canada, and other partners. The year includes the launch of the RSS 2015 and the United Nations’ Decade of Action, the Canadian Multidisciplinary Road Safety Conference, and the 4th annual National Day of Remembrance for Road Crash Victims in November, as well as jurisdictionally and organizationally specific programs. Information regarding these activities can be found at the following website:
1.3 Canada’s Road Safety Strategy (RSS) 2015
RSS 2015 is the third in a series of national road safety programs, the first being Road Safety Vision 2001, followed by Road Safety Vision 2010. Both of these programs were associated with reductions in the number of fatalities and serious injuries resulting from road collisions in Canada.
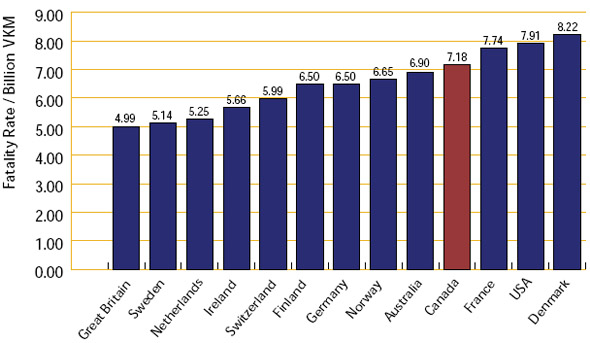
The vision of RSS 2015 is as before in trying to make Canada’s roads the safest in the world. In 2008, Canada was ranked 10th in terms of fatalities per billion vehicle kilometers traveled compared to other member countries of the Organization for Economic Cooperation and Development, as shown in Figure 1.
Figure 1: Canada’s 2008 Road Safety Ranking Among OECD Member Countries
The major objectives of RSS 2015 are to raise public awareness, enhance enforcement of traffic laws, increase communications, cooperation and collaboration among partners and increase information in support of research and evaluation.
The key elements of RSS 2015 are as follows: a downward directional trend in fatality and serious injury rates will be achieved over the 2011 to 2015 period; jurisdictions will adopt a holistic (Safer System) approach addressing the vehicle, the road infrastructure, and road users based on the primary risk groups and key contributing factors identified below; an evidence-based Best Practice Framework will be adopted in choosing interventions; a fluid and flexible approach will allow jurisdictions to adopt best practices appropriate to their situation; and jurisdictions will own their road safety plans.
The primary target/risk groups are young drivers (16 to 24), medically-at-risk drivers (e.g. those with heart disease or cognitive disorders such as Alzheimer’s Disease), vulnerable road users (i.e. pedestrians, motorcyclists, bicyclists), motor carriers (e.g. managers of carrier operations, truck and bus drivers), high risk drivers (e.g. those who don’t wear seat belts or who speed, drive impaired, or drive without a valid licence), and the general population.
The key contributing factors are impaired driving (i.e. alcohol, drugs, distraction, and fatigue), speed and aggressive driving, and occupant protection. The environmental factors include road infrastructure and weather conditions.
The road safety strategies will focus on best practices, a matrix of the key target groups and contributing factors and include communication and awareness, education/training, policy/legislation, enforcement, technology, road infrastructure, information/data for research and evaluation, and linkages. Ideally a combination of these strategies will be applied to a specific target group or factor.
The RSS 2015 slogan is "Rethink Road Safety," which represents a call to action for all road safety stakeholders. The logo for the campaign is presented below:
The progress of RSS 2015 will be monitored using a number of indicators over five years (e.g. fatal and serious injury rates per distance traveled, and fatally injured drivers who had been drinking).
More information about RSS 2015 can be found at www.ccmta.ca/crss-2015
1.4 United Nations’ Decade of Action for Road Safety
The United Nations’ groundbreaking report entitled World Report on Road Traffic Injury Prevention (Peden et al., 2004) noted that:
- about 1.2 million people are killed in road crashes globally each year, and about 20 to 50 million are injured;
- forecasts indicate that this global road toll will likely increase by as much as 50% in the next 20 years, particularly in low and middle income countries, if action is not taken;
- traffic collisions would become the third major cause of death;
- the major victims of these traffic collisions are people between 5 and 44 years of age;
- the cost of these collisions represents 2-3% of countries’ Gross Domestic Products.
The UN General Assembly passed a resolution in March 2010 to establish the Decade of Action for Road Safety led by the World Health Organization (WHO) in order to “stabilize and then reduce the forecasted level of road traffic fatalities around the world by increasing activities conducted at national, regional and global levels.” The principles guiding the Decade of Action are to adopt a “Safe System Approach” to deal with traffic collisions, have ownership for activities at the national and local level, and to include governments, the private sector, and nongovernmental organizations.
The suggested national activities during the Decade of Action include setting ambitious road safety targets, strengthening global architecture addressing road safety, increasing technical capacity in road safety within countries, providing technical support to low and middle income countries, improving the quality of data at national and global levels, and monitoring progress on performance indicators. The basic pillars for these national activities are road safety management, safer road design, vehicles and road users, and post-crash care.
The Decade of Action will be launched by the WHO and participating countries worldwide on May 11, 2011, starting in New Zealand. For more information about the Decade of Action, go to: https://www.who.int/roadsafety/decade_of_action/en/
2.0 Current State of Road Safety in Canada
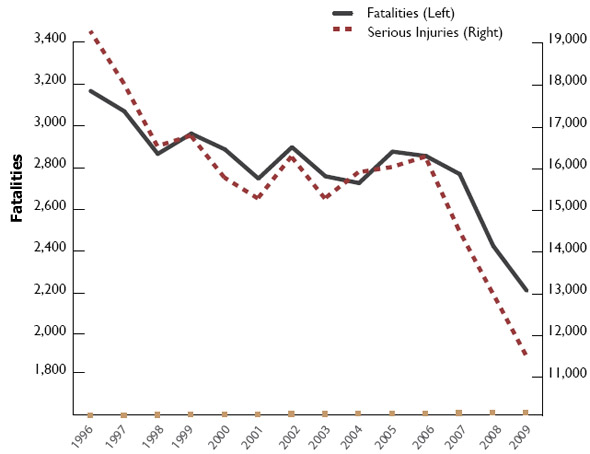
The number of traffic fatalities and serious injuries occurring in Canada from 1996 to 2009 are shown in Figure 2. In 2009, there were 2,209 fatalities and 11,451serious injuries (requiring hospitalization over night), representing a decline of 25% in both measures compared to the period from 1996 to 2001.
From 2004 to 2008, about three-quarters of fatalities and 70% of serious injuries have been drivers or passengers of vehicles. Although drivers aged between15 to 34 represent only about 30% of the driving population, they accounted for 40% of the fatalities and 45% of the serious injuries, indicating that younger drivers are at greater risk. About two-thirds of fatal collisions and 30% of injury crashes occur on rural roads, typically undivided with two lanes (Transport Canada and CCMTA, 2011). The annual social costs of the motor vehicle collisions in terms of loss of life, medical treatment, rehabilitation, lost productivity, and property damage are measured in tens of billions of dollars.
Figure 2: Fatalities and Serious Injuries 1996-2009*
* Canadian Motor Vehicle Traffic Collision Statistics 2009
The decrease in fatalities and serious injuries in 2008 and 2009 suggest that Canada is approaching its RSV 2010 target of a 30% reduction. It is recognized that some of this improvement may be due to the economic recession of 2008 to 2009, which may have reduced the amount of travel. However, the vehicle kilometres traveled (VKT) data from the Canadian Vehicle Survey (Statistics Canada, 2010) reveals that VKT fluctuated up and down over the 2006 to 2009 period, actually increasing 2.4% from 2008 to 2009.
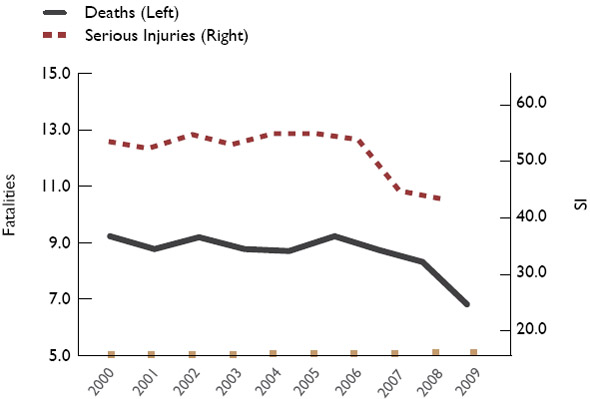
Figure 3 indicates that the fatality rate per billion VKT declined 30% from 2000 to 2009, while the serious injury rate dropped 22% from 2000 to 2008, suggesting that the economic recession is not the only reason that fatalities and serious injuries decreased.
Figure 3: Casualty Rates / Billion Vehicle-KM 2000-2009
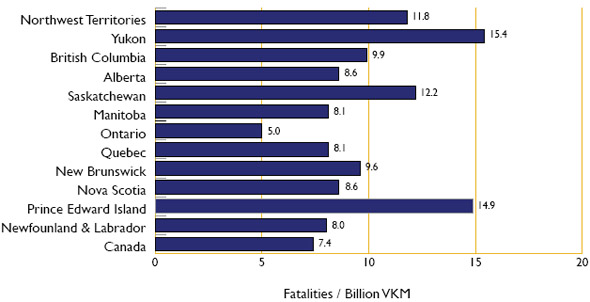
Figure 4 shows the fatality rates for each Canadian jurisdiction per billion kilometres traveled in 2008.
Figure 4: Canadian Fatalities per Billion Vehicle-km by Province/Territory*
*Canadian Motor Vehicle Traffic Collision Statistics 2008
In summary, Canada has made significant progress in reducing the number and rate of fatalities and serious injuries over the past decade compared to the period from 1996 to 2001, in part due to the success of a wide variety of road safety measures that have been implemented over these years.
3.0 Major Road Safety Topics
The following is a summary of major road safety topics based on the key target groups and contributing factors identified in RSS 2015, along with current and potential measures to improve safety related to these topics.
3.1 Seat Belt and Child Restraint Usage
Current Status: Seat belts worn correctly can reduce the chances of death in a collision by 47% and the chances of serious injury by 52% (Stewart et al., 1997). All new vehicles sold in Canada today are equipped with three-point seat belts in all positions. Many vehicles are also equipped with seat belt pretensioners, which automatically remove the slack in the belt at the time of impact, and load limiters, which allow the belt to spool out so that the occupants can ride down the impact without being injured by the belt itself. Seat belt use has increased over the past 25 years so that now 95% of Canadian vehicle occupants in all seating positions wear belts, and this includes those people in urban and rural areas based on surveys conducted in 2009 and 2010 (Transport Canada, 2011). As belt use has risen, occupant fatalities have declined.
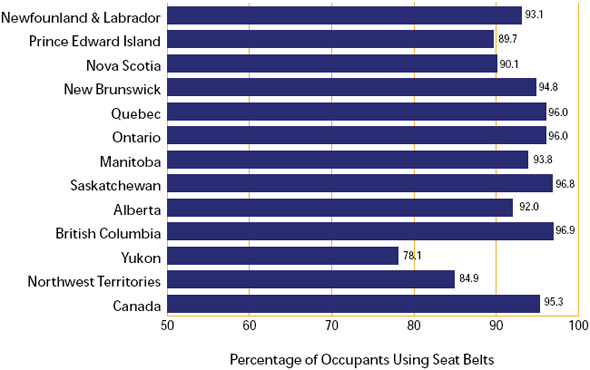
As shown in Figure 5, four provinces have achieved a belt usage rate of over 95%, thereby reaching one of the RSV2010 sub-targets. However, from 2004 to 2008, 36% of fatally injured drivers and 38% of fatally injured passengers were not wearing their belts at the time of the collision. It is estimated that about 300 lives could be saved every year if everyone wore belts.
Figure 5: Seat Belt Use By Jurisdiction For 2009-2010*
*Transport Canada’s Rural and Urban Surveys of Seat Belt Use in Canada 2009-2010, Fact Sheet TP 2436E, RS-2011-01
Proper use of child restraints can reduce the likelihood of death by 71% and injury by 67% (Isaksson-Hellman et al., 1997). Yet according to a recent survey (Snowdon et al., 2011), only 90% of children under twelve months of age were placed in infant carriers, only 86% of toddlers 1 to 3 years old were in infant carriers or child seats, and only 40% of children aged 4 to 8 were in booster seats. These usage rates are considerably below the seat belt use rates for adults.
Since 1991, all jurisdictions have had seat belt and child restraint use laws covering all seating positions. Some laws have exemptions for belt use (e.g. medical conditions, physical size, police officers, ambulance attendants, taxi drivers carrying passengers, drivers making frequent stops). The fines for non-use range from about $75 to about $250, and most jurisdictions have demerit points ranging from one to four.
More information about seat belt and child restraint use laws can be found at: http://ccmta.ca/images/publications/pdf/norp_report09.pdf
Periodic Selective Traffic Enforcement Programs (STEPs) combine heightened police enforcement and public awareness campaigns and have been important in increasing belt use across the country (Jonah et al., 1982). During the Canada Road Safety Week leading up to the May long weekend and Operation Impact during the Thanksgiving weekend in October, seat belt use is a major focus for enforcement campaigns by police services across the country. STEP campaigns are also conducted by individual communities throughout the year.
Many communities across the country conduct child restraint clinics to show parents the proper way to use child restraints and/or to encourage them to obtain the appropriate restraint for their child based on weight and height. Most hospitals will not allow parents to take their newborn home unless they have an infant carrier. Educational campaigns have been conducted in many communities, including First Nations communities. Police also periodically conduct enforcement campaigns to increase usage.
Further information about child restraints can be found at: https://tc.canada.ca/en/road-transportation
Potential Future Measures to Increase Seat Belt and Child Restraint Usage: Eliminating the remaining exemptions in seat belt and child restraint laws could increase usage and thereby reduce fatalities and injuries. Higher fines for non-use of seat belts and child restraints could motivate greater usage. Jurisdictions that do not assign demerit points for these offences could implement this measure, and those which already have demerits could raise them.
U.S. surveys show that seat belt use is 5-10% lower at night (e.g. Chaudhary et al., 2005). Night-time police enforcement can detect occupants who are more likely to be unbelted but also detect impaired drivers who are often unbelted. Several waves of night-time enforcement education campaigns were conducted in three North Carolina communities in 2007 and night-time seat belt use increased by as much as 10% points (Solomon et al., 2009). In Washington State, where seat belt use is more similar to that in Canada, night-time enforcement resulted in seat belt use increasing from 95% to 97% during the campaign (Thomas et al, 2010). Night-time seat belt campaigns may be an effective method of increasing seat belt usage in Canada.
Enforcement programs could be combined with incentive programs that reward seat belt users with a small gift (e.g. a voucher from restaurant) and/or enter them into a grand prize draw. Quebec adopted a combined enforcement and incentive approach in the 1980’s and seat belt use was seen to increase significantly, although it was difficult to assess the impact of the incentives separately from the penalties (Dussault, 1990). Generally, the effects of incentives are greater when baseline seat belt use is lower and when the target population is more confined (e.g. school programs, employer programs, colleges, small communities).
Feedback signs have also been posted at the roadside showing the observed seat belt use rate. Usage is measured each day and the numbers are changed accordingly. Feedback signs have been used successfully in Ottawa and in North Carolina. In the latter, driver seat belt use increased from 75 to 89% in Asheboro and from 80 to 86% in Greensboro (Malenfant et al., 1996). These signs appear to plant the idea that most occupants are belted, putting some social pressure on people to conform by wearing their seat belts. The changing numbers on the signs also tell people that someone is observing seat belt use so that there is an increase in the perceived likelihood of being stopped by the police, which results in increased seat belt use.
Employers could create policies stating that all their employees must wear seat belts when traveling in company vehicles or on company business. There could also be educational programs combined with the use of incentives and feedback signs in the workplace.
Vehicle technology can also be used to increase seat belt use. Vehicle seat belt reminders, currently used in front seats, could be included for the rear seat, and they could be made longer than the current eight seconds and made to become louder over time if the occupant remains unbelted. Technology could be installed in new vehicles which would delay the driver’s ability to put the vehicle into gear if the driver is not belted. Vehicles could be designed with haptic feedback to the accelerator such that unbelted drivers would have to press harder on the accelerator in order to exceed a preset speed (e.g. 50 km/h). A pilot study showed that drivers who usually were unbelted started wearing their seat belts when their company vehicle was fitted with this haptic technology (VanHouten et al., 2011). Vehicles could be designed so that if the driver or other occupants are unbelted, the headlights would flash on and off, thereby informing the police of unbelted occupants. Ultimately, ignition interlocks could be installed to prevent vehicles from being moved if the driver or other occupants are unbelted.
Parents should be aware of the importance of using child restraints properly. Educational campaigns using all forms of media (e.g. mass-radio, TV, Facebook, Twitter) could help to raise awareness. Family physicians could provide information to parents about the importance of properly placing their children into occupant restraints that are appropriate for their weight and height. Child restraint clinics could be conducted more frequently to show caregivers how to properly install and use restraints. The police could conduct more frequent STEPs (enforcement and public awareness) to increase child restraint use.
3.2 Aggressive Driving
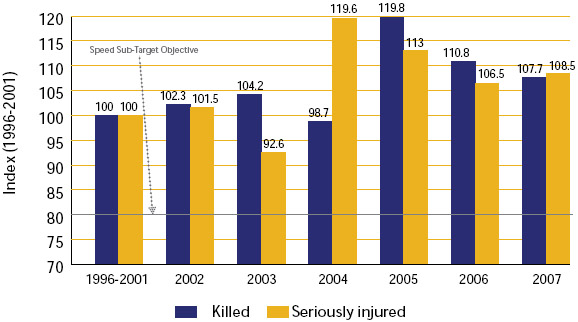
Aggressive driving includes speeding, running red lights, tailgating, weaving in and out of traffic, and failing to yield right of way, among other behaviours. Collision statistics reveal that 27% of fatalities and 19% of serious injuries involve speeding. Figure 6 shows that in 2002 and 2003, there was not much change in the number of speed-related fatalities and serious injuries compared to 1996-2001, but starting in 2004, speed-related serious injuries increased, while speed-related fatalities increased in 2005. By 2007, both had leveled off but were still higher than earlier in the decade.
Figure 6: RSV 2010 Speed Sub-Target Fatalities / Serious Injuries in Speed-Related Crashes: 2002-2007 vs 1996-2001 Baseline
CCMTA: SPEED AND INTERSECTION SAFETY MANAGEMENT, Annual Monitoring Report 2009.
Some characteristics of fatal collisions involving speeding are as follows:
- 40% of speeding drivers involved in fatal crashes were 16 to 24 years of age;
- most drivers killed in speed-related crashes were the ones speeding;
- 80% of young adult passengers who were killed in a speeding crash were in the vehicle with a speeding driver of similar age;
- single-vehicle crashes accounted for more than 50% of speeding deaths and serious injuries;
- one in three speeding drivers involved in a fatal crash had been drinking;
- urban roads at night are the primary location for fatal crashes involving young adult drivers, speed, and alcohol since urban areas have a high concentration of bars, restaurants and other places where alcohol is served.
Further information about speed-related collisions can be found at: www.tc.gc.ca/eng//motorvehiclesafety/tp-tp2436-rs200807-menu-158.htm
Research indicates that a 1% reduction in speed results in reducing the likelihood of a fatal collision by 5% (OECD, 2008). Therefore, a downward shift in the distribution of driving speeds for all drivers would be beneficial not just for those speeding on highways. Though the police have used radar units to detect speeders for years, this approach is very labour-intensive. Automated speed enforcement detects speeding drivers using radar and a camera. The radar measures vehicle speeds, and for vehicles traveling over a preset threshold, the camera records the licence plate number with vehicle owners receiving a summons in the mail.
Speed cameras have been found to be effective in reducing speeding and traffic casualties in Europe (e.g. France, Sweden, the United Kingdom) as well as in Australia. The U.K. Department for Transport conducted an evaluation of the impact of speed cameras in 38 areas that were employing cameras as part of a national program between April 2000 and March 2004 (PA Consulting Group, 2005). Surveys showed that average speeds dropped at speed camera sites by 6%, and there was a 31% reduction in drivers breaking the speed limit. Fatalities and serious injuries were 42% lower at the camera sites, resulting in a benefit-cost ratio for speed cameras of 2.7 to 1. There was also evidence suggesting that speeds were reduced not only where the cameras were located but on other roads in the area as well.
Currently in Canada, there are only municipal speed camera programs such as those in Edmonton, Calgary and Winnipeg. Quebec is currently conducting a pilot study using speed cameras in the Montreal, Montérégie and Chaudière-Appalaches regions. Early results indicate that speeding has decreased by 44% and extreme speeding (50 km/h over the limit) is down 94%. More information about this pilot program can be found at: www.ecomodder.com/forum/showthread.php/cameras-success-quebec-speeding-red-lights-9711.html
Ontario introduced anti-racing legislation in 2007 to deal with high-speed driving (i.e. 50 km/h over the limit). Driver’s licences can be automatically suspended, vehicles can be impounded for up to seven days, and there are hefty fines (i.e. $10,000). The Ontario Provincial Police (OPP) reported that speed-related fatalities dropped by about 50% from 2007 to 2009 on highways that they patrol. A similar law came into effect in British Columbia in 2010. Quebec has also introduced new safety measures in March 2011.
Ontario and Quebec implemented legislation in 2009 to deal with speeding heavy trucks. All heavy trucks must now have speed limiters activated so that the maximum speed that they can travel is 105 km/h. It remains to be seen what impact that this will have on collisions.
A national survey conducted by Ekos Research (2007) for Transport Canada indicated that while 47% of the respondents agreed that speeding was a main cause of traffic collisions, 70% admitted to exceeding the speed limit at least sometimes, particularly on highways (81%). This suggests that there is a disconnect between how people perceive the risk of speeding behaviour and how they actually drive. Two groups of speeders were identified: risk takers who speed because they enjoy taking risks and defying authority, and pragmatic speeders who speed in order to get to their destination more quickly. About three-quarters of survey respondents supported electronic roadside signs or in-vehicle systems telling drivers that they are speeding, while 56% considered the use of speed cameras a good idea.
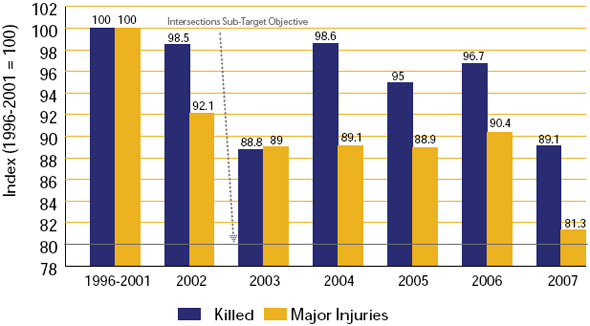
Aggressive driving also occurs at intersections. About 30% of fatalities and 40% of serious injuries occur at intersections. Figure 7 shows the trend in the number of fatalities and serious injuries involving intersections from 2002 to 2007 compared to the 1996-2001 baseline period. The rate of intersection fatalities and serious injuries was generally lower in the later years than in the baseline period, particularly in 2007, suggesting that intersections may be getting safer.
Figure 7: RSV 2010 Intersections Sub-Target Fatalities / Major Injuries in Intersection Crashes: 2002-2007 versus 1996-2001 Baseline
CCMTA: SPEED AND INTERSECTION SAFETY MANAGEMENT, Annual Monitoring Report 2009.
The following are some characteristics of the 2002 to 2004 fatal collisions at intersections:
- urban intersection crashes account for over half of all fatalities and almost three-quarters of serious injuries;
- older drivers (65+) are much more likely to commit an infraction leading to an intersection crash than most other drivers;
- fewer children under 16 are being killed or seriously injured in crashes at intersections compared to 1996-2001;
- 40% of all intersection fatalities involve a driver failing to yield the right of way or disobeying a traffic sign or signal.
More information regarding intersection collisions can be found at: www.tc.gc.ca/eng//motorvehiclesafety/tp-tp2436-rs200806-menu-839.htm
Some drivers run red lights at intersections knowing that there is an all-red light phase before the new green light appears, and other drivers jump the green light or complete a left turn on the yellow light, resulting in an intersection collision, often at high speed. In order to address such aggressive driving, several Canadian municipalities (e.g. Edmonton, Ottawa) have implemented red light cameras which detect vehicles entering the intersection on a red light and take a picture of the vehicle’s plate. The Insurance Institute for Highway Safety in the U.S. recently released a study (2011) that found that in 14 cities with red light cameras, fatal red light running declined by 35% from 2004 to 2008, compared to the pre-camera period from 1992 to 1996, whereas in 48 cities without these cameras, there was a drop of only 14%.
Potential Future Measures to Reduce Speeding and Other Aggressive Driving: Fines for speeding could be raised, as could demerit points. However, greater speed enforcement is key. Speed cameras and red light cameras could be implemented more widely across the country and their usage publicized. “Speed on green” technology is being used in Edmonton to identify red light runners and drivers that are speeding through the intersection on a green light.
Other technological approaches to control speeding have been tried but not widely implemented. There are on-board devices that drivers can plug into the vehicle’s OBDII port which will give the driver a visual and/ or auditory signal that he is speeding, or they could be used with haptic feedback so that the driver has to press harder on the accelerator to keep the speed above a preset level. There are also on-board systems called intelligent speed adaptation (ISA) which communicate with GPS satellites or land based beacons that can automatically reduce the vehicle’s speed to the limit. An on-road trial in Sweden found a decrease in collisions of 10-15% when informative systems were used, while a decrease on the order of 10-24% was observed for active systems which automatically reduced vehicle speed (Biding & Lind, 2002). Another method is to use pointto- point speed measurement on controlled-access highways using licence plate readers. If a driver entered the highway at one time and exited at another time, it is fairly simple to know how fast the driver was driving and a speeding ticket could be issued as is done for speed cameras.
Drivers could also be rewarded for traveling in a safe manner. A pilot study was conducted in Winnipeg where drivers were rewarded for not exceeding the speed limit and maintaining a safe distance behind a vehicle in front (Battista et al., 2010). These behaviours were measured using a Global Positioning System/Geographic Information System (GPS/GIS) and forward-looking radar. Drivers accumulated points when both behaviours were observed for each 15 second period, and these points could be redeemed to purchase rewards. It was found that such a system is technically feasible and the rewards resulted in safer driving at least over a four month period.
There continues to be a need to raise public awareness about the risks of speeding and running red lights.
3.3 Young/Novice Drivers
While only 13% of licensed drivers were aged 16-24, 24% of fatalities and 26% of those seriously injured were 16 to 24 years of age. Young drivers 16 to 24 years of age continue to be at higher risk of being killed in motor vehicle collisions per distance traveled than all other age groups, as noted in Figure 8.
Figure 8: Young drivers are overrepresented as victims
Note: Includes drivers of light-duty vehicles killed in crashes during 2004.
That is why since 2005, all Canadian jurisdictions have had Graduated Driver Licensing (GDL) programs for all novice drivers, who are generally young. The rationale for these GDL programs is that it is safer to ease novices into the driving environment, gradually allowing them to gain driving experience under lower risk conditions. Typically, there is a twelve month novice driver phase followed by another twelve month intermediate driver phase, although some jurisdictions are extending this latter phase to two years (e.g. Ontario). During the novice phase, there are a number of restrictions, such as a minimum driving age of 16, driving with an experienced supervisor, seat belt use, no alcohol, no late night driving, no young passengers, and no expressway driving. During the Intermediate phase, there are fewer restrictions (e.g. zero Blood Alcohol Concentration) although some jurisdictions such as Ontario have extended the 0 BAC until age 21 even if the driver is no longer in the GDL program.
More information about GDL programs in Canada can be found at: www.tirf.ca/publications/project_show.php?pid=45
Mayhew et al. (2005) reviewed evaluations of GDL programs conducted in Nova Scotia, Ontario, and British Columbia and found that collision reductions attributed to GDL were in the order of 15-30% depending on the specific age group and the measure used.
Potential Future Measures to Improve the Safety of Young Drivers: Awareness of the GDL restrictions could be raised particularly among parents so that they can monitor their children’s driving. More hours of practice driving (e.g. 120 hours) by novices that are certified by parents, as required in some countries (e.g. Australia), would increase the experience level of novice drivers. Driver education and licensing tests could be more focused on perceiving the dangers on the road and how to respond to them. Novices could be taught what to do if the tires of their vehicle leave the pavement at high speed, since “loss of control” collisions in these situations is common among young drivers. Parents could require their children to provide a “flight plan” before they leave with the family car (i.e. where they are going, with whom, how they will get there, and when they will be home).
Young drivers could be prohibited from using cell phones, PDAs, iPods, etc. while they are in the GDL program, regardless of whether they are hand-held or hands-free as has been done in British Columbia and Saskatchewan. Driver handbooks could include a section about the risks of driving while distracted, particularly by the use of electronic equipment.
Websites could be established which provide information to children and their parents about being a safe road user at various stages (i.e. walking, bicycling, riding a motorcycle, driving a car) as Alberta Infrastructure and Transportation has done at: www.saferoads.com/safety/index.html
More educational DVDs and websites targeted at teens, such as iDRIVE (www.roadstories.org) and the Drive Alive rap video in the Northwest Territories, could be developed and distributed to schools for use in assemblies to raise youth awareness about the risks on the road.
3.4 Driving Impaired by Alcohol
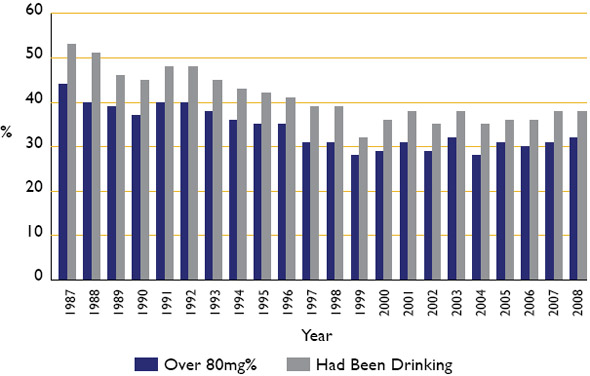
Current Status: Drivers who are considered by the police to be impaired based on their driving behavior or have more than 80mg of alcohol in 100 milliletres of blood (often referred to as the .08 or 80mg%) are considered to have committed an offence under the Criminal Code of Canada. In 2008, coroners’ testing showed that almost 40% of fatally injured drivers had been drinking some amount of alcohol (HBD) prior to the collision.
Figure 9 shows the percentage of fatally injured drivers who had been drinking or were over the .08 limit for each year from 1987 to 2008. While these percentages declined between 1987 and 1999, there has been virtually no further decline in these numbers over past ten years, and in fact, they have increased somewhat over the past four years. It has also been estimated using a measure based on single vehicle night-time collisions that in 2008, about 20% of serious injury collisions involved a drinking driver.
Figure 9: Percentage of Fatally Injured Drivers Who Had Been Drinking or Over 80mg%*
* Alcohol Crash Problem in Canada, CCMTA 2010
About 45% of the HBD drivers and those drivers over .08 were aged 20-35 even though only 27% of licensed drivers were in this age group. Male drivers accounted for 85% of the HBD drivers and 87% of the drivers over .08 but only 52% of the licensed drivers. About 60% of collisions involving a drinking driver were single vehicle collisions, while almost 90% of those collisions involving drivers over .08 involved only one vehicle.
More information about impaired driving collisions can be found at: https://tc.canada.ca/en/road-transportation
On July 2, 2008, new Criminal Code provisions on impaired driving came into force in Canada, which gave police better tools to detect and investigate alcohol- and drug-impaired driving. These changes increase the maximum sentence to life if the driver causes death and to a maximum 10-year sentence if they cause bodily harm; make it an offence if they refuse or fail to comply with a demand to provide for physical sobriety tests or bodily fluid samples; make it more difficult to get off on such stories such as “I only had two beers”; and toughen mandatory penalties ($1000 for a first offence, 30 days in jail for a second offence, 120 days in jail for a third offence).
The Canadian Council of Motor Transport Administrators (CCMTA) has had a Strategy to Reduce Impaired Driving (STRID) since the mid 1990s, which was an integral part of the Road Safety Vision and remains a key component of RSS 2015. The STRID 2010 strategy can be found at: www.ccmta.ca/english/committees/rsrp/strid/strid-strategy.cfm
Most jurisdictions have implemented the major STRID interventions to address Driving while impaired. All jurisdictions have 90 day administrative licence suspension, and most have vehicle impoundment, alcohol ignition interlock programs, short term licence suspensions, and assessment/rehabilitation programs. In addition, police services conduct periodic roadside enforcement programs in their jurisdictions during the year, particularly during the holiday season in December. For a summary of the various measures used in the jurisdictions, see Transport Canada’s impaired driving publication Smashed/Impact.
Potential Future Measures to Reduce Impaired Driving: In Canada, police officers can stop drivers at random, but they must have a suspicion that the driver has been drinking before requiring a roadside breath test. Many countries have implemented random breath testing (RBT) laws whereby police officers can randomly stop drivers and demand that they provide a breath test regardless whether they exhibit any signs of drinking. Such laws in Australia and in many European countries have raised the perceived likelihood of being caught for impaired driving and have therefore reduced impaired driving. The House of Commons Standing Committee on Justice and Human Rights reported in 2009 that an evaluation of RBT in New South Wales in Australia found a 36% reduction in the number of fatally injured drivers with Blood Alchohol Concentrations (BACs) over the legal limit of 50mg%. Another evaluation cited concluded that there was a 23% reduction in fatalities as a result of RBT legislation in Ireland. Publicizing RBT has been shown to make the law even more effective by raising perceived likelihood of apprehension.
Studies have shown that many convicted impaired drivers continue to drive even though their licences are suspended. For example, Malenfant et al. (2002) found that 57% of suspended impaired drivers in Moncton continued to drive. Vehicle impoundment or even forfeiture would deter drivers from driving while suspended. Some jurisdictions (e.g. British Columbia) are using the Automated Licence Plate Recognition (ALPR) System to detect drivers without valid licences by reading licence plate numbers and linking these numbers to licences. On the Lower Mainland of B.C. between February, 2007, and September, 2009, more than 3.6 million licence plates were scanned, resulting in nearly 3,700 charges (Globe and Mail, 2009). The majority of charges were for driving without a licence but other charges included possession of drugs or stolen property and breaching probation conditions. This technology could be used more widely to get unlicensed drivers off the road.
In most Canadian jurisdictions, convicted impaired drivers can choose to have an alcohol ignition interlock placed on their vehicle in order to get their licence back before the end of the suspension period imposed by the court. Many drivers refuse the ignition interlock, claiming that they will complete their suspension, but may continue to drive anyway. Participating in an ignition interlock program for at least nine months after licence suspension without any breath test failures could be made mandatory if a driver wants to get their licence back.
Mothers Against Drunk Driving (MADD) Canada and the Ontario Community Council on Impaired Driving are working with a number of communities on Call 911 Impaired Driver Campaigns where drivers can phone 911 to report a suspected impaired driver to the police.
While most jurisdictions have legislation addressing driving with BACs between 50 and 80mg%, a number of jurisdictions have increased the length of licence suspensions for violations of these administrative laws (e.g. Ontario, British Columbia, Saskatchewan) to three days or more and even longer for repeat offences (e.g. 30 days).
Additional measures to address impaired driving include:
- educating police, prosecutors, and judges about drunk driving so they understand the consequences of such behaviour;
- streamlining procedures for processing drunk drivers;
- encouraging police to lay more criminal charges rather than administrative charges for lower BACs, where appropriate;
- tracking administrative licence suspensions on driver records to identify repeaters;
- introducing escalating sanctions based on BAC level;
- widening the look-back window to ten years for determining repeat offences;
- promoting and strengthening links between the police, courts, injury prevention agencies, and other groups with an interest in preventing impaired driving.
A possible long term solution to impaired driving is being sought by a U.S. Blue Ribbon Panel on the Driver Alcohol Detection System for Safety (DADSS) that includes federal governments (U.S. and Canada), motor vehicle manufacturers, alcohol testing companies, alcohol and road safety researchers, and non-governmental organizations. The panel is seeking to develop an alcohol detection device which is transparent, highly accurate, easy to use, and low in cost that can be installed in all new vehicles so that drivers with BACs over the legal limit would not be able to move the vehicle. The technology being assessed includes infrared skin testing and breath testing. More information about DADSS can be found at: www.dadss.org
3.5 Driving Impaired by Other Drugs
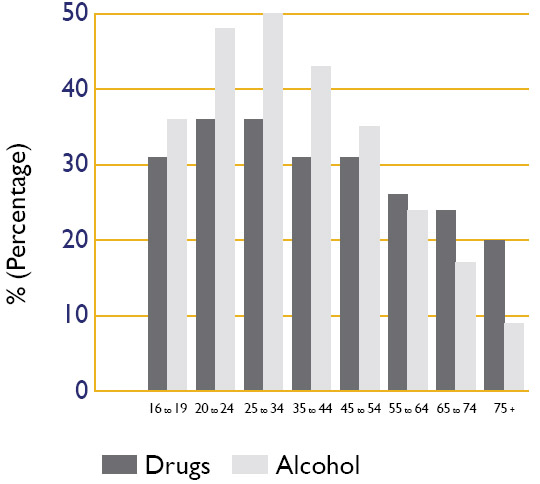
Drugs other than alcohol are also being found in about one-third of tested fatally injured drivers, similar to the prevalence of alcohol. These drugs, which can be prescription (e.g. valium), over- the-counter (e.g. cold remedies) or illegal (e.g. marijuana), can reduce drivers’ reaction times as well as their attention to the task of driving. As shown in Figure 10, alcohol and other drug use is more common among young drivers 20 to 34 years of age (Beirness and Beasley, 2011a). From 16 to 54 years of age, alcohol is more common than other drugs, but for those 55 and over, other drugs are more common. The latter likely reflects the greater use of prescription drugs by older people. Roadside surveys in British Columbia (Beirness and Beasley, 2011b) have shown that drug use rivals alcohol use by drivers at night, with 10% of drivers having been drinking and 7% having been using other drugs, although about 10% of drug users had been drinking as well. The most common drugs detected were cannabis, cocaine, and benzodiazepines.
Figure 10: Percentage of drug and Alcohol Positive cases According to Age Group
Source: Beirness et al, Drug use Among Fatally Injured Drivers, 2010
Changes to the Criminal Code of Canada in July 2008 allow police officers to request a driver suspected of impaired driving, to submit to physical (e.g. horizontal gaze nystagmus, walk and turn, one leg stand) tests called the Standardized Field Sobriety Test (SFST). Drivers showing signs and symptoms of impairment not consistent with their BAC can be required to take a series of other tests (e.g. physical assessment, eye exam, divided attention tasks) performed by a trained Drug Recognition Evaluator (DRE) who can determine whether the driver is impaired and by what class of drug. If appropriate, the officer can demand a bodily fluid sample, including blood, urine, or oral fluid. If the class of drug detected is consistent with the DRE’s findings, the driver can be charged under the Criminal Code and be subject to the same penalties as those for an impaired driving by alcohol conviction.
Potential Future Measures Dealing with Drugs Other than Alcohol: The public’s awareness about the impairing effects of drugs on driving performance could be increased. While some drugs are illicit, others are prescribed by physicians to treat various ailments. Doctors and pharmacists could provide more advice to patients about the potential impairing effects of some prescription drugs. There is also a need for better labeling of prescription medication so that people know what drugs may impair their driving performance. More police officers could be trained in the use of SFST and additional DREs who can conduct behavioural tests on drivers suspected of driving while impaired by drugs are needed.
3.6 Distracted Driving
According to the CCMTA’s Distracted Driving Subcommittee: “Distracted driving is the diversion of attention from driving, as a result of the driver focusing on a non-driving object, activity, event or person. This diversion reduces awareness, decision-making or performance leading to increased risk of driver error, near-crashes or crashes. The diversion of attention is not attributable to a medical condition, alcohol/drug use and/or fatigue.” There are various possible driver distractions, including:
- using electronic devices such as (global positioning system) GPS systems, CD and DVD players, radios, cell phones, laptops, (personal digital assistant) PDAs and MP3 players;
- reading maps, directions or other material;
- grooming (e.g. combing hair, putting on make-up or shaving);
- eating or drinking;
- talking with passengers or tending to children or pets;
- visual distractions outside your vehicle, such as collisions, police activity, or looking at street signs or billboards.
According to the U.S. National Highway Traffic Safety Administration (NHTSA, 2010), in 2009:
- 16% of fatalities and 20% of injuries in the U.S. involved driver distraction;
- the highest proportion of distracted drivers involved in fatal crashes was in the under-20 age group (16%) followed by those aged 20 to 29 (13%);
- light-truck drivers and motorcyclists were most often distracted (12% each);
- drivers aged 30 to 39 were most likely to have been distracted by cell phones (24%) prior to fatal crashes.
A 100-Car Naturalistic Driving Study in Virginia (Klauer et al., 2006) established direct relationships between driver actions and crash or near-crash involvement through continuous driver monitoring by in-vehicle video observation. The analysis of eye glance behaviour indicated that eyes-off-the-road durations of greater than two seconds significantly increased the risk of crashes and near-crashes. Furthermore, the study found that secondary task distractions (e.g. cell phones) contributed to over 22% of crashes and near-crashes. Although comparable data for Canada are not available, the involvement of distracted driving in fatal and injury collisions is likely very similar.
While many driver distractions have existed for decades, there is growing concern about the distraction caused by cell phone use either for talking or texting and the use of PDAs or Blackberries to read and send e-mails. Using such devices while driving reduces the driver’s awareness of their environment to the extent that they are not paying attention to what is happening around them. The use of such equipment has been shown to increase the chances of a collision from 38 to 400% depending on the methodology used (Laberge-Nadeau et al., 2003; Redelmeier and Tibshirani, 1997).
Vanlaar et al. (2006) conducted a survey of the Canadian public about distracted driving and found that two thirds of respondents were concerned about cell phone use while driving. Cell phone use while driving in the previous seven days was reported by 37%, but this was even higher for those aged 16-34 (55%).
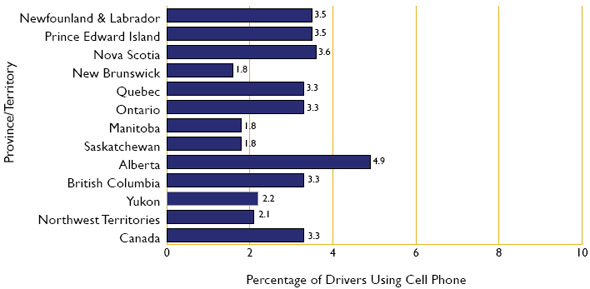
Figure 11 shows the percentage of drivers observed to be using cell phones as part of recent seat belt surveys in each Canadian jurisdiction (Transport Canada, 2011).
Figure 11: Rural and Urban Canada, Driver Cell Phone Use by Province/Territory - 2009-2010
*Transport Canada’s Rural and Urban Surveys of Seat Belt Use in Canada 2009-2010, Fact Sheet TP 2436E,RS-2011-01, which can be found at www.tc.gc.ca/eng//motorvehiclesafety/tp-tp2436-rs201101-1149.htm
Overall, about 3% of Canadian drivers were observed to be using cell phones, although this was lower than the 6% usage observed in the 2006-2007 surveys, which suggests that the laws prohibiting their use may be having an effect.
The CCMTA’s strategy on distracted driving, which includes a number of measures to reduce distracted driving, can be viewed at: www.ccmta.ca/english/committees/rsrp/strid-distraction/strid-distraction-strategy.cfm
Most Canadian jurisdictions have introduced laws prohibiting the use of hand-held devices, and the others will likely have them soon. For more information about these laws, visit: www.tc.gc.ca/eng//motorvehiclesafety/safedrivers-major-distractions-1073.htm
Police officers have been conducting periodic enforcement of these use laws combined with awareness campaigns to reduce the usage of these devices while driving.
Potential Future Measures to Prevent Distracted Driving: The public’s awareness about the risks of distracted driving in general and the use of telecommunications/telematics equipment while driving in particular can be increased so that distracted driving is no longer acceptable. Even though the use of hands-free devices is not prohibited for most drivers, research shows that they can be just as distracting (Harbluk et al., 2006) as handheld devices so awareness of the risks of hands-free equipment needs to be increased. One approach to raising awareness is the use of the Insurance Bureau of Canada’s DUMB (Distractions Undermining Motorist Behaviour) driving simulator which allows drivers to experience the distracting effects of cell phone use. More information about the DUMB simulator can be found at: www.ibc.ca/en/BeSmartBeSafe/Road_Safety/dumb_struck_facts.asp
Other educational material (e.g. iDrive DVD) can show young drivers how their driving performance is affected by distractions such as cell phone use.
CCMTA, in partnership with the Canadian Global Road Safety Committee, has recently launched the Leave the Phone Alone pledge campaign at: www.leavethephonealone.ca/pledge.php. The aim of the campaign is to get drivers to pledge that they will not use their cell phones while driving. Insurance companies could offer discounts to drivers who make the pledge.
Employers can also play a role by establishing policies which prohibit their employees from using cell phones, Blackberries, and other electronic devices while operating a company vehicle or operating their own vehicle while on company business. Many Canadian employers in the private (e.g. Esso Imperial Oil) and public sectors (e.g. Manitoba Public Insurance, Ministry of Transportation of Ontario, Transport Canada) have taken such positive steps. The following website indicates what other countries do regarding cell phone bans: www.cellular-news.com/car_bans/. Companies interested in developing a policy on cell phone use could review the following site: www.safetyxchange.org/tools/sample-company-cell-phone-policy-2
There are also concerns about distraction from on-board vehicle telematics (e.g. route guidance, infotainment) so there must be strict guidelines for manufacturers to follow in designing this on-board vehicle and aftermarket equipment to prevent driver distraction.
The frequency of use of cell phones and other telecommunications equipment immediately prior to collisions could be determined and assessed (i.e. included in police reports) but it may be necessary to provide police with access to cell phone records to do so.
3.7 Driving Impaired by Fatigue
It is estimated that about 20% of fatal collisions involve driver fatigue, calculated by eliminating other possible causes such as alcohol impairment, speeding, unsafe passing, etc. (CCMTA, 2010)
A 2007 survey found that about 60% of Canadian drivers admitted that they occasionally drove while fatigued and 15% of respondents admitted that they had fallen asleep while driving during the past year (Vanlaar et al., 2008). Some of the warning signs of fatigue are:
- blinking or yawning frequently;
- closing eyes for a moment or going out of focus;
- having wandering or disconnected thoughts;
- realizing that you have slowed down unintentionally;
- braking too late;
- not being able to remember driving the last few kilometers;
- drifting over the centre line onto the other side of the road.
Everyone is subject to their body’s circadian rhythms such that they are less alert during certain times of the day, usually 2:00-4:00 a.m. and 2:00-4:00 p.m. Therefore, taking breaks from driving during these times could lower the risk of fatigue related collisions considerably.
To manage fatigue, drivers can consider doing the following:
- sleep well prior to long road trips;
- share the driving with other passengers;
- take regular rest stops every couple of hours and do some exercise;
- eat light meals or fruit throughout the journey and drink water;
- if one feels tired during the trip, a nap of twenty to forty minutes is an effective way of reducing sleepiness.
Potential Future Measures to Prevent Fatigued Driving: More education is needed to raise awareness about the risk of driving while fatigued. Some jurisdictions have used Drowsy Driver Signs which have messages such as “Drowsy Driving Causes Crashes” or “Drowsy Drivers Next Exit 5 Kilometres.” These yellow signs were developed in order to remind drivers that drowsy driving is a very serious issue and also to inform them of possible exits where they can go to rest. There are also devices which detect driver fatigue by looking at eye lid closures, head nodding, lane deviations and warn the driver, but the validity of these devices has not yet been proven.
3.8 Vulnerable Road Users
Vulnerable road users include pedestrians, riders of motorcycles and mopeds, and bicyclists. They are vulnerable by virtue of their lack of protection if struck by a vehicle. Over the period 2004-2008, 13% of fatalities have been pedestrians, while motorcyclists and bicyclists have accounted for 8% and 2% of fatalities respectively. In total, vulnerable road users account for almost a quarter of traffic fatalities in Canada.
Pedestrians: Some of the characteristics of pedestrian traffic fatalities are as follows:
- 75% of pedestrian traffic fatalities occurred on urban roads;
- 60% of pedestrians killed in traffic crashes were trying to cross the road;
- 35% of fatally injured pedestrians were aged 65 or older even though they represent only 13% of the population;
- 63% of pedestrians killed at intersections were 65 or older;
- 6% of fatally injured pedestrians were under the age of 16 and of these, 20% ran out into the street;
- 33% of fatally injured pedestrians were at-fault for the crash;
- 33% of fatally injured pedestrians were struck by a driver who had committed a traffic infraction prior to the crash;
- 60% of pedestrians were killed at night or during dim light conditions when they are not seen by drivers;
- 40% of fatally injured pedestrians had been drinking.
Pedestrians should not assume that drivers see them at intersections and should instead make eye contact with drivers to ensure that they have been seen and that the driver is going to wait until they cross. Young pedestrians 5 to 10 years of age could receive training either at home or at school about how to walk to and from school safely. Seniors could take courses about being safe in traffic. People walking at night should wear light coloured reflective clothing so they can be seen by drivers. Given the high incidence of pedestrians being killed after drinking, bar employees could encourage impaired patrons to take a taxi rather than drive or walk.
Motorcyclists: Some of the characteristics of motorcycle traffic fatalities are as follows:
- 23% of motorcyclists killed in crashes were 25 to 34 years of age;
- fatalities among motorcyclists 45 to 54 years of age increased by 109% between 1996-2001 and 2004-2006 as ridership increased in this age group;
- 64% of fatally injured motorcyclists had committed a traffic infraction prior to the crash;
- 38% of fatally injured motorcyclists had been speeding prior to the crash;
- 33% of fatally injured motorcyclists had been drinking prior to the crash and 25% had BACs over the 0.08 legal limit.
A major problem for motorcyclists is that they are not always visible to the drivers of other vehicles, so they have to be especially careful while riding. While motorcyclist training courses exist in most jurisdictions, motorcyclists need to be trained not only in operating the vehicle safely but also in recognizing and avoiding dangerous situations where they cannot be seen by drivers. Riders could wear protective jackets and pants that are brightly coloured and reflective to increase their visibility and to reduce the risk of abrasions if they fall off of the motorcycle.
While the vast majority of motorcyclists wear helmets, some wear helmets that provide limited protection (e.g. beanie helmets) rather than those that have been tested and certified as being safe. Police officers could conduct spot checks of motorcycle helmets to determine whether they meet a recognized standard (e.g. U.S. DoT, Snell). Riders with helmets not meeting these standards would be ticketed, but they could be given several days to purchase a helmet meeting the standard and thereby avoid paying the fine.
Some jurisdictions (e.g. ON, AB, NL, NS) have Graduated Driver License (GDL) programs for motorcyclists, but rather than taking just one road test, there may be a benefit of taking a more comprehensive exit test to graduate from GDL. The focus of this latter test, which might be conducted on a simulator, could be danger perception and avoidance rather than the physical skills necessary for operating a motorcycle.
Impaired driving is even more risky for motorcyclists, given that the vehicle is unstable and does not provide much protection in a collision. It might be appropriate to lower the BAC limit to 50mg% in the Criminal Code and 20mg% in the jurisdictional traffic acts for motorcyclists.
Bicyclists: About 2% of traffic fatalities are bicyclists. Some of the characteristics of these fatalities are as follows:
- 94% of bicyclists killed in traffic crashes were 16 years of age or older;
- 34% of fatally injured bicyclists were struck by a vehicle in darkness;
- 19% of bicyclists killed in traffic crashes were struck by a heavy truck.
The major safety measure for bicyclists is to wear a helmet that meets safety standards. While many jurisdictions have laws requiring helmet use by bicyclists under18 years of age, fewer require helmets for adults. Bicyclists should also wear reflective bright colours and protective clothing to increase their visibility and to protect them from abrasions in the case of a fall. Enforcement campaigns could be conducted to detect bicyclists who run red lights and stop signs. Given that a third of fatalities occur at night, enforcement campaigns could also detect bicyclists riding at night without a light on. The establishment of separate bicycle lanes is a way of protecting bicyclists from motorized vehicles.
While vulnerable road users need to take measures to protect themselves in traffic, drivers must be alert to the presence of these road users and operate their vehicles in a safe manner around them (e.g. reduce speed, yield right of way).
More information about vulnerable road users can be found at: www.tc.gc.ca/eng//motorvehiclesafety/tp-tp2436-rs201002-1067.htm
3.9 Medically-at-risk Drivers
Drivers aged 65 and over represent 17% of the fatalities even though they only account for 14% of the licensed drivers. As shown earlier in Figure 9, the rate of fatalities per distance traveled starts to increase considerably at 75 and over. Part of the reason for this greater risk of a fatality is that seniors are more fragile and if they are involved in a collision, then they are more likely to be killed or seriously injured. As seniors age, they are more likely to develop physical and cognitive infirmities, although not all seniors have conditions which affect the safety of their driving. Therefore, age should not be used as the basis for determining whether a driver can continue to drive, but rather such a decision should be based on the driver’s physical and cognitive fitness to drive safely. A balance has to be maintained between the mobility of seniors and road safety.
According to the CCMTA’s Medical Standards for Drivers, “In assessing the older driver, factors such as slowed reaction time, lack of attentiveness, poorer judgment, failing vision, slowed thought process, episodes of confusion, declining memory, loss of physical strength, arthritis, severe respiratory problems and liability to sudden changes in heart rhythm must be considered. The possible side effects of required drugs such as tranquilizers and sedatives must be of concern.” These medical standards can be found at: www.ccmta.ca/english/producstandservices/publications/reportcentre.cfm#medicalstandards
Drivers with certain diseases (e.g. cardiovascular illness, diabetes, dementia) are required to have regular medical checkups and be free of certain symptoms in order to maintain their driver’s licence. Drivers of heavy trucks and buses are subject to stricter standards given the nature of their driving and the vehicles they drive.
CANDRIVE is a Canadian Institutes for Health Research funded team working to improve the safety of older drivers. For more information visit the web site at: www.candrive.ca
A website has been developed which provides one source of information on jurisdictional licensing forms and policies and noteworthy initiatives available in North America for seniors. This information can be found at: http://canada.seniordrivers.org/lpp/
Some jurisdictions, such as Saskatchewan, have adopted conditional or graduated delicensing of drivers with physical or mental impairments who cannot drive safely in all situations (e.g. prohibitions against night driving, long distance driving, high-speed controlled-access highway driving, and driving only in a specific area during specific time periods, (i.e. outside rush hours). These restrictions reduce the exposure of senior drivers to higher risk situations (Marshall et al., (2002).
The CCMTA has developed an Aging Driver Strategy which can be found at: www.ccmta.ca/english/pdf/aging_driver_strategy.pdf
Potential Future Measures for Medically-at-Risk Drivers: Senior driver assessments are conducted by occupational therapists. Educational programs for seniors have been established to show them how to protect themselves as a driver, occupant, or a pedestrian. For example, the Ministry of Transportation of Ontario runs group refresher courses for drivers over 80 years of age before they can renew their licence. The Canadian Automobile Association (CAA) offers the Shifting Gears, Helping Seniors Drive Safely program which covers a variety of issues related to senior drivers, including the effect of medications on driving. The Canada Safety Council offers the 55 Alive Driver Refresher Course for seniors. Given the growing number of older drivers, such assessment and education programs need to be expanded and evaluated. Option for financial support for seniors to encourage them to take these programs could be considered.
The Canadian Association of Occupational Therapists, with funding from the Public Health Agency of Canada, has developed a national blueprint on injury prevention for older drivers and an associated brochure, which can be found at: www.olderdriversafety.ca
Vehicle design could be improved so that seniors can operate their vehicles without being distracted (e.g. larger visual displays and controls). Also, occupant restraints systems (i.e. seat belts and air bags) can be designed in a manner that they are less likely to injure older drivers.
The road infrastructure can be improved as well, with more roadside lighting particularly at intersections to assist older drivers in seeing other vehicles entering the intersection. Given that senior drivers are more likely to be involved in intersection collisions when they are attempting to turn left in front of opposing traffic, there could be greater use of offset left turn only lanes and light phases, particularly in areas where there are large numbers of seniors. Also, given that seniors usually walk more slowly than younger pedestrians, the walk phases at intersections could be lengthened so that they have sufficient time to cross the road (Montafur et al., 2007).
Since the decision to withdraw or restrict the licence of a senior driver can be a very difficult one, there is need for better collaboration between the licensing authorities, the health community, families and the senior driver.
3.10 Motor Carriers
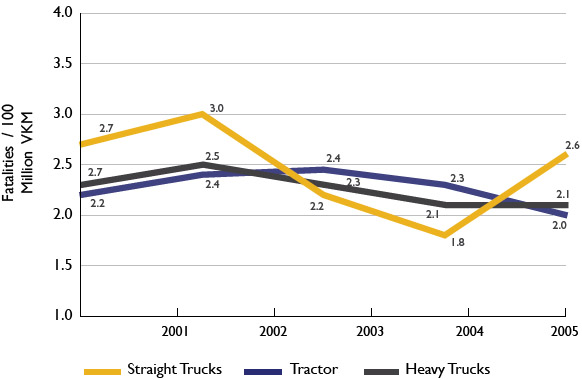
About 20% of fatalities occurring from 2001-2005 involved heavy commercial trucks (i.e. over 4536 kg) (Transport Canada, 2010). Figure 12 shows that the fatality rate per 100 million vehicle kilometres traveled (VKT) declined slightly for heavy trucks from 2001 to 2005 and that for three of the five years, the rate was lower for tractor trailers than for straight trucks. These rates are considerably lower than those observed for all vehicles (7.4 fatalities per 100 million VKT).
Figure 12: Fatality Rates in Heavy Trucks Collisions 2001 – 2005*
*From Transport Canada (2010) Heavy Truck Casualty Collisions 2001 – 2005, TP 2436E, Motor Vehicle Safety Directorate, April 2010.
The majority of heavy truck casualty collisions occur during daytime hours, in clear weather on dry, undivided roads, and in higher speed zones. Two-thirds of straight truck casualty collisions occur in urban areas while 56% of tractor-trailer collisions occur in areas deemed “rural” (Transport Canada, 2010). Given the large size of these trucks, it is not surprising that only about 15% of the fatalities were the occupants of the heavy trucks, the rest being occupants of light duty vehicles (LDVs) or vulnerable road users (75% and 10%, respectively). While it is usually the driver of the LDVs who is identified as being at-fault in fatal collisions involving heavy trucks, fault for injury collisions is more equally distributed between the truck and LDV drivers (Jonah et al., 2009). More information about collisions involving heavy trucks can be found in a Transport Canada report at: www.tc.gc.ca/media/documents/roadsafety/tp2436e-rs2010-03.pdf
Recognition and decision errors are two factors to be considered (Thiffault, 2011). Recognition errors include the driver’s lack of attention, fatigue, distraction, and lack of danger perception, while decision errors include risky behaviours such as speeding, failure to yield, unsafe passing, etc. Fatigue has been found to be a factor in about 30% of fatal collisions involving heavy vehicles (National Transportation Safety Board, 1995).
The safety of motor carriers that operate across international or provincial/territorial borders is regulated by the federal government, specifically Transport Canada, under the Motor Vehicle Transport Act. Carriers which operate only within a province/territory are regulated by these jurisdictions. The provinces and territories provide regulatory oversight (e.g. inspections) for both federal and provincial/territorial carriers.
The National Safety Code (NSC) was developed by CCMTA in 1988 has a set of 16 safety standards intended to ensure the safety of the motor carrier industry. These standards which are overseen by the CCMTA can be found at: www.ccmta.ca/english/producstandservices/publications/publications.cfm
The principles underlying the NSC can be found at: www.ccmta.ca/english/pdf/statement_of_principles_part_a.pdf
Over the last several years, the hours of service standard has been revised and embodied in federal/provincial/ territorial regulations to restrict commercial vehicle drivers’ hours to a maximum of 13 hours within a 24 hour period, plus an additional hour for loading or unloading.
All provinces/territories have driver licensing schemes which ensure that drivers of heavy trucks and buses have the requisite vision, knowledge, and operational skills to safely operate these vehicles. In addition, there are commercial driver training courses offered in most jurisdictions to assist candidates in developing the abilities needed to become a safe driver.
Potential Future Measures to Improve Motor Carrier Safety: Given that fatigue plays a role in as many as 30% of fatal heavy vehicle collisions, fatigue management programs are in place in many jurisdictions across Canada. The North American Fatigue Management Program started about ten years ago in Alberta with a handful of motor carriers. The program is still under development. It will include dispatch guidelines, screening for sleep disorders such as sleep apnea, medical intervention, and training. While this program will be expanded to other provinces and to the U.S., it and other such programs could be implemented more quickly.
Electronic on-board recorders are being considered to monitor how long a vehicle is being driven. The data on these recorders can be downloaded by motor carrier management and/or by safety regulators to ensure that drivers are following the regulations regarding hours of service.
Unlike, many European countries, it is not compulsory for drivers of large trucks and buses to take training. They just have to pass the licensing test. It has been argued that this training should be mandatory prior to taking the licensing test.
3.11 Road Infrastructure and Traffic Engineering
While it is difficult to quantify, much of the improvement in road safety in Canada over the past 30 years can be attributed to improvements in the roadway. More highways have been twinned such that the opposing lanes of traffic are separated by a median or barriers that reduce head on collisions. Additional lanes have been added to highways in order to provide passing opportunities, which decrease traffic build-ups and minimize driver frustration. Passing lanes on two-lane highways can reduce severe collisions by up to 29 percent. (Zein et al., 2003).
There are also more guard rails on highway curves today preventing drivers from going off the road and striking a tree or rock cut. The increasing number of highways with paved shoulders has also reduced the risk of drivers running off the paved road, losing control of their vehicle on the gravel and striking a fixed object or an oncoming vehicle. Breakaway devices have been gaining popularity through their ability to decrease the severity of collisions. Fatalities may be eliminated and serious injuries reduced up to 30 percent with the use of these devices. (Zein et al., 2003).
There has been an increasing use of rumble strips on road edges and centre lines which create a vehicle vibration that alerts inattentive or drowsy drivers that they are leaving their lane. Rumble strips have proven to be very effective in reducing run-off-road collisions by up to 76% (Zein et al., 2003).
There is a growing conversion of regular intersections to roundabouts which have been used in other countries for decades. Roundabouts require all drivers entering to slow down and yield to vehicles already on them. Roundabouts have been very successful in reducing fatalities and injuries at intersections by as much as 60-70% as well as reducing fuel consumption since the vehicles do not have to stop and wait for the light to change (Flannery and Datta, 1996). For more information on roundabouts, view the Transport Canada’s website: www.tc.gc.ca/eng//motorvehiclesafety/tp-tp14787-menu-179.htm
Potential Future Road Measures for Improving Road Safety: A Transport Canada report conducted by AECOM Canada in 2009 describes a number of low, medium and high-cost road infrastructure measures that can effectively improve road safety. Low-cost road engineering safety countermeasures include:
- splitter islands and overhead stop signs to make intersections more obvious to approaching drivers;
- advanced green lights which give pedestrians a two-second lead, enabling them to enter the intersection ahead of the vehicles and thereby reducing collisions with turning vehicles;
- yellow bar markings painted across the road at irregular intervals to reduce speed by giving drivers the impression that their speed is actually higher than their actual speed.
Medium-cost countermeasures include:
- gateways which provide visual and/or tactile cues (e.g. longitudinal rumble strips or pavement markings) designed to mark a threshold to a village or a special environment (e.g. school zone) requiring a shift to lower speeds;
- 2+1 roadway design without cable barriers that alternates the provision of two lanes from one direction to the other.
High-cost measures include:
- variable speed limit signs that advise drivers that they are traveling too fast for conditions (e.g. icy roads);
- New Jersey jug handle intersections that redirect left-turning traffic around the intersection, thereby avoiding left turns in front of opposing traffic;
- 2+1 roadway design with cable barriers separating opposite traffic flows that have been used successfully in Sweden.
This Transport Canada report can be found at: www.tc.gc.ca/media/documents/roadsafety/RS_engineer_10-29-2010_EN.pdf
3.12 Vehicle Engineering
Vehicles have been designed to be safer over the past 40 years, resulting in the prevention of thousands of deaths and injuries. There are now over 50 federal motor vehicle safety standards which all new vehicles sold in Canada must comply with. These standards which address lighting, braking, tires, occupant protection, roof and door strength, glazing, etc. can be found on the Transport Canada website at: (https://tc.canada.ca/fr/services-generaux/lois-reglements/liste-reglements/reglement-securite-vehicules-automobiles-crc-ch-1038)
All new vehicles are equipped with seat belts and driver and passenger frontal air bags which protect the occupants from hitting the dashboard, windshield, steering wheel, etc. Many new vehicles are also equipped with side air bags that protect the front and, in some vehicles, the rear passengers from being struck by a vehicle or other object (e.g. pole) intruding from the side.
There are also numerous crash avoidance technologies such as anti-lock braking systems (ABS) which reduce the likelihood of the brakes locking up and the driver losing control while braking hard. Electronic stability control (ESC) systems help the driver stay in control of the vehicle when swerving or braking suddenly to avoid an obstacle and reduce fatal collisions by about one-third (Farmer, 2004). A Canadian study found that ESC equipped vehicles had 41% fewer loss of control collisions and 23% fewer injury collisions of this type compared to similar vehicles without ESC (Chouinard and Lecuyer, 2011). ESC will be required as standard equipment on all new Canadian vehicles as of September 1, 2011.
There are also programs which rate the safety of new vehicles based on testing. For example, in a number of countries (United States, European Union and Australia), there are New Car Assessment Programs (NCAP) which use a star safety rating system for various classes of vehicles to assist consumers in buying a vehicle that is safe both in terms of collision avoidance and crashworthiness. The U.S. National Highway Traffic Safety Administration NCAP website can be accessed at: www.safercar.gov/Vehicle+Shoppers/5-Star+Safety+Ratings/2011-Newer+Vehicles.
The Insurance Institute for Highway Safety has a similar vehicle safety rating program, which can be viewed at: www.iihs.org/ratings/default.aspx
Potential Future Vehicle Technologies to Improve Safety: Brake assist systems maximize the braking potential of the vehicle using hydraulic pressure to assist the driver reach optimal braking force. Anticipatory brake assist systems use forward scanning radar sensors to detect objects or vehicles on the road ahead. If the system determines that a crash is imminent and that the driver’s braking response is inadequate, brake assist will automatically be applied. Fitting the full German fleet of passenger cars with brake assist systems has been estimated to reduce fatalities by 5% (Becker, et. al, 2004). Adaptive cruise control (ACC) allows the driver to maintain a constant speed while maintaining a fixed distance from the vehicle in front by automatically braking the vehicle. Elvik et al. (1997) cited in an Organization for Economic Cooperation and Development (2003) report has estimated that ACC could reduce all injuries by 0.7% and fatalities by 1.4%.
When cornering, traditional headlights illuminate the area directly in front of the vehicle, leaving the intended path of the vehicle in the dark. Cornering/axis controlled headlights have sensors that detect the vehicle’s speed and the rotation of the steering wheel and/or axles, and direct additional lighting to the left or right of the vehicle depending on the direction of the curve.
Lane change systems serve to monitor the vehicle’s lateral blind spot, detecting vehicles that are located in this space and warning the user of their presence. Lane departure warning systems monitor the location of the vehicle relative to lane markings and provide alerts to the driver should the vehicle deviate from the lane. Feedback is provided to the driver through visual, auditory or haptic signals, such as a ‘rumble strip’ noise.
There are also rollover side curtains on some vehicles which prevent an unbelted occupant from being ejected from the vehicle. Automatic crash notification (ACN) systems (e.g. OnStar) aim to reduce response times to crashes by automatically informing emergency services when and where a crash has occurred.
More information about these new vehicle safety technologies can be found on Transport Canada’s website at: https://tc.canada.ca/en/road-transportation or the Canadian Association of Road Safety Professionals: www.carsp.ca/page/111/400.
Over the past 40 years, vehicle engineering has contributed significantly to reduced fatalities (by a factor of 3) despite a doubling of the population. Additional vehicle technologies across the new vehicle fleet should be encouraged and regulated, were warranted. In the case of promising technologies that may not necessarily be made mandatory, it will be important to educate consumers of their potential safety impacts.”
3.13 General Population
It has been argued that the decline in impaired driving during the 1980’s and 1990’s can be attributed at least partly to a cultural shift such that this kind of behaviour is no longer socially acceptable. This shift was promoted by tougher impaired driving laws, police enforcement, educational campaigns, and the raising of public awareness by groups like MADD Canada and Ontario Community Council on Impaired Driving. It is no longer the norm to go out to a party and have three beers, three glasses of wine, and a glass of liqueur and then drive home. This cultural shift was most noticeable among young people who started designating drivers who would not drink and would drive them home safely. Even among adults, it has become the norm not to drive while impaired by alcohol. That does not mean that there are not drivers still out there who engage in such behaviour.
Currently, there is a new paradigm for understanding risky behaviour and promoting safer behaviour among road users through a change in the traffic safety culture. According to Ward et al. (2010), traffic safety culture can be defined as “the perceptions people have about what behaviors are normal in their peer group and their expectations for how that group reacts to violations to these behavioral norms. In terms of traffic safety, this definition applies to behaviors that either increase crash risk (e.g. speeding) or are protective (e.g. wearing seat belts), as well as behaviors related to acceptance or rejection of traffic safety interventions.” Ward et al. have proposed the following model for understanding traffic safety culture and the normative behaviour it engenders:
Ward et al. argue that “it is not enough to focus just on the traffic safety culture of the driving population. It is also necessary to consider the culture of those agencies that propose and enforce traffic safety policy that can impact the driving population; the culture of governments that allocate resources to various traffic initiatives that may hinder or foster risk; the culture of communities that encourage or discourage risk-taking; and the culture of societies as they endorse or condemn risky driving”. Can we change the road safety culture in Canada?
About two-thirds of fatal and 30% of injury collisions in Canada occur in rural areas, and these collisions often involve speeding, alcohol use and non-use of seat belts. Is there a difference in traffic safety cultures between rural and urban communities? We know that young drivers 16 to 20 years of age engage in more risky behaviour than older drivers, perhaps with the exception of impaired driving, and as a result they are more likely to die in collisions. Does the young driver culture value risky driving perhaps to express anger, fight boredom or impress friends? Given that youth generally believe that they are invincible and that they will never die in a traffic collision, can we convince them that they may end up becoming a quadriplegic for life or that they may end up hurting or even killing their friends? Better understanding of the beliefs, attitudes, and norms underlying behaviour would help in the development of appropriate measures to shift the traffic safety culture in a better direction.
In the mean time, more media campaigns would help to raise public awareness about road safety issues identified earlier (e.g. driver distraction, alcohol and drug impaired driving, speeding, etc.). The messages need to be evaluated (e.g. focus groups) before presenting them to the public. Since young people are communicating increasingly through social media, these safety campaigns could be conducted through Facebook, Twitter, and other social media as well as through the more traditional mass media such as print, radio and television.
Public awareness can also be raised through such national campaigns such as the Canada Road Safety Week in May and Operation Impact in October, which combine enforcement and awareness activity focused on belt use, impaired driving, speeding and other aggressive driving. There could be more of these nationally coordinated campaigns perhaps around the long weekends in the summer and during the weeks leading up to Christmas.
Awareness could be further increased if respected community leaders or champions added their voice to the call for increased road safety in Canada.
A compendium of road safety countermeasures prepared by the U.S. National Highway Traffic Safety Administration can be found at: www.ntl.bts.gov/lib/32000/32300/32356/6626_Countermeasures_01-06-10-v1.pdf
4.0 Future Challenges
Given the human toll of road crashes and the staggering social and economic cost to our society, it is surprising that unsafe driving continues. Change in driving behaviour needs to take place at the personal level, but road safety professionals can play a key role in bringing about this change.
Road Safety is a public health issue because it is a leading cause of premature mortality and the injuries caused by collisions represent a preventable burden in terms of human suffering and cost to the health care system. It has been estimated by the UN that about every tenth bed in hospitals is occupied by a victim of a motor vehicle collision. The cost of this health care is huge and it is growing. Furthermore, treating victims of collisions can result in scheduled surgeries being delayed adding to the long waiting lists. It is instructive that the UN has tasked the World Health Organization with the task of promoting global road safety. The UN clearly sees road collisions as a public health issue. There could be greater involvement of the public health community in preventing these collisions by creating supportive environments, development of personal skills, and strengthening community action.
In order to respond to a social problem, one must understand why it is happening. This understanding requires complete, accurate and timely data. At this point in time, complete collision data for Canada are available only up to 2008, although there is a preliminary estimate for 2009 fatalities. The U.S. NHTSA has released its fatality data for 2009 and has just released an estimate for 2010. In the State of Victoria in Australia, the minister responsible for road safety receives a daily report on his desk on the number of fatal collisions occurring in that state the previous day. Improving our collision data will improve the safety of our roads. One way to facilitate this improvement is to rapidly move to the electronic capture of collision data by the police at the collision site. Much of the information about the drivers, the vehicles and the road infrastructure can all be captured by swiping bar codes.
It is estimated that by 2020, about 20% of the Canadian population will be aged 65 or over. Compared to previous generations, a greater percentage of seniors will want to continue driving well into their eighties. Do we know enough about the challenges that they face as drivers? Is enough being done to ensure that they remain safe behind the wheel of a vehicle or as a pedestrian? Are other modes of travel being developed for those seniors no longer fit to drive? Do we know how seniors want to remain mobile? We should ask them.
Finally, the growing use of telecommunications and telematics technology (e.g. route guidance, infotainment, cell phones) in vehicles is distracting drivers. Do we know enough about how this equipment is being used and how it affects driver attention? Are the laws prohibiting the use of this technology while driving having an effect? Are other solutions required (e.g. blocking of cell phone transmissions while vehicle is in motion)? Only time will tell whether we have withstood this technological tsunami or whether we will become swamped by it.
In conclusion, Canada has seen an incredible improvement in road safety over the past 40 years, with fatalities being reduced by 60%. Yet, despite this improvement, a person dies every four hours or is admitted to hospital every 90 minutes as a result of a traffic collision. Our challenge is to move toward zero fatalities and serious injury collisions, where the price of mobility is not death or disability.
5.0 References
Battista, V., Burns, P. and Taylor, G. (2010). Using rewards to influence driving behaviour: A field operational trial. Proceedings of Canadian Multidisciplinary Road Safety Conference-XX. Niagara Falls, Ontario.
Becker, H., Busch, S., & Zobel, R. (2004). Methods for the evaluation of primary safety measures by means of accident research. Proceedings of the World Automotive Congress, Barcelona, Spain.
Beirness, D.J. and Beasley, E.E., (2011). Alcohol and Drug Use Among Drivers: British Columbia Roadside Survey 2010. Canadian Centre on Substance Abuse.
Beirness, D.J. and Beasley, E.E., (2011). A Comparison of Drug- and Alcohol-involved Motor Vehicle Driver Fatalities. Canadian Centre on Substance Abuse.
Biding, T., & Lind, G. (2002). Intelligent Speed Adaptation (ISA). Results of large-scale trials in Borlänge, Lidköping, Lund and Umeå during the period 1999-2002. 2002:89. Borlange, Sweden: Vagverket (Swedish National Road Administration).
Canadian Council of Motor Transport Administrator (2010). Canadian fatigue related collisions: Fatality estimates 2000-2005.
Chaudhary, N.K., Alonge, M.A. and Preusser, D.F. (2005). Evaluation of the Reading PA nighttime safety belt enforcement campaign: September 2004. Journal of Safety Research, Vol. 36, 2005, pp.321¬-326.
Chaudhary, N.K., Geary, L.L., Preusser, D.F. and Cosgrove, L.A.. (2005). Connecticut’s Day and Night Safety Belt Use. DOT HS 809 954. National Highway Traffic Safety Administration.
Chouinard, A. and Lécuyer, J.-F. (2011) A study of the effectiveness of Electronic Stability Control in Canada. Accident Analysis and Prevention 43, 451–460.
Dussault, C. (1990). Effectiveness of a selective traffic enforcement program combined with incentives for seat belt use in Quebec. Health Education Research, 5, 2, 217-223
Farmer, C. (2004). Effect of Electronic Stability Control on automobile crash risk. f 5, 317-325.
Flannery, A. and Datta, T. (1996). Modern Roundabouts and Traffic Crash Experience in United States. Transportation Research Record.
Globe and Mail, Automatic Licence Plate Recognition Systems (ASPR) coming to BC, (Feb. 12, 2009).
Harbluk, J., Noy, I, Trbovich, P., and Eizenman, M. (2006). An on-road assessment of cognitive distraction: Impacts on drivers’ visual behavior and braking performance. Accident Analysis and Prevention, 38,
House of Commons Standing Committee on Justice and Human Rights (2009). Ending Alcohol-Impaired Driving: A Common Approach.
Insurance Institute for Highway Safety (2011). News release: Camera enforcement in 14 large cities reduces rate of fatal red light running crashes by 24 percent.
Isaksson-Hellman I, Jakobsson L, Gustafsson C, Norin H. SAE 973299. p.43-54.
Jonah, B.A., Dawson, N.E. and Smith, G.A. (1982). The effects of a Selective Traffic Enforcement Program on seat belt usage. Journal of Applied Psychology, 67, 1, 89-96.
Jonah, B.A., Mayhew, D.R. Brown, S., Vanlaar, W., and Marcoux, K. (2009). Best Practices for Truck Safety. Traffic Injury Research Foundation.
Laberge-Nadeau, Claire (2003). “Wireless telephones and the risk of road crashes.” Accident Analysis & Prevention 35 (5): 649–660
Malenfant, L. Wells, J. Van Houten, R. and Williams, A. (1996). The use of feedback signs to increase observed daytime seat belt use in two cities in North Carolina. Accident Analysis and Prevention, 28(6) 771-777.
Malenfant JE, Van Houten R, Jonah B. (2002). A study to measure the incidence of driving under suspension in the Greater Moncton area. Accident Analysis and Prevention. 2002;34(4):439-47.
Marshall SC, Spasoff R, Nair R, van Walraven C. Restricted driver licensing for medical impairments: Does it work? CMAJ. 2002;167:747-751
Mayhew, Daniel R., Herb M. Simpson, Deanna Singhal (2005). Best Practices for Graduated Driver Licensing in Canada. Traffic Injury Research Foundation.
Montufar, J., Arango, J., Porter, M.M., Nakagawa, S. The normal walking speed of pedestrians and how fast they walk when crossing the street. Transportation Research Record 2002:90-97, 2007.
National Highway Traffic Safety Administration (2010). Statistics and Facts About Distracted Driving.
Organization for Economic Cooperation and Development (2003). Road safety: Impact of new technologies. Paris, France.
Organization for Economic Cooperation and Development (2008). Speed Management. Paris, France.
PA Consulting Group, (2005). Evaluation of the national speed camera programme: Four year report. Prepared for U.K. Department for Transport.
Peden, M. et al (2004). World Report on Road Traffic Injury Prevention. World Health Organization.
Ramage-Morin, P.L. (2008) Motor Vehicle Accident Deaths 1979-2004. Statistics Canada Health Reports, Volume 19 (No 3).
Redelmeier, D. Tibshirani, R., (1997). Association between cellular-telephone calls and motor vehicle collisions. The New England Journal of Medicine 336 (7): 453–458.
Zein, S.R. and Montufar, J. Hamilton Associated in association with Montufar and Associates (2003). Roadway Safety Benchmarks Over Time: Transport Canada Final Report.
Snowdon, A., Hussein, A., Ahmed.E. (2011) Canadian National Survey on Child Restraint use 2010: Transport Canada: in Preparation.
Solomon,M.G., Chaffe, R.H.B., Preusser, D.F. (2009). Nighttime Enforcement of Seat Belt Laws: An Evaluation of Three Community Programs. Report to NHTSA.
Statistics Canada, (2010). 2009 Canadian Vehicle Survey.
Stewart, D.E., Arora, H.R. and Dalmotas, D. (1997). Estimation Methodologies for assessing Effectiveness of Seat Belt Restraint Systems and the National Occupant Restraint Program. Motor Vehicle Safety Directorate, Transport Canada, Ottawa, Canada. Publication No. TP 13110 E.
Thiffault, P. (2011) Human Factors in Heavy Vehicle Collisions, presentation to CCMTA. November 2010.
Transport Canada (2008). A Quick Look at Speeding Crashes in Canada. Fact Sheet TP 2436E, Motor Vehicle Safety Directorate.
Transport Canada (2010). Heavy Truck Casualty Collisions 2001 – 2005. TP 2436E, Motor Vehicle Safety Directorate. April 2010.
Transport Canada and Canadian Council of Motor Transport Administrators (2011). 2008 Canadian Motor Vehicle Collision Statistics.
National Transportation Safety Board (1995). Factors that affect fatigue in heavy truck accidents. Safety Study 95/01, Washington, DC: National Transportation Board
VanHouten, R., Hilton, B., Schulman, R. and Reagan, I. (2011). Using Haptic Feedback to Increase Seat Belt Use of Service Vehicle Drivers. NHTSA report DOT HS 811 434.
Vanlaar, W.G.M., Simpson, H.M., Mayhew, D.R. and Robertson, R.D. (2008). Fatigued and Drowsy Driving: A Survey of Attitudes, Opinions and Behaviours. Journal of Safety Research, 39, 3, 303-309.
Vanlaar, W, Simpson, H., Mayhew, D. and Robertson, R. (2006). The Road Safety Monitor 2006:Driver Distraction. Traffic Injury Research Foundation.
Ward, N., Linkenbach, J., Keller, S., Otto, J. (2010). White Paper on Traffic Safety Culture for Toward Zero Deaths: A National Strategy on Highway Safety. Transportation Research Board.
Alternative Formats Available
If you need an alternative format or for more information, please contact us by e-mail at mvs-sa@tc.gc.ca or call toll free 1-800-333-0371 (Ottawa area (613) 998-8616).
Road Safety and Motor Vehicle
Regulation Directorate
Transport Canada
Tower C, Place de Ville
330 Sparks Street
Ottawa, Ontario
K1A 0N5
