April 2007
Table of Content
- 1. Introduction
- Designing a work schedule
- Providing adequate sleep opportunity
- 2. Automated Fatigue Audit Systems
- FAID: Applying a biomathematical model
- 3.Manual Fatigue Audit System
- Overview
- Examples
- Summary
- 4. Conclusion
- Beyond Level 1 controls
- Shared responsibility for managing fatigue
- Resources
Project Team
Edu.au
Kirsty McCulloch
Angela Baker
Sally Ferguson
Adam Fletcher
Drew Dawson
Transport Canada
Isabelle Marcil, Transportation Development Centre (TDC)
Jacqueline Booth-Bourdeau, Civil Aviation
Mark Laurence, Civil Aviation
TDC Communications Unit
Preface
This document is part of the Fatigue Risk Management System (FRMS) Toolbox for Canadian Aviation developed by Transport Canada and fatigue consultants edu.au of Adelaide, Australia.
The FRMS toolbox includes the following components:
-
FRMS for the Canadian Aviation Industry: An Introduction to Managing Fatigue, TP 14572E: introductory material intended to raise awareness about fatigue
-
FRMS for the Canadian Aviation Industry: Fatigue Management Strategies for Employees, TP 14573E: provides the knowledge and skills required to apply appropriate fatigue management strategies at the individual level
-
FRMS for the Canadian Aviation Industry: Employee Training Assessment, TP 14574E: an optional module intended to assess employee competence in topics covered in the Fatigue Management Strategies for Employees workbook
-
FRMS for the Canadian Aviation Industry: Developing and Implementing a Fatigue Risk Management System, TP 14575E: explains how to manage the risks associated with fatigue at the organizational level within a safety management system framework
-
FRMS for the Canadian Aviation Industry: Policies and Procedures Development Guidelines, TP 14576E: proposes a policy structure while providing examples and guidelines to help organizations through the process of designing fatigue risk management policies and procedures
-
FRMS for the Canadian Aviation Industry: Introduction to Fatigue Audit Tools, TP 14577E: provides an overview of tools available to employers to help determine whether scheduling provides employees with adequate opportunities to get sufficient sleep
- FRMS for the Canadian Aviation Industry: Trainer’s Handbook, TP 14578E: in addition to a training presentation on fatigue, fatigue management systems, and individual fatigue management strategies, the package includes background information for delivery of the workshop, learning outcomes, and questions frequently asked by participants
These documents are available on the Transport Canada web site at https://tc.canada.ca/en.
1. Introduction
The purpose of this guide is to provide an overview of various tools and techniques to ensure that work schedules meet the requirements of a fatigue risk management system (FRMS).
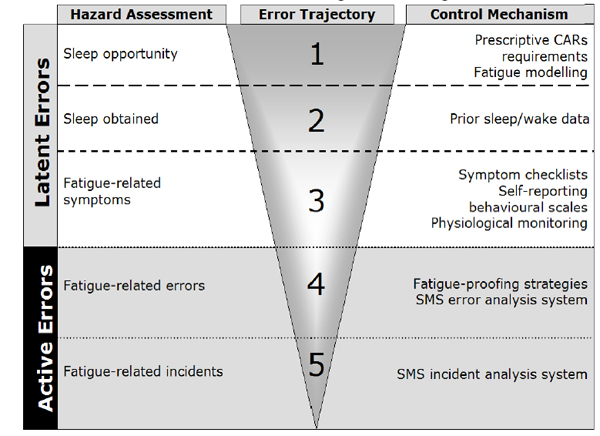
An effective FRMS consists of several levels of fatigue hazard controls (see Developing and Implementing a Fatigue Risk Management System (TP 14575E) for a detailed discussion). One of the first things that companies need to examine is whether the schedule provides employees with an adequate opportunity to get enough sleep to be fit for work (Level 1 control).
Hazard-Control Model for Fatigue Risk Management
Designing a work schedule
In the past, hours-of-service (HOS) rules have been used to ensure that a schedule provides adequate sleep opportunity between shifts and does not result in significant work-related fatigue. In principle, this appears to be a reasonable strategy. However, HOS regulations designed to be applied generically to an entire industry can be inflexible and ineffective for an individual organization. They may not guarantee sufficient sleep opportunity.
In designing an FRMS, it is important to understand that there is no such thing as a perfect schedule. Work schedules need to be structured around competing needs, such as operational safety and employee family and social life. For example, the “family friendliness” of a work schedule is likely to be determined by how much time off it provides during times of high social value (i.e., afternoons, evenings, and weekends). The “sleep friendliness” of a work schedule depends on the breaks it provides during times of high sleep value (i.e., nights between 9 p.m. and 9 a.m.). While sleep should be the primary concern, other factors such as the family and social life of employees should be considered, because they can have a direct effect on whether employees are able to use the time off to sleep. Consulting with employees during the early stages of implementing an FRMS can help find a balance between these competing needs.
Providing adequate sleep opportunity
To determine whether a given schedule may result in work-related fatigue, calculate the sleep opportunity that it provides. There are various ways to do this. This document outlines two methods of managing sleep opportunity:
-
Automated fatigue audit systems. Biomathematical modelling software has been developed that can predict how much sleep an employee is likely to get in a given schedule. The software is able to calculate a fatigue likelihood score for each employee at any given point in the schedule.
- Manual fatigue audit systems. For organizations with relatively simple schedules or that may not want to invest in software, manual calculations can also be performed to generate scores that provide an indication of fatigue likelihood.
2. Automated Fatigue Audit Systems
Biomathematical fatigue models use algorithms that use the effect of the time of day (circadian or natural body rhythms) and the length of time asleep and awake throughout the overall pattern of work and non-work periods to predict an average level of work-related fatigue for a given schedule. There are currently two kinds of biomathematical models.
One-step models (OSMs) use the timing of sleep, time awake, and circadian rhythms observed in a specific individual (e.g., through activity monitors, such as an actigraph) to predict work-related fatigue. Used this way, OSMs are generally considered a Level 2 control in the fatigue hazard control model (see detailed discussion in Developing and Implementing a Fatigue-Risk Management System (TP 14575E)) because they determine risk based on the actual behaviour of a particular employee rather than the inferred average behaviour of an unspecified person across the entire schedule.
Two-step models (TSMs) use the timing and duration of work and rest periods to estimate the most likely timing of sleep, which is then used to predict work-related fatigue. TSMs are generally considered to be less accurate for a specific individual since predictions are based on estimates of average behaviour and do not generally account for individual differences.
Software packages typically provide graphic representations of the work-related fatigue produced by a given schedule. Some also provide aggregate statistics for groups of employees and produce simple reports that show whether the schedule complies with thresholds established by the company or the regulator for work-related fatigue.
There are a variety of programs available. Two of the most commonly used TSMs are the Fatigue Audit InterDyne (FAID), developed by the Centre for Sleep Research at the University of South Australia and InterDynamics, and the Sleep, Activity, Fatigue and Task Effectiveness (SAFTE), developed by the U.S. Department of Defense.
Fatigue Audit InterDyne (FAID®)
FAID predicts fatigue, sleepiness, and performance based on hours of work. The underlying assumption of this program is that fatigue results from an imbalance between work-related fatigue and the opportunity for sleep between shifts. The algorithm takes into account factors such as shift time and length, previous work schedules, and break times to produce fatigue likelihood scores for each shift. The software estimates fatigue-related risk for groups of workers in a particular schedule rather than for specific individuals.
The program can also calculate the potential effects of travelling through up to three time zones. The time zone feature uses a circadian adjustment rate of an average of one hour per day – slower or faster depending on travel direction.
The data used in the initial development of the software was based on workers’ own reports of fatigue, rather than objective measures of fatigue such as performance. However, the current version relies on good empirical data collected from shift workers over long periods. This software system is currently being used for scheduling purposes by Australian carriers and agencies such as Qantas, the Civil Aviation Safety Authority, and the Australian Transportation Safety Bureau. It is commercially available from InterDynamics (www.interdynamics.com and www.faidsafe.com).
The interface is user friendly and the outputs are easily understood, provided the user has some understanding of fatigue and fatigue risk management. A more detailed discussion of the actual use of this program is found later in this section.
Sleep, Activity, Fatigue and Task Effectiveness (SAFTE), FASTTM et xsRiskPro
SAFTE predicts performance effectiveness, a measure that is affected by fatigue and various sleep factors. The software uses the idea of a “sleep reservoir” as a way to model fatigue risk. The reservoir is full when a person is fully rested and at maximum capacity to perform. As time awake increases, the reservoir empties and can only be refilled by sleep. How fast the reservoir refills depends on the quantity and quality of sleep. The software determines overall performance according to time of day (circadian rhythms) and the level of the sleep reservoir.
The model can take into account time zone changes, individual differences such as a tendency to be a night or morning person, and sleep quality.
Originally designed for the U.S. Armed Forces and the U.S. Department of Defense, SAFTE has also been used by the U.S. Department of Transportation to evaluate work schedules for accident risk.
The same developers subsequently created the Fatigue Avoidance Scheduling Tool (FAST) and xsRiskPro, which are commercially available (http://archinoetics.com/fast.php and www.fatiguerisk.com). FAST is intended to help managers and individuals design work and sleep schedules that reduce the risk of fatigue and fatigue-induced errors. xsRiskPro was developed to analyze a large number of work schedules to assess their impact on employees’ fatigue levels while on the job.
Originally, SAFTE required the input of actual sleep data (collected using technologies such as an actigraph), but the software now includes a function called AutoSleep that calculates the likely time of sleep from work schedules and circadian rhythms.
Using the work schedules, FAST displays a curve of the change in performance effectiveness over the day, as well as performance zones (displayed as green, yellow and red). Companies can either use the default set of performance thresholds or set their own. A critical threshold is set at 77.5% of performance, where fatigue is considered to produce a level of impairment equivalent to a blood-alcohol level of .05. The performance zones tell the user at what time during the day performance falls below acceptable thresholds. Like FAID, the FAST interface is accessible and relatively easy to learn, although some understanding of fatigue is required to interpret the results.
System for Aircrew Fatigue Evaluation (SAFE)
Developed by QinetiQ for aviation operations, SAFE is used by the UK Civil Aviation Authority (CAA) to evaluate work schedules proposed by airlines. It relies on data collected during laboratory experiments and was further validated and refined with operational data collected during long-haul flights.
Using the work schedules of flight crews, the software shows variations of alertness levels throughout each shift. Alertness levels are colour-coded from green to red to represent the effect of fatigue on performance. The software calculates sleep periods based on rest and duty periods, but also accepts actual sleep data. It can take into account naps and time zone changes, distinguishing between eastward and westward travel.
To calculate alertness levels, the program takes into account time of day (for circadian influences), time since the last sleep period, and sleep propensity – the tendency to fall asleep (propensity is greatest at the circadian low, around 4 a.m.).
Outputs require some familiarization. An understanding of sleep and fatigue is necessary to get the most out of this tool.
QinetiQ has also developed another software tool called Integrated Performance Modelling Environment (IPME) that considers time on task – a factor that may contribute to fatigue on duty. SAFE is currently used by QinetiQ to provide expert advice to airlines on schedules and fatigue, but is not currently available commercially. The company is planning a commercial version of the software for late 2008.
Circadian Alertness System (CASTM)
CAS is used mostly by the trucking and rail transportation industries. The software extrapolates sleep and wake patterns based on work schedules, and calculates alertness and cumulative fatigue scores for an individual employee or group of employees working a particular schedule. CAS calculates the probability of accidents in operations as a cumulative fatigue risk score for groups of employees over a period of days or weeks.
In predicting alertness, the system can take into account some individual differences, such as a tendency to be a morning or night person, usual wake-up times, sleep length, sleep flexibility, and napping capability. The system does not take into account the effects of jetlag, exposure to light, or sleep inertia.
The developer of the software, Circadian Technologies (www.circadian.com), uses it in its consulting services. The program is not available commercially on its own.
Sleepwake Predictor
Based on a three-process model, the software predicts alertness by calculating the level of sleepiness associated with variations in circadian rhythms and time awake (or asleep). This is used to assess the potential for getting restful sleep and for an employee to remain alert during a given time period.
The program evaluates the fatigue and performance effects of work schedules and the risk level associated with each. The program has been used – mostly by researchers – to evaluate schedules for navy, aviation, railway, trucking, nuclear, and military work environments. The program takes into account sleep latency (how long it takes to fall asleep), a factor that varies with circadian rhythms and tends to reduce daytime sleep. It can also take into account changes in time zone, whether an employee tends to be a morning or night person, habitual sleep length, and difficulties sleeping.
The software uses schedules to calculate likely bedtimes (sleep onset) and wake up times (sleep termination) to produce an alertness curve. It indicates the percentage of time where sleepiness levels are above critical limits, providing risk level for a specific schedule.
Circadian, Neurobehavioral Performance and Subjective Alertness Model and Circadian Performance Simulation Software (CPSS 1.2)
This software was developed to predict the effect of factors such as working at night and sleeping during the day on circadian rhythms and on performance and alertness. Successive studies have refined this program, improving its ability to predict sleep deprivation, impact of time of day, and the effect of light and phase shifting (jet lag). Despite its strength in predicting fatigue and performance, the software’s features make it of greater interest to researchers than industry. The program requires sleep start and end times as well as light amplitude data across a 24-hour day. The effort required to collect this information makes it less appealing for companies.
The software is not sold commercially but is available on the Internet as part of a software package called Circadian Performance Simulation Software (1.2) (http://sleep.med.harvard.edu/research/faculty-research/tools/CPSS/CPSS12). It requires an advanced understanding of sleep research and prior experience with biomathematical modelling, and its limited interface is intended for use by the research community.
FAID : Applying a biomathematical model
This section provides an example of how one of the programs described above can be applied within an FRMS. A trial version of the Fatigue Audit InterDyne (FAID) is available through Transport Canada or directly from InterDynamics(www.faidsafe.com). More detailed instructions on using FAID are provided in the user’s manual included in the software.
Defining the scores
FAID assigns fatigue or recovery values to work and break periods based on four factors:
-
length of each work or break period
-
time of day when the work or break took place
-
prior work history of the employee (seven days)
- biological limitations on sleep and recovery
Based on these factors, the software analyses planned or actual work schedules to provide a score that reflects fatigue likelihood for each shift. This score can then be compared to the scores of other shifts or schedules, or against a threshold value established by the company. For example, a standard work week of Monday to Friday, 9 a.m. to 5 p.m., scores approximately 40. A standard week of night shifts, from 11 p.m. to 7 a.m., produces a moderate fatigue score of about 80.
A recent study suggests that scores between 80 and 100 (high fatigue likelihood) are comparable to the level of fatigue-related impairment caused by staying awake for 23 to 24 hours following a regular work week. Multiple studies have shown that performance impairment at such a level of sleep deprivation is comparable to blood-alcohol concentration over 0.05%.
Risk assessment process
Organizations should try to ensure that work schedules never produce more than a moderate level of operational fatigue. However, a risk management approach can provide some additional flexibility. Depending on the task risk and the fatigue mitigation strategies in place, a company may be comfortable accepting a higher fatigue likelihood threshold. Conversely, if certain tasks carry a particularly high risk, organizations may be more comfortable using a more conservative, lower fatigue likelihood threshold. These decisions should be made using formal risk assessment processes. For a more detailed discussion, please see Developing and Implementing a Fatigue Risk Management System, TP 14575E.
FAID compliance table
With the information gathered during the risk assessment, FAID can be used to review work schedules for adequate sleep opportunity. Start by establishing risk-based FAID threshold values to define “acceptable,” “questionable,” and “unacceptable” fatigue likelihood scores. The upper threshold (Y) is the limit beyond which the sleep opportunity is insufficient and is likely to result in unacceptable fatigue-related risk. A lower threshold (X, which is typically 10 to 20 points below the upper threshold) is then assigned. FAID scores between the upper and lower thresholds fall into the “questionable” zone, and scores below the lower threshold are “acceptable”.
Schedules should be assessed in advance, and actual hours worked should be assessed afterwards. At least 97.5% of scheduled hours and 95% of actual hours should fall within the “acceptable” zone (below X, the lower threshold). A small percentage of the schedule may fall in the “questionable” zone (between X and Y), but organizations should not intentionally schedule work with scores in the “unacceptable” zone (above Y). Unforeseeable circumstances may sometimes dictate that some part of actual hours worked falls into the “unacceptable” zone (up to 1.25% of total hours worked), but all work in zones other than “acceptable” should be investigated and appropriate corrective action taken where necessary.
FAID Compliance Table
| FAID threshold values | Planned hours of work | Actual hours of work | Corrective Action | |
|---|---|---|---|---|
| Acceptable zone | < X | At least 97.5% of scheduled hours below the lower threshold | At least 95% of hours worked below the lower threshold | None unless one or more controls indicate levels are wrong |
| Questionable zone | [X-Y] | No more than 2.5% of scheduled hours between lower and upper threshold | No more than 3.75% of hours worked between lower and upper threshold | Correct if there is moderate chance of recurrence |
| Unacceptable zone | > Y | 0% of scheduled hours above the upper threshold | No greater than 1.25% of hours worked above the upper threshold | Act immediately, rest until fit for duty, report to regulator |
The principle of this compliance table can be used with other scheduling software that calculates scores that can be used as thresholds for fatigue-related risk.
Using FAID
On opening the program, first-time users are taken through an introduction to the software and its use. Regular users go directly to the inputs menu. The menu at the top of the screen (shown below) shows users where they are in the analysis process.
Fatigue tolerance levels (FTL) for various types of tasks are established through a task fatigue risk assessment. Users can select “no fatigue tolerance level, “one tolerance level, or “multiple tolerance levels.” If “no fatigue tolerance level” is selected, the software will produce only fatigue scores in the Outputs display without comparing them to a tolerance level.
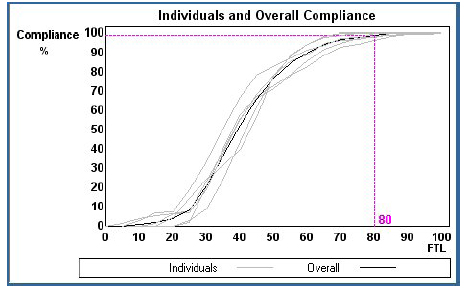
A graph (see following figure) shows the changes in compliance over time of each employee and the overall work schedule with fatigue tolerance levels ranging from 0 to 100.
For an FTL set at 80, overall compliance is approximately 99%.
Setting the fatigue tolerance level
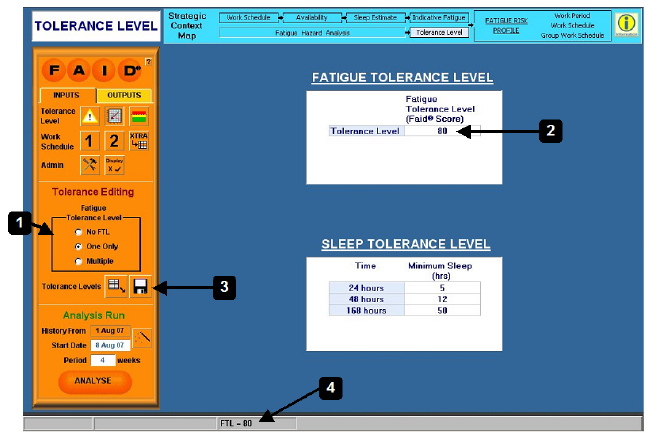
Users select the fatigue tolerance level (1), and enter the level in the table cell (2). The “save” button (3) is used to keep the FTL for future use.
The FTL chosen is displayed in the bottom window throughout the program (4).
Studies suggest that FAID scores below 80 are broadly consistent with a safe system of work and scores above a 100 are broadly consistent with an unsafe system of work. These scores have been independently scrutinized and accepted as evidence in accident investigations by agencies including the Australian Transportation Safety Bureau and the Special Commission of Inquiry into the Waterfall Rail Accident near Sydney, Australia.
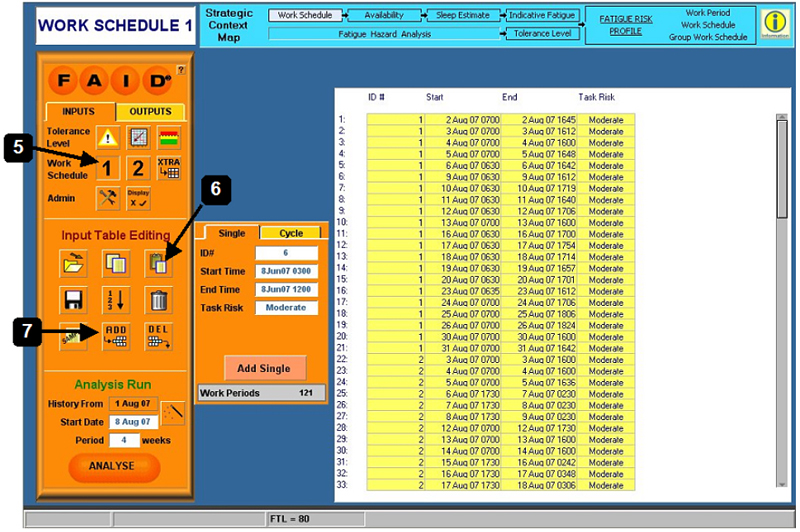
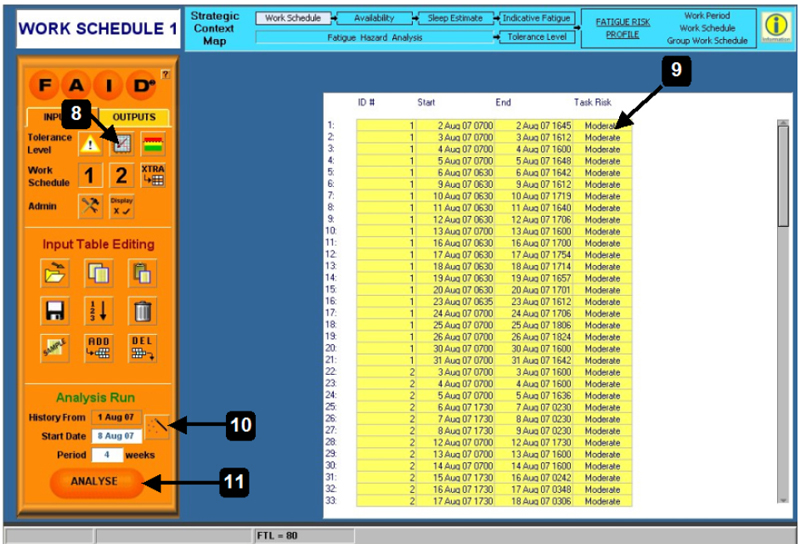
Work schedules can be entered by selecting (5) (for the first work schedule), and either opening an existing file (6), pasting schedules from a Microsoft Excel file (7), or manually typing them in.
Maximum FAID score thresholds can be entered in the far right hand column of each shift (9).
Once the data has been entered, use the Wizard button (10), check that the date and length of the work schedule are correct, then click Analyse (11).
Once the analysis is complete, a summary of the results is displayed.
When one or multiple fatigue tolerance levels have been set, the Indicative Fatigue Assessment Results screen displays the compliance level (the percentage of time employees worked when their fatigue was below the FTL) of the schedule. The software also displays the number of hours of worked and how much time was spent in the various fatigue zones (FAID Green, Yellow, and Red Conditions).
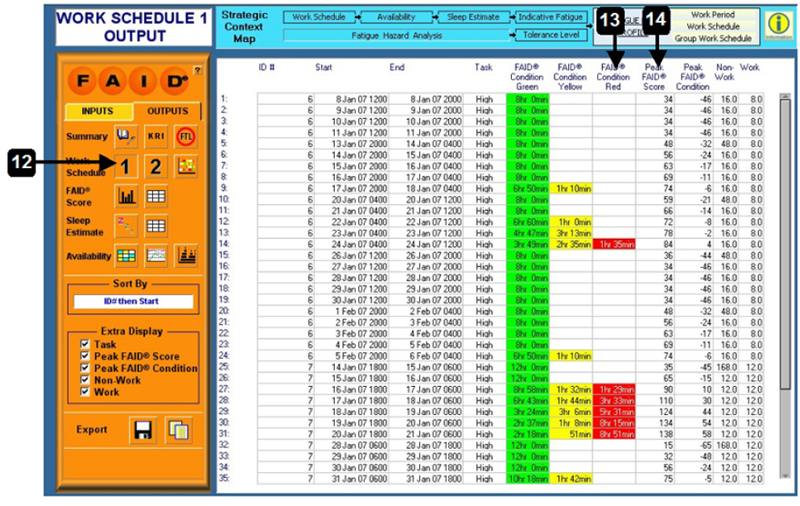
The software can also display the results for each work period of the work schedule. Click the Work Schedule 1 button (12) and the program displays the work schedule along with additional information about the degree of fatigue likelihood. The FAID Condition Red column (13) shows the time worked by an employee above the FTL. The Peak FAID Score column (14) shows the fatigue likelihood score for each work period.
Clicking the Key Risk Indicators (KRI) button (15) displays overall and individual summaries, such as compliance with FTL and peak FAID condition, based on the thresholds entered on the input screen.
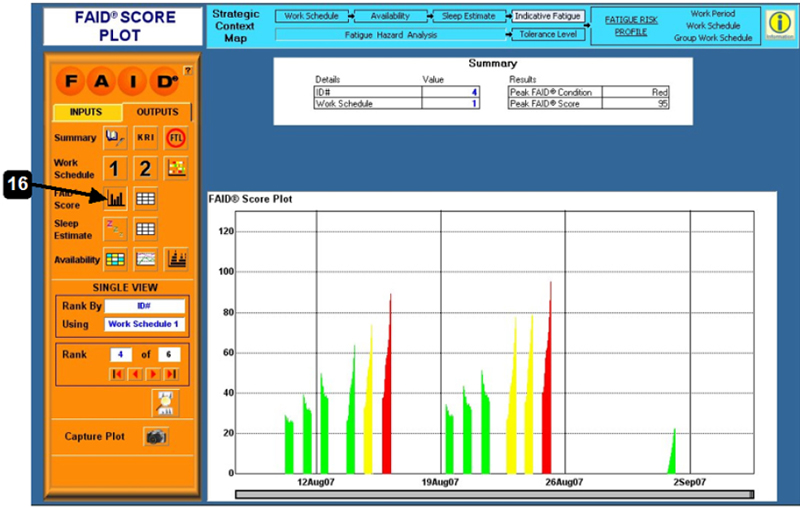
Individual work periods can be examined using the FAID Score Plot button (16). Each line on the graph represents an individual employee, coloured to represent the peak FAID condition. Each spike on the graph represents a single work period, and the corresponding fatigue likelihood score.
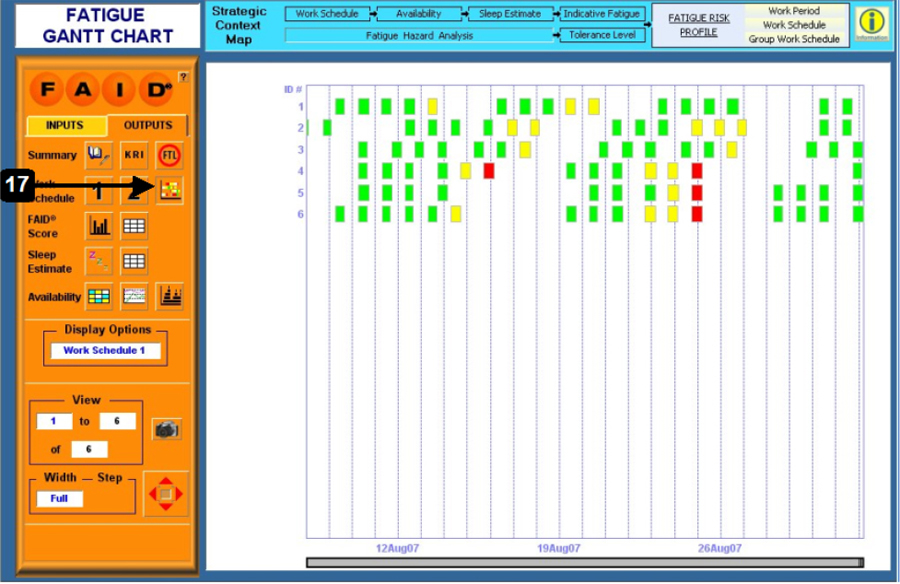
A Gantt chart (17) can be used to examine overall trends in the data, such as seasonal variations or specific employees who have exceptionally high fatigue likelihood scores. Each row on the Gantt chart represents an individual employee, and each square represents a single shift.
3. Manual Fatigue Audit System
Overview
For organizations with relatively simple schedules or that may not want to invest in software, manual calculations can also be performed to generate scores that provide an indication of fatigue likelihood. A fatigue likelihood scoring matrix uses five scheduling parameters to predict sleep opportunity. These can be used to estimate the degree of work-related fatigue produced by a given schedule:
-
Total number of hours worked in a seven-day period. Not surprisingly, as total hours worked increases, sleep opportunity decreases.
-
Maximum length of an individual shift. As the length of a given shift increases, the subsequent sleep opportunity decreases.
-
Minimum length of a short break. A short break is defined as a single sleep opportunity between work periods. It is typically shorter than 32 hours. Not surprisingly, as the break between shifts decreases, so does sleep opportunity.
-
Total number of hours worked between 9 p.m. and 9 a.m. in a seven-day period. This parameter takes into account late finishes, early starts, and night work. All of these will reduce night sleep opportunity and result in a significant reduction in total sleep opportunity.
-
Frequency of long breaks. A long break is defined as a period of two night sleeps with a non-working day in between. Long breaks typically provide a significant opportunity to recover from sleep loss accumulated over a sequence of work periods. A schedule can be scored on each of the five parameters using the following table.
Fatigue Likelihood Scoring Matrix for Work Schedules
| Score | 0 | 1 | 2 | 4 | 8 |
|---|---|---|---|---|---|
| a) Total hours per 7 days | 36 hours | 36.1 – 43.9 | 44 – 47.9 | 48 – 54.9 | 55+ |
| b) Maximum shift duration | 8 hours | 8.1 – 9.9 | 10 – 11.9 | 12 – 13.9 | 14+ |
| c) Minimum short break duration | 16 hours | 15.9 – 13 | 12.9 – 10 | 9.9 – 8 | 8 |
| d) Maximum night work per 7 days | 0 hours | 0.1 – 8 | 8.1 – 16 | 16.1 – 24 | 24+ |
| e) Long break frequency | 1 in 7 days | 1 in 7 days | 1 in 14 days | 1 in 21 days | 1 in 28 days |
The points for each parameter are added up to provide a score between 0 and 40 that indicates the degree of sleep opportunity provided by the schedule. Schedules with a lower score offer a greater sleep opportunity. The figure below shows several schedules scored using this approach.
Fatigue Likelihood Score
Examples of different schedules scored using the Fatigue Likelihood Scoring Matrix
Example 1
| Day | Description | Start | Finish |
|---|---|---|---|
| 1 | Morning | 0500 | 1400 |
| 2 | Morning | 0500 | 1400 |
| 3 | Afternoon | 1330 | 2230 |
| 4 | Afternoon | 1330 | 2230 |
| 5 | Off | 0000 | 0000 |
| 6 | Night | 2200 | 0600 |
| 7 | Night | 2200 | 0600 |
Using the five parameters, this schedule would be scored as follows:
-
The total number of hours worked during the seven-day work period is 52 (4 points).
-
The maximum shift duration is 9 hours (1 point).
-
The minimum time off between shifts (short break) is 15 hours (1 point).
-
The total hours of night work scheduled for the seven-day period is 23. This includes 4 hours on each of the morning shifts due to the early shift starts, 1.5 hours on each of the afternoon shifts due the late finish, and 8 hours on each of the night shifts (4 points).
-
The long break frequency is 1 day within the 7 days of the schedule before the individual starts the night shift on Day 6 (0 points).
The total score for the above schedule is 10 points.
Example 2
| Day | Description | Start | Finish |
|---|---|---|---|
| 1 | Day | 0600 | 1400 |
| 2 | Day | 0600 | 1400 |
| 3 | Off | 0000 | 0000 |
| 4 | Afternoon | 1400 | 2300 |
| 5 | Afternoon | 1400 | 2300 |
| 6 | Afternoon | 1400 | 2300 |
| 7 | Night | 2300 | 0600 |
Using the five parameters, this schedule would be scored as follows:
-
The total number of hours worked during the seven-day work period is 50 (4 points).
-
The maximum shift duration is 9 hours (1 point).
-
The minimum time off between shifts (short break) is 15 hours (1 point).
-
The total hours of night work scheduled for the seven-day period is 19. The employee works 3 hours on each of the morning shifts due to the early start, 2 hours on each of the afternoon shifts due the late finish, and 7 hours on the night shift (4 points).
-
The long break frequency is 1 day before the individual starts the afternoon shift on Day 4 (0 points).
Le pointage total de l’horaire ci-dessus est de 10 points.
Summary
Any work schedule can be run through this scoring system. For example:
-
Monday to Friday, 9 a.m. to 5 p.m (40 hours) receives a score of 1
-
Monday to Friday, 3 p.m. to 11 p.m. (40 hours) receives a score of 3
-
4 days on – 4 days off (2 days from 6 a.m. to 6 p.m., 2 days from 6 p.m. to 6 a.m., for a total of 48 hours) receives a score of 14
-
Monday to Friday, 6 a.m. to 6 p.m. (60 hours) receives a score of 16
-
7 night shifts of 12 hours, 9 p.m. to 9 a.m. (84 hours), followed by 7 days off receives a score of 22
Based on a company’s risk assessments, managers can consider whether existing work schedules produce acceptable levels of fatigue-related risk.
4. Conclusion
Beyond Level 1 controls
The software described in this document is intended help managers analyse work schedules for potential fatigue-related risk. However, using appropriate scheduling practices is only one component of an effective a fatigue risk management system. There will always be occasions when employees, intentionally or unintentionally, fail to get enough sleep. Even with sufficient sleep, fatigue-related symptoms can still occur if employees get poor quality sleep or have an undetected sleep disorder.
Under the five-level model of fatigue risk management that is at the heart of this toolbox, companies also need controls to determine whether employees are getting enough sleep (Level 2) and to detect fatigue-related symptoms on the job (Level 3). Organizations also need a process to deal with fatigue-related errors or incidents (Levels 4 and 5) to identify potential incidents, to learn from mistakes, and to check the effectiveness of previous levels of control.
A system with little or no hazard control beyond Level 1 scheduling tools is poorly defended against fatigue-related incidents.
Shared responsibility for managing fatigue
The responsibility for managing fatigue-related risk in an FRMS is shared between employers and employees. The Level 1 controls outlined in this document address the employer’s responsibility to manage schedule-related causes of fatigue. In Levels 2 to 5, employees are responsible for managing the causes of their own fatigue, and for reporting situations where they observe a fatigue-related risk. The employer is responsible for setting up clear and fair procedures that enable both groups to exercise their responsibilities. Policies and Procedures Development Guidelines (TP 14576E) provides further guidance as well as examples of policies and procedures for appropriate management of fatigue-related risk.
Resources
Åkerstedt, T., Folkard, S., & Portin, C. (2004). Predictions from the three-process model of alertness. Aviation, Space and Environmental Medicine, 75 (3, Supplement).
Civil Aviation Authority (October 2005). Aircrew Fatigue: A Review of Research Undertaken on Behalf of the UK Civil Aviation Authority. Paper 2005/04. Norwich: The Stationery Office.
Fatigue Risk (2007). FAST™. Retrieved June 14, 2007, from http://fatiguerisk.com/?page_id=5
Fatigue Risk (2007). xsRiskPro. Retrieved June 14, 2007, from http://fatiguerisk.com/?page_id=6
Dawson, D., & Fletcher, A. (2001). A quantitative model of work-related fatigue: Background and definition. Ergonomics, 44 (2).
Dawson, D., & Reid, K. (1997). Fatigue, alcohol and performance impairment. Nature, 388 (6639).
Fletcher, A., & Dawson, D. (1997). A predictive model of work-related fatigue based on hours of work. Journal of Occupational Health and Safety Australia and New Zealand, 13 (5).
Fletcher, A., & Dawson, D. (2001). A quantitative model of work-related fatigue: Empirical evaluations. Ergonomics, 44 (5).
Fletcher, A., & Dawson, D. (1998). A work-related fatigue model based on hours-of-work. In: L. Hartley (ed.) Managing Fatigue in Transportation, Oxford: Pergamon Press.
Fletcher, A., & Dawson, D. (2001). Field-based validations of a work-related fatigue model based on hours of work. Transportation Research Part F, 4 (1).
Fletcher, A., Roach, G.D., Lamond, N., & Dawson, D. (2000). Laboratory based validations of a work-related fatigue model based on hours of work. In: S. Hornberger, P. Knauth, G. Costa and S. Folkard (eds.) Shiftwork in the 21st Century: Challenges for Research and Practice. Frankfurt: Peter Lang.
Folkard, S. & Åkerstedt, T. (1991). A three process model of the regulation of alertness and sleepiness. In R. Ogilvie, R.T. Wilkinson and R.J. Broughton (eds.) Sleep, Arousal and Performance: Problems and Promises. Boston: Birkhäuser.
Jewett, M.E. (1997). Models of circadian and homeostatic regulation of human performance and alertness. Cambridge: Harvard University.
Jewett, M.E., & Kronauer, R.E. (1999). Interactive mathematical models of subjective alertness and cognitive throughput in humans. Journal of Biological Rhythms, 14.
Hursh, S.R., Redmond, D.P., Johnson, M.L., Thorne, D.R., Belenky, G., Balkin, T.J., Storm, W.F., Miller, J.C., & Eddy, D.R. (2004). Fatigue models for applied research in warfighting. Aviation, Space, and Environmental Medicine, 75 (3, Supplement).
Kronauer, R.E., Forger, D., & Jewett, M.E. (1999). Quantifying human circadian pacemaker response to brief, extended, and repeated light episodes over the photopic range. Journal of Biological Rhythms, 14.
Mallis, M.M., Mejdal, S., Nguyen, T.T., & Dinges, D.F. (2004). Summary of the key features of seven biomathematical models of human fatigue and performance. Aviation, Space & Environmental Medicine, 75 (3, Supplement).
Moore-Ede, M., Heitmann, A., Guttkuhn, R., Trutschel, U., Aguirre, A., & Croke, D. (2004). Circadian alertness simulator for fatigue risk assessment in transportation: application to reduce frequency and severity of truck accidents. Aviation, Space & Environmental Medicine, 75 (3, Supplement).
Reeves, M. (2007). Software Review: SAFTE. Ergonomics in Design, 15 (2).
Williamson, A.M., & Feyer, A.M. (2000). Moderate sleep deprivation produces impairments in cognitive and motor performance equivalent to legally prescribed levels of alcohol intoxication. Occupational and Environmental Medicine, 57 (10).

