Key messages:
- The Port of Montréal is the 2nd largest container port in Canada after Vancouver, handling over 1.6 million Twenty Foot Equivalent Units (TEU) and 35 million tonnes of cargo, representing about $40 billion in goods.
- It is estimated that the cost to the Canadian economy of a full shutdown of the Port could reach between $40M and $100M per week.
- About 50% of the total tonnage of bulk commodities handled at the Port, is not impacted. Grain loading/unloading activities are protected under the Canada Labour Code, while liquid bulk (e.g. oil, gasoline) workers are represented under a different union. In addition resupply activities to Newfoundland and Labrador is not be impacted as per the June 2020 Canadian Industrial Relations Board ruling.
- A work stoppage is however significantly affecting movements of containerized goods and commodities such as agri-food, forest products, metals with negative impacts on consumers and businesses.
- The Port has already recorded a sharp decline in container traffic in March 2021, as high volume shippers have been using alternative US gateways.
- The strike may result in permanent diversion of import container traffic to US East Coast ports (20 to 30 thousands TEU).
Importance of the Port:
The Port of Montréal handled 35 million tonnes of cargo in 2020, representing about $40 billion in goods and 2,000 vessels. The Port is a major link in the Canadian and U.S. supply chain of raw materials and various containerized products. The port is serving a population of 40 million consumers within a 1-day drive by truck and an additional 70 million consumers within a 2-day trip by train.
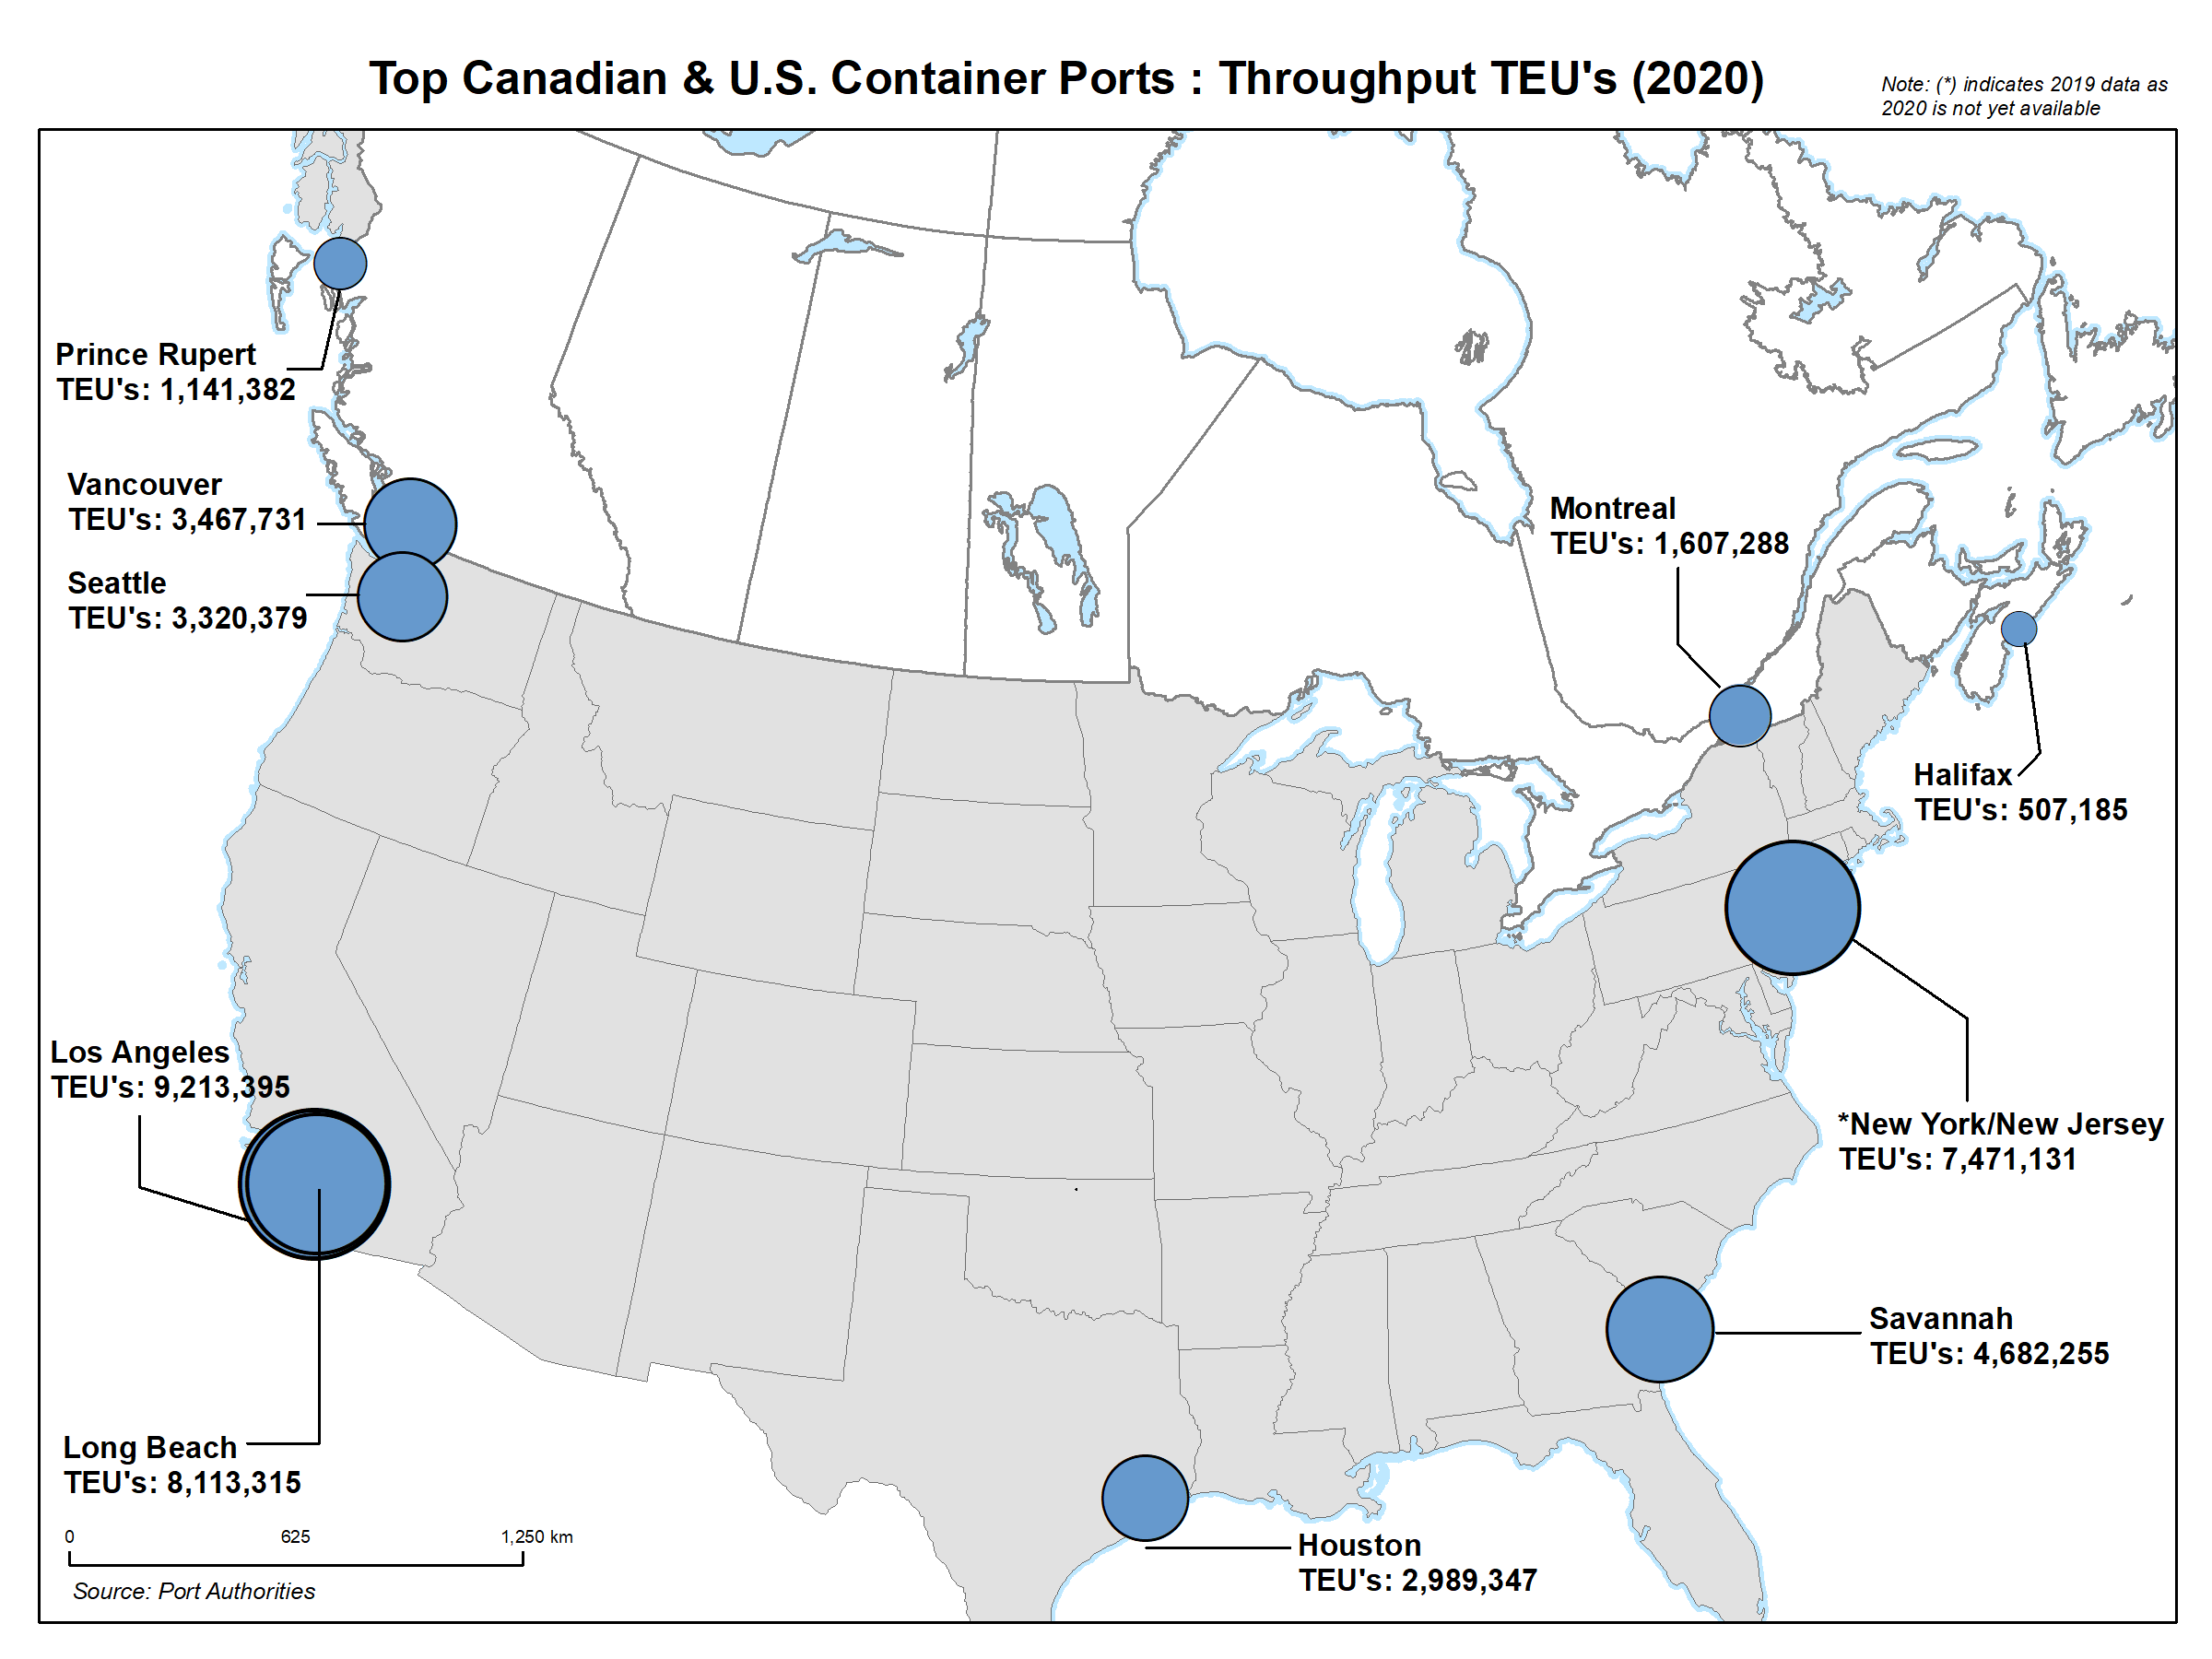
It is also the 2nd largest container port in Canada after the Port of Vancouver (ahead of Prince Rupert) and the 12th largest in North America, handling over 1.6 million Twenty Foot Equivalent Units (TEUs) in 2020.
Montréal is also a large cruise port with around 112,000 passengers in 2019, representing 76 port calls. There was no cruise traffic in 2020 due to COVID-19.
Port activities create more than 19,000 direct and indirect jobs, and generate approximately $2.6 billion in annual economic impact ($50.0 million a week).
More details on the importance of the Port are provided in Annex A.
Economic impact analysis
Transport Canada, in partnership with the ESDC’s Labour Program, estimated the possible impacts on Canadian gross domestic product (GDP) from a full shutdown of the container and bulk terminals of the Port due to a work stoppage (details on these methodologies are provided in Annex E).
Results suggest that a full shutdown will result in net losses to Canadian GDP ranging from $3 to $6 million per day during the first 3-5 days ($40M/week) of a work stoppage and quickly increasing to $15 million per day thereafter ($100M/week).
In the first few days of the stoppage, costs are mostly borne by Quebec’s transportation sector. As the stoppage continues, other sectors of the economy dependent on cargo transitioning through the Port of Montréal will find it increasingly difficult to access key production inputs (e.g. gasoline, jet fuel, and construction materials), forcing industries such as manufacturing, construction and sales to reduce and/or shut down operations. Moreover, exporting sectors will face losses from delays in getting their exports to market and from the use of less efficient transit options. The provinces of Québec and Ontario would bear more than 92% of the impact as the Port of Montréal mainly serves Central Canada.
Potential rerouting options
Information from the August 2020 strike at the Port of Montréal, and previous strikes in Western Canada and U.S. ports and railways, suggests that supply chains will be increasingly rerouted away from the Port of Montréal and towards alternative options as a work stoppage becomes imminent, or as its duration increases. Containerized cargo is at higher risk and can be redirected to substitute ports or alternative modes of transportation (most often with increased cost or time to market). For bulk cargo, options are more limited, and redirection is likely to occur much more slowly.
Containerized Cargo Rerouting Options and Impacts from August 2020 Strike
Approximately [ATIP redacted] of inbound containers handled at the Port of Montréal are destined for Central Canada – about [ATIP redacted] twenty-foot equivalent units (TEUs) (see map in Annex B) – the most likely Canadian re-routing option is through the other Eastern Canadian ports, specifically the Port of Halifax.
Additionally, inbound container traffic destined for the U.S. represents around [ATIP redacted] (approximately [ATIP redacted] TEUs).
Only a small portion ([ATIP redacted] or about [ATIP redacted] TEUs) of the inbound containers handled at Montréal are destined for the Prairies and British Columbia –
The following analysis provide more details about alternative container ports.
Port of Halifax
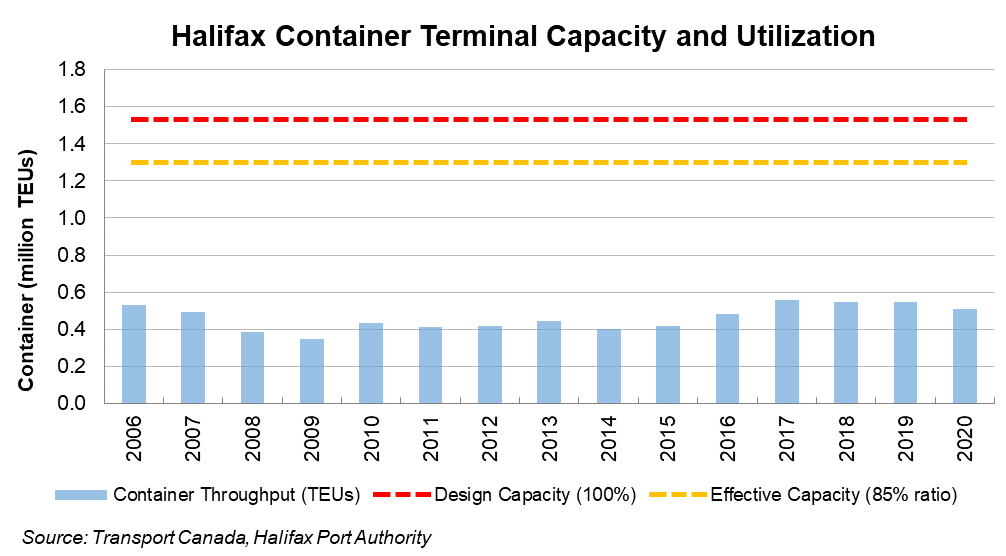
Halifax’s container terminals are currently underutilized, with effective capacity utilization of roughly [ATIP redacted] over the past three years (see charts in Annex C). However, limited rail network capacity in Atlantic Canada (only served by CN) poses constraints on the use of this alternative, as surge demand would effectively increase intermodal traffic by more than [ATIP redacted].
During the August 2020 strike, at least 12 container vessels were diverted to Halifax, discharging approximately [ATIP redacted] containers. CN was only able to marginally increase their daily rail car supply to accommodate the diverted containers on top of the containers discharged from regular schedules. As a result, on-dock container dwell times were above 10 days for several weeks and the Port estimated it would take [ATIP redacted] to clear the backlog of diverted containers.
[ATIP redacted]
Port of Saint John
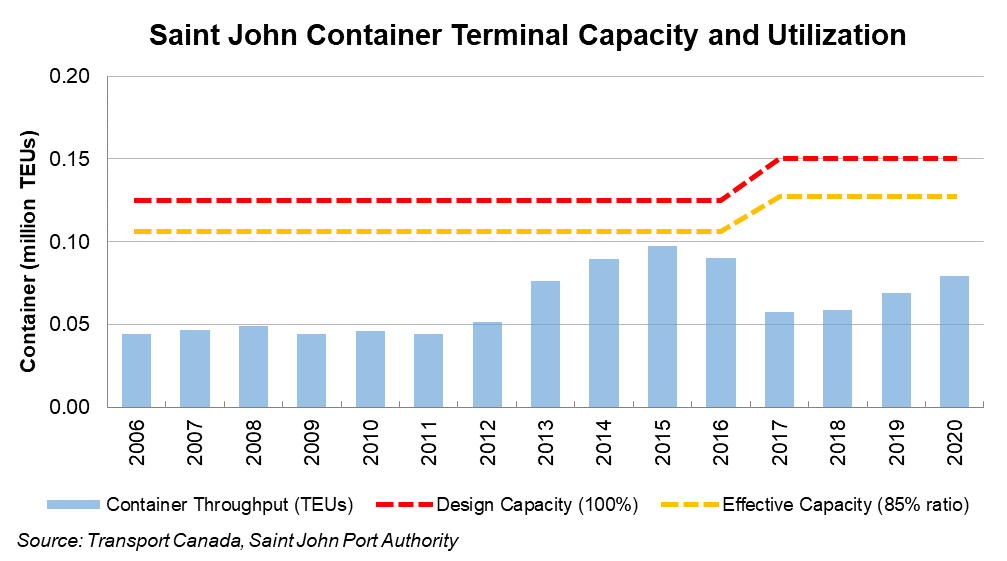
The Port of Saint John is now served by both CN and CP, and is also undergoing a modernization project that will increase their container handling capacity (to be completed in 2023) however they are currently limited to approximately 150,000 TEUs annually.
A minimum of 4 vessels were diverted to the Port of Saint John and approximately [ATIP redacted] TEUs of diverted cargo was discharged at the port over the course of the strike in August 2020. The Port estimates that it took about 4-6 weeks to clear the backlog of containers. They indicated that new container handling equipment, acquired as part of their modernization initiative, allowed them to handle the surge in containers while maintaining terminal fluidity.
Other Gateways
An alternative option for Central Canada and Midwest US container traffic are ports along the U.S. East Coast, specifically New York-New Jersey. Rerouting decisions are based on estimations of added cost and surface connectivity options. Many of those ports handle significantly larger traffic than the Port of Montreal, have high rail connectivity and are already serving U.S. destinations. If the strike was to persist over time, there is an added risk of permanent diversion of the inbound container traffic to competing U.S. ports.
Canadian West Coast ports is a potential alternative for handling intermodal traffic destined to the Prairies and British Columbia. However, this rerouting options would present significant challenges for the current supply chains (e.g. higher congestion and transit times), and would likely be of more significant cost.
Bulk Cargo Rerouting Options
The Port of Montréal handles significant volumes of fuel/oil products, grain, and forest products (shipped via bulk carriers or transhipped in containers). Similar to the August 2020 strike, cargo handling activities at the liquid bulk terminals and grain terminal (Viterra) are not be impacted by a potential work stoppage. Dry bulk activities (outside of grain), specifically exports and containerized transhipments are impacted but rerouting options are limited.
Forest
Containerized forest products are the fourth largest component of port outbound cargo volumes with 1.7 million tons or 9% of the outbound traffic. It is possible that some of the forest products typically shipped to U.S. ports could move by alternative surface modes. However, overseas exports would have very limited alternative rerouting options.
Grain
No major disruption in the supply chain of grain is expected as grain vessels loading/unloading activities are protected under the Canada Labour Code. However, grain that is containerized for exports (more than 900k tonnes a year) are impacted.
Impact on remote communities
The Port of Montréal, along with other Québec ports along the St-Lawrence River including Valleyfield, Ste-Catherine, and Québec City, are the origin for most of the marine services to the Arctic, as well as to the northern and remote communities in Eastern Canada.
Oceanex operates two all-year-round feeder services to Newfoundland & Labrador: one from the Port of Montréal (twice a week) and one from Halifax. Oceanex handles containers, drop-trailers, and roll-on roll-off cargo. These activities are protected during the work stoppage.
Fednav, Nunavut Eastern Arctic, and Desgagnés Transarctik, Canada’s main arctic and northern sealift operators, typically serve remote, northern, and arctic communities during the summer and autumn. Vessels operated by these companies may occasionally make a stop in the Port of Montréal. However, none of these companies are based in Montréal and most of their operations occur over the period from June to November.
Other shipping services offered by Canadian marine carriers to/from the Port of Montréal to/from communities in Eastern Canada include those of Petronav (7,500 tonnes of fuel) and CSL (salt), which operate services between Montréal and Îles de la Madeleine once or twice a year. A disruption at the Port of Montréal may force communities in Eastern Canada to rely on fuel supplied by vessels operating from other nearby ports such as Lévis, Come By Chance (NL) or St-John (NB).
Annex A: Importance of the Port of Montréal to the Canadian Economy
- The Port of Montréal handles more than 35 million tonnes of cargo yearly (673,000 tonnes per week), representing just under $40 billion in goods ($763 million a week) and 1,982 vessels (more than 38 a week).
- By tonnage, containerized goods is the largest component of cargo traffic at the Port making up for 41% of overall inbound and outbound tonnage, followed by liquid bulk (35%) and dry bulk (24%).
- Montréal is also the 2nd largest container port in Canada after the Port of Vancouver (but ahead of Prince Rupert) and the 12th largest in North America, handling 1.61 million Twenty Foot Equivalent (TEU) in 2020 (30,900 TEU a week). The Port of Montréal is also the only container port along the Quebec-Ontario Continental Gateway, the most populated and industrialized region in Canada.
- The Port of Montréal represents a major link in the Canadian and U.S. supply chain of raw materials and various products. It serves a population of 40 million consumers within a 1-day drive by truck and an additional 70 million consumers within a 2-day trip by train.
- The principal handled merchandise in volume (Tables A-1, A-2, A-3) are grain (16.6%) petroleum products including crude oil (16.0%), gasoline (9.7%), as well as food stuff (8.6%) and fuel oil (5.4%).
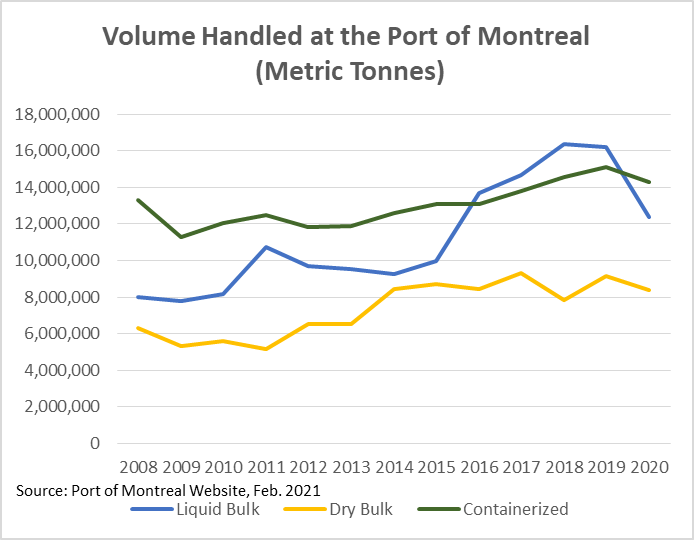
Volume Handled at the Port of Montreal - Text version
The lines in this chart show the volume throughput in metric tonnes for Liquid Bulk, Dry Bulk, and Containerized goods, by year, for the Port of Montreal.
Year
Liquid Bulk
Dry Bulk
Containerized goods
2008
8,005,416
6,324,357
13,321,147
2009
7,773,149
5,316,432
11,265,868
2010
8,151,136
5,584,939
12,033,434
2011
10,750,453
4,945,677
12,471,002
2012
9,706,702
6,537,448
12,032,966
2013
9,549,933
6,550,691
11,896,671
2014
9,246,740
8,433,433
12,575,069
2015
9,970,667
8,740,279
13,092,607
2016
13,696,988
8,419,192
13,062,887
2017
14,660,949
9,331,783
13,819,388
2018
16,375,279
7,826,739
14,537,522
2019
16,214,695
9,165,170
15,087,005
2020
12,397,584
8,376,800
14,263,000
- Over two-thirds of the Port of Montréal’s merchandise volume is traded internationally. This share has increased over time in part due to new trade agreements, including CETA and CPTPP. Main trading partners include Europe (notably the United Kingdom), the United States, and Asia (Table A-4).
- The Port of Montréal is a large cruise port with around 111,604 passengers representing 76 port calls in 2019. There was no cruise traffic in 2020 due to COVID-19.
- Port activities in Montréal create more than 19,000 direct and indirect jobs, and generate approximately $2.6 billion in annual economic impact (50.0 million a week).Footnote 1
|
|
Million metric tonnes |
% of total |
|---|---|---|
|
Grain (bulk and containerized) |
5.8 |
16.6% |
|
Crude Oil |
5.6 |
16.0% |
|
Gasoline |
3.4 |
9.7% |
|
Food Stuff |
3.0 |
8.6% |
|
Fuel Oil |
1.9 |
5.4% |
|
Forest Products |
1.8 |
5.1% |
|
Iron Ore |
1.8 |
5.1% |
|
Various Metal Products |
1.2 |
3.4% |
|
Steel Products |
0.8 |
2.3% |
|
Other |
9.7 |
27.7% |
|
Total |
35.0 |
100.0% |
|
Source: Port of Montréal Statistics, latest available data as of February 4th, 2021. |
||
|
Goods |
Million metric tonnes |
% of total |
|---|---|---|
|
Crude Oil |
5.3 |
31.2% |
|
Grain (bulk and containerized |
3.4 |
20.0% |
|
Forest Products |
1.4 |
8.2% |
|
Fuel Oil |
1.1 |
6.5% |
|
Food Products |
1.0 |
5.9% |
|
Gasoline |
0.8 |
4.7% |
|
Diesel Oil |
0.4 |
2.4% |
|
Various Metal Products |
0.6 |
3.5% |
|
Steel Products |
0.3 |
1.8% |
|
Other |
2.7 |
15.9% |
|
Total |
17.0 |
100.0% |
|
Source: Port of Montréal Statistics, latest available data as of February 4th, 2020. |
||
|
Goods |
Million metric tonnes |
% of total |
|---|---|---|
|
Gasoline |
2.6 |
14.4% |
|
Grain (bulk and containerized) |
2.3 |
12.8% |
|
Food Products |
2.0 |
11.1% |
|
Iron Ore |
1.7 |
9.4% |
|
Fuel Oil |
0.8 |
4.4% |
|
Raw Sugar |
0.6 |
3.3% |
|
Various Metal Products |
0.6 |
3.3% |
|
Building Materials |
0.6 |
3.3% |
|
Steel Products |
0.6 |
3.3% |
|
Aircraft Fuel |
0.3 |
1.7% |
|
Other |
5.9 |
32.8% |
|
Total |
18.0 |
100.0% |
|
Source: Port of Montréal Statistics, latest available data as of February 4th, 2021. |
||
|
Country/Region |
Million metric tonnes |
% of total |
|---|---|---|
|
UK/Europe |
6.5 |
21.1 |
|
Asia |
3.8 |
12.4 |
|
United States |
3.3 |
10.8 |
|
Mediterranean |
3.1 |
9.9 |
|
Latin America |
1.9 |
6.1 |
|
Middle East |
1.4 |
4.4 |
|
Africa |
0.6 |
1.8 |
|
Oceania |
0.1 |
0.3 |
|
Other |
0.001 |
0.03 |
|
International Sub-Total |
20.7 |
66.9 |
|
Domestic |
10.2 |
33.1 |
|
Total |
30.9 |
100% |
|
Note: The statistics reflect waterborne cargo flows between the Port of Montréal and other ports, both international and domestic. Source: Port of Montréal Statistics, latest available data as of February 4th, 2021. |
||
|
Port |
Million metric tonnes |
% of total |
|---|---|---|
|
Vancouver |
3,467.5 |
51.0% |
|
Montreal |
1,607.3 |
23.6% |
|
Prince Rupert |
1,141.4 |
16.8% |
|
Halifax |
507.2 |
7.5% |
|
Saint John |
79.2 |
1.2% |
|
Total |
6,802.6 |
100.0% |
|
Source: Canadian Port Authority statistics, latest available data as of February 11th, 2021 |
||
|
Port |
Million metric tonnes |
% of total |
|---|---|---|
|
Vancouver |
144.2 |
41.6% |
|
Montreal |
38.7 |
11.2% |
|
Prince Rupert |
29.9 |
8.6% |
|
Sept-Iles |
29.3 |
8.4% |
|
Quebec |
29.0 |
8.4% |
|
Top 5 Sub-total |
271.1 |
78.2% |
|
CPA Total |
346.8 |
100.0% |
|
Source: Canadian Port Authority statistics, latest available data as of February 11th, 2021 |
||
Annex B: Key Maps
Top Canadian & U.S. Container Ports: Throughput TEU's (2020) - Text version
Map denoting Canadian and American Container ports and the total TEU (twenty foot equivalent unit) volume throughput for 2020. – Source: Port Authorities
|
Port Location |
TEU Volume |
|---|---|
|
Prince Rupert, BC |
1,114,382 |
|
Vancouver, BC |
3,467,731 |
|
Seattle, WS |
3,320,379 |
|
Los Angeles, CA |
9,213,395 |
|
Long Beach, CA |
8,113,315 |
|
Houston, TX |
2,989,347 |
|
Savanah, GA |
4,682,255 |
|
New York / New Jersey |
7,471,131 |
|
Halifax, NS |
507,185 |
|
Montreal, QC |
1,607,288 |
[ATIP redacted]
Annex C: Port of Montréal and Port of Halifax Container Terminal Capacity and Usage
Montreal Port Authority – Container Terminal Capacity
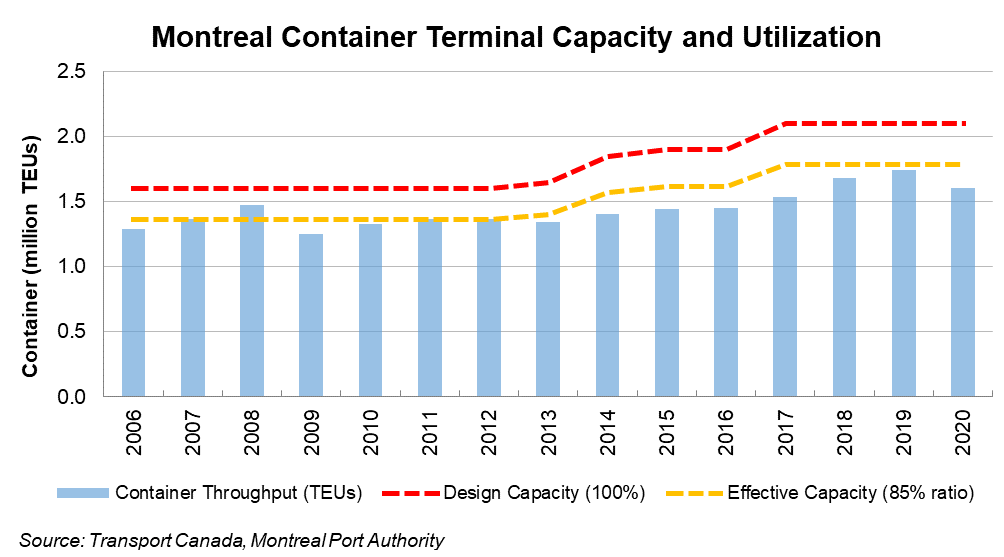
Montreal Container Terminal Capacity and Utilization - Text version
The lines in this chart show the Container Throughput in TEU (Twenty Foot Equivalent Units), the Design Capacity of the terminal, and the 85% Effective Capacity of the terminal, by year, for the Port of Montreal.
|
Year |
Container Throughput (in TEUs) |
Design Capacity (100%) |
Effective Capacity (85%) |
|---|---|---|---|
|
2006 |
1,288,910 |
1,600,000 |
1,360,000 |
|
2007 |
1,363,021 |
1,600,000 |
1,360,000 |
|
2008 |
1,473,914 |
1,600,000 |
1,360,000 |
|
2009 |
1,247,690 |
1,600,000 |
1,360,000 |
|
2010 |
1,331,351 |
1,600,000 |
1,360,000 |
|
2011 |
1,362,975 |
1,600,000 |
1,360,000 |
|
2012 |
1,364,340 |
1,600,000 |
1,360,000 |
|
2013 |
1,346,065 |
1,650,000 |
1,402,500 |
|
2014 |
1,402,393 |
1,850,000 |
1,572,500 |
|
2015 |
1,446,075 |
1,900,000 |
1,615,000 |
|
2016 |
1,447,566 |
1,900,000 |
1,615,000 |
|
2017 |
1,537,669 |
2,100,000 |
1,785,000 |
|
2018 |
1,679,351 |
2,100,000 |
1,785,000 |
|
2019 |
1,742,244 |
2,100,000 |
1,785,000 |
|
2020 |
1,607,288 |
2,100,000 |
1,785,000 |
Halifax Port Authority – Container Terminal Capacity
Halifax Container Terminal Capacity and Utilization - Text version
The lines in this chart show the Container Throughput in TEU (Twenty Foot Equivalent Units), the Design Capacity of the terminal, and the 85% Effective Capacity of the terminal, by year, for the Port of Halifax.
|
Year |
Container Throughput (in TEUs) |
Design Capacity (100%) |
Effective Capacity (85%) |
|---|---|---|---|
|
2006 |
529,890 |
1,530,000 |
1,300,500 |
|
2007 |
490,072 |
1,530,000 |
1,300,500 |
|
2008 |
387,347 |
1,530,000 |
1,300,500 |
|
2009 |
346,548 |
1,530,000 |
1,300,500 |
|
2010 |
434,910 |
1,530,000 |
1,300,500 |
|
2011 |
409,773 |
1,530,000 |
1,300,500 |
|
2012 |
416,151 |
1,530,000 |
1,300,500 |
|
2013 |
441,681 |
1,530,000 |
1,300,500 |
|
2014 |
399,613 |
1,530,000 |
1,300,500 |
|
2015 |
418,162 |
1,530,000 |
1,300,500 |
|
2016 |
480,516 |
1,530,000 |
1,300,500 |
|
2017 |
559,242 |
1,530,000 |
1,300,500 |
|
2018 |
547,445 |
1,530,000 |
1,300,500 |
|
2019 |
546,691 |
1,530,000 |
1,300,500 |
|
2020 |
507,185 |
1,530,000 |
1,300,500 |
Saint John Port Authority – Container Terminal Capacity
Saint John Container Terminal Capacity and Utilization - Text version
The lines in this chart show the Container Throughput in TEU (Twenty Foot Equivalent Units), the Design Capacity of the terminal, and the 85% Effective Capacity of the terminal, by year, for the Port of Saint John.
|
Year |
Container Throughput (in TEUs) |
Design Capacity (100%) |
Effective Capacity (85%) |
|---|---|---|---|
|
2006 |
44,566 |
125,000 |
106,250 |
|
2007 |
46,754 |
125,000 |
106,250 |
|
2008 |
49,240 |
125,000 |
106,250 |
|
2009 |
44,382 |
125,000 |
106,250 |
|
2010 |
46,303 |
125,000 |
106,250 |
|
2011 |
44,377 |
125,000 |
106,250 |
|
2012 |
51,758 |
125,000 |
106,250 |
|
2013 |
76,269 |
125,000 |
106,250 |
|
2014 |
89,615 |
125,000 |
106,250 |
|
2015 |
97,465 |
125,000 |
106,250 |
|
2016 |
90,262 |
125,000 |
106,250 |
|
2017 |
57,402 |
150,000 |
127,500 |
|
2018 |
59,102 |
150,000 |
127,500 |
|
2019 |
68,901 |
150,000 |
127,500 |
|
2020 |
79,179 |
150,000 |
127,500 |
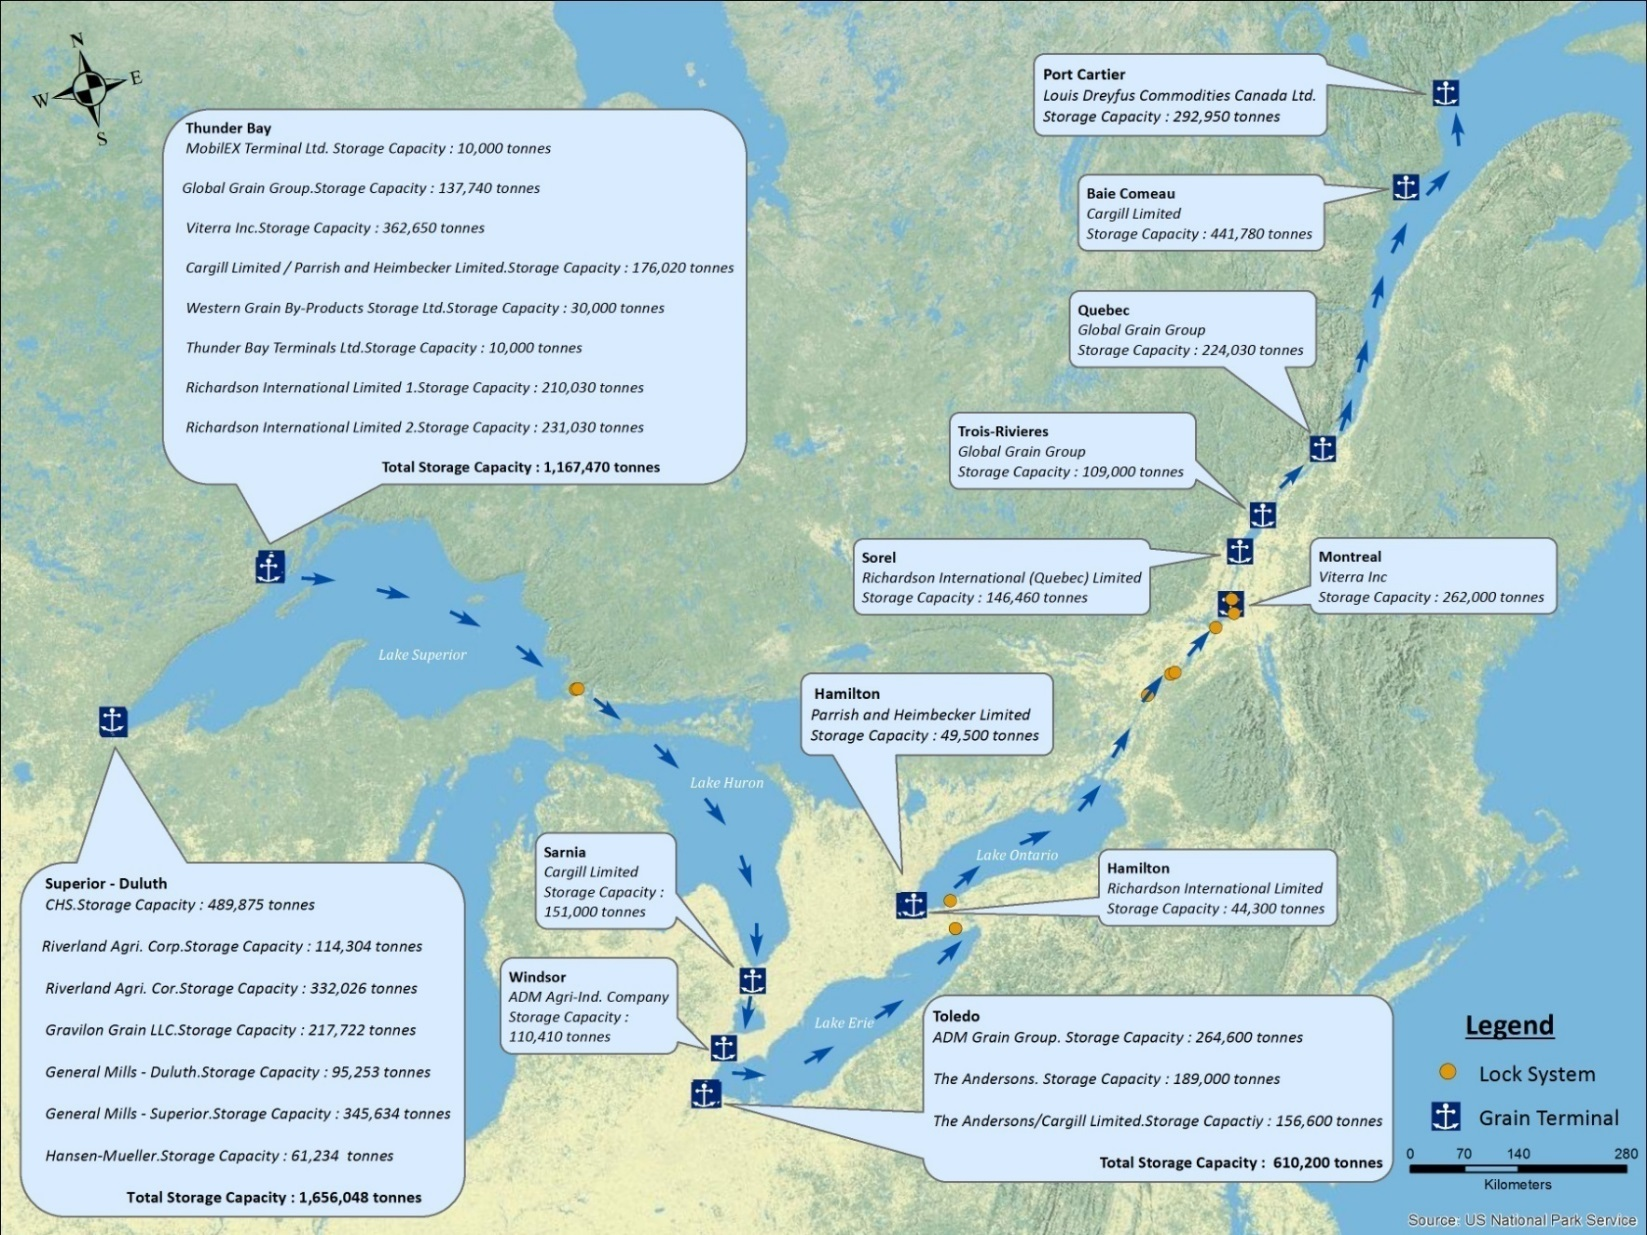
Annex D: Great Lakes and St. Lawrence Seaway Grain Terminals
Great Lakes and St. Lawrence Seaway Grain Terminals - Text version
Map of the Canadian and American Great Lakes and St. Lawrence Seaway Grain Terminals and associated storage capacity in tonnes.
|
Location of Port Storage Facilities |
Total storage capacity in tonnes |
|---|---|
|
Thunder Bay, ON |
1,167,470 |
|
Duluth, MN |
1,656,048 |
|
Toledo, OH |
610,200 |
|
Windsor, ON |
110,410 |
|
Sarnia, ON |
151,000 |
|
Hamilton, ON |
93,800 |
|
Montreal, QC |
262,000 |
|
Sorel, QC |
146,460 |
|
Trois Rivieres, QC |
109,000 |
|
Quebec City, QC |
224,030 |
|
Baie Comeau, QC |
441,780 |
|
Port Cartier, QC |
292,950 |
Annex E: Methodology for Economic Impact Analysis
Estimating the impact of a work stoppage at the Port on overall Gross Domestic Product (GDP) is challenged by lack of data on the timing and level of rerouting (i.e. re-direction to other ports; the use of rail and truck alternatives); the cost of using alternative ports and routes; and the costs borne by shippers waiting out the work stoppage and shipping their products through the Port of Montreal after the stoppage has ends. Distinguishing between net costs to the Canadian economy versus redistribution of income among workers and firms within Canada adds further complexity. The exercise below is meant to capture net costs.
With these significant caveats in mind, Table 1 below shows potential impacts on GDP resulting from a full shutdown of the Port of Montreal’s container and bulk terminals.
Table E-1: Daily impact on GDP of a work stoppage at the Port of Montréal
[ATIP redacted]
Table E-2E: Value of the Port of Montreal International Throughput, June-July, 2019
[ATIP redacted]
Supply and use methodology
This assessment is based on Statistics Canada’s supply use tables that measure the size of the contributions of different sectors of the Canadian economy to national final demand (i.e. Gross Domestic Product) and the interdependencies between these sectors. These estimates represent the final impact on consumption in the economy owing to lost income to workers.
