

Freight
The Canadian transportation network faced significant challenges in 2022 and had to adapt to the rapidly changing demand, geopolitical events, and disruptive weather events.
The first half of 2022 was characterized by a strong demand for consumer goods (notably sourced in Asia) driven by the change in household consumption patterns from services to goods during the COVID-19 pandemic. While all modes of transportation benefited from this demand boost, this also led to high levels of congestion particularly at West Coast ports, at inland railyards (Toronto, Montréal) and at warehouses (due to lack of space). The first half of the year was also marked by disruptive events on the network including the emergence of the Omicron variant which constrained labour capacity, the recovery from the November 2021 atmospheric river in British Columbia that destroyed key rail segments and highways in the province, and the Russian invasion of Ukraine in February 2022 which created uncertainty.
In the second half of the year, the Canadian transportation system recorded strong volumes for bulk commodities exports. Demand for grain transportation rebounded with the 2022-2023 crop year after the poor harvest the previous year. The global demand for Canadian potash and crude oil was also strong due to market opportunities emerging from the conflict in Ukraine. Transported volumes of auto ramped up over that period as parts availability increased. In contrast, demand for containerized import goods started to fade in the last quarter of 2022 amid softer economic conditions.
- Figure 1: Freight flow by mode chart
Freight flows by mode, monthly index
Image description: Freight flows by mode, monthly index
The line chart shows the Freight flows indicators by mode, for 2021. Freight flows indicators include the Port Container Throughput, Rail Shipments, Truck Border Crossings and Air Cargo Volume.
| Year | Port Container Throughput | Rail Shipments | Truck Border Crossings | Air Cargo Volume |
|---|---|---|---|---|
| Jan 2019 | 100.00 | 100.00 | 100.00 | 100.00 |
| Feb | 82.79 | 83.92 | 94.65 | 90.50 |
| Mar | 95.14 | 101.98 | 108.51 | 109.67 |
| Apr | 99.59 | 105.89 | 104.97 | 99.75 |
| May | 101.33 | 105.40 | 113.13 | 105.68 |
| Jun | 98.40 | 101.63 | 106.00 | 110.10 |
| Jul | 102.90 | 104.08 | 103.89 | 111.67 |
| Aug | 107.87 | 107.09 | 109.00 | 108.49 |
| Sep | 100.49 | 101.65 | 102.86 | 111.63 |
| Oct | 98.02 | 105.03 | 109.70 | 114.28 |
| Nov | 94.82 | 94.24 | 105.62 | 107.74 |
| Dec | 94.58 | 99.30 | 95.54 | 118.24 |
| Jan 2020 | 88.86 | 98.46 | 98.42 | 99.97 |
| Feb | 83.81 | 84.27 | 96.63 | 93.57 |
| Mar | 82.95 | 98.44 | 99.98 | 96.78 |
| Apr | 94.95 | 93.75 | 72.36 | 63.37 |
| May | 87.38 | 90.93 | 78.35 | 74.22 |
| Jun | 88.53 | 90.77 | 96.81 | 86.72 |
| Jul | 97.14 | 95.61 | 100.15 | 91.76 |
| Aug | 96.75 | 97.49 | 101.41 | 86.76 |
| Sep | 99.67 | 103.92 | 104.85 | 92.32 |
| Oct | 116.16 | 111.07 | 108.85 | 96.34 |
| Nov | 103.62 | 105.49 | 98.99 | 96.69 |
| Dec | 104.73 | 103.94 | 98.68 | 105.93 |
| Jan 2021 | 103.24 | 103.03 | 96.75 | 88.04 |
| Feb | 87.88 | 87.96 | 93.45 | 78.74 |
| Mar | 108.28 | 109.30 | 113.22 | 94.28 |
| Apr | 99.17 | 102.56 | 103.72 | 86.39 |
| May | 116.02 | 104.53 | 101.75 | 86.46 |
| Jun | 98.51 | 101.01 | 108.85 | 92.50 |
| Jul | 99.57 | 90.93 | 102.85 | 90.69 |
| Aug | 105.87 | 98.20 | 104.76 | 93.96 |
| Sep | 98.19 | 97.82 | 104.07 | 97.45 |
| Oct | 109.18 | 100.83 | 107.59 | 102.97 |
| Nov | 87.75 | 86.76 | 104.15 | 111.30 |
| Dec | 94.67 | 89.59 | 100.51 | 117.27 |
Sources: Statistics Canada, Transport Canada, Port authorities
Air transportation
Text description
|
|
All Airports |
Toronto (YYZ) |
Vancouver (YVR) |
Hamilton (YHM) |
|---|---|---|---|---|
|
2021 vs 2022 |
8.8% |
28.4% |
5.0% |
4.4% |
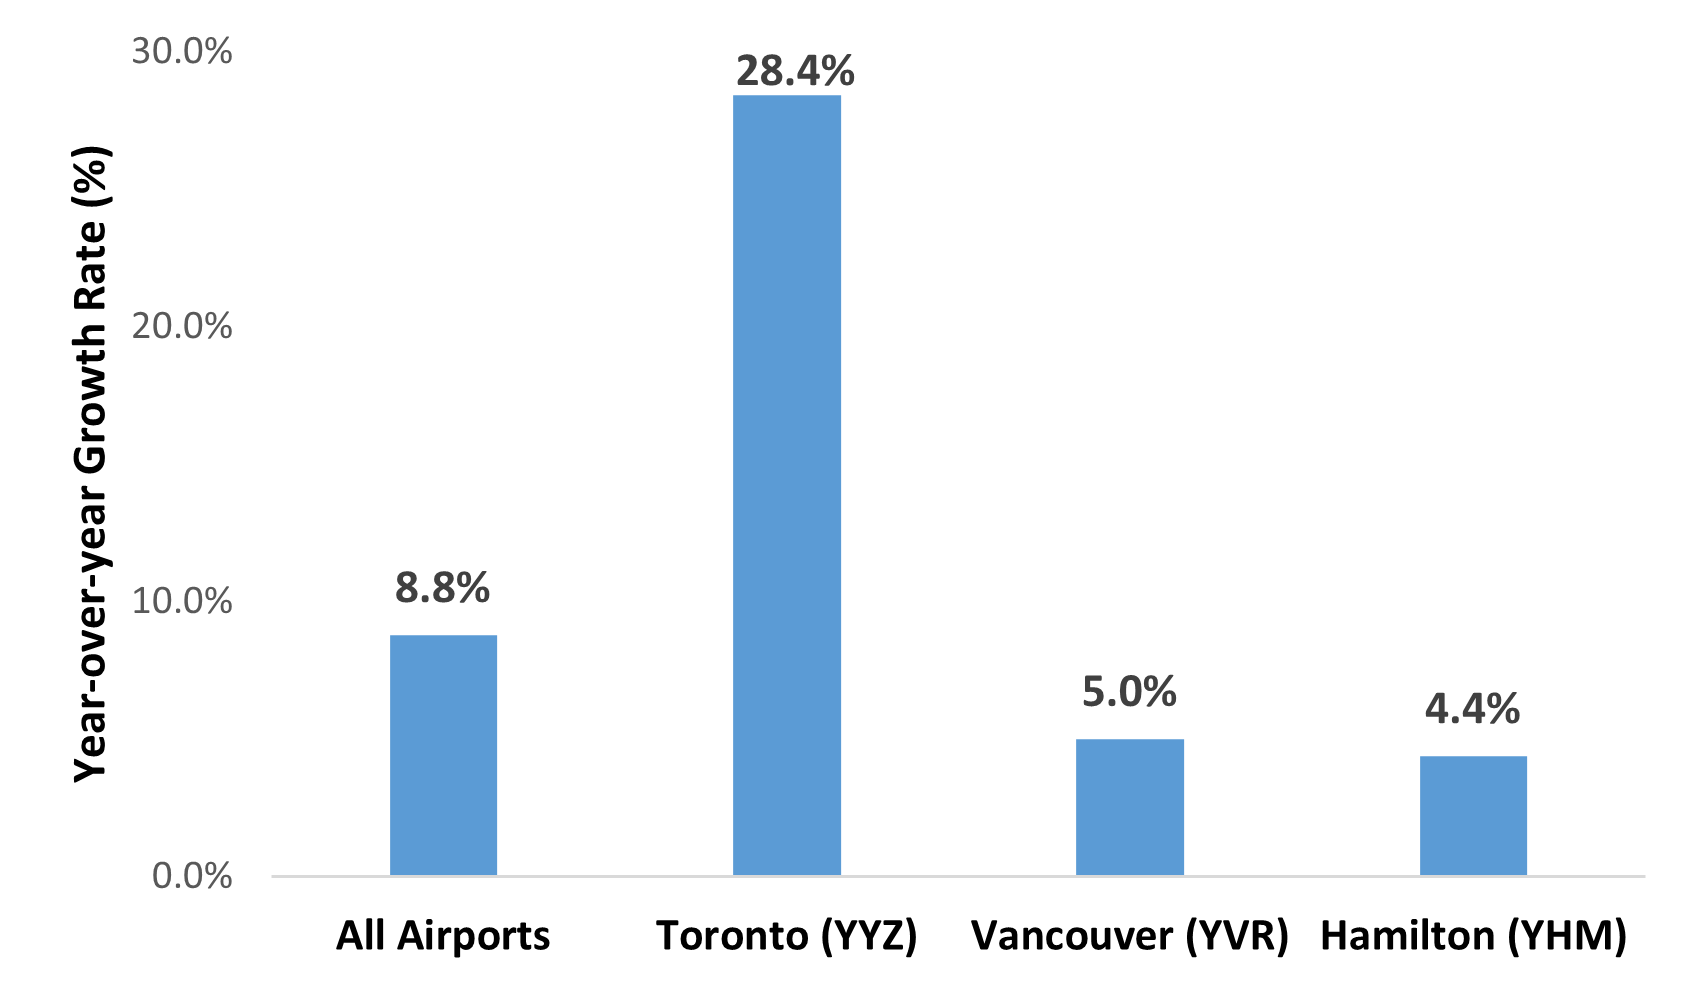
The emergence of e-commerce during the pandemic has been beneficial for air cargo transportation. In 2022, airports in Canada handled 1.5 million tonnes of cargo loaded and unloaded from domestic and foreign carriers, an 8.8% increase compared to 2021 volumes.
The 3 busiest airports for air cargo were Toronto Pearson International Airport (423.5 thousand tonnes in 2022, 28.4% more than in 2021), Vancouver International Airport (269.8 thousand tonnes in 2022, 5.0% more than in 2021) and Hamilton International Airport (163.1 thousand tonnes in 2022, 4.4% more than in 2021).
Marine transportation
Text description
|
|
Non Containerized (tonnes) |
Containerized (TEUs) |
|---|---|---|
|
Vancouver |
-2% |
-4% |
|
Prince Rupert |
-2% |
-1% |
|
Montréal |
9% |
0% |
|
Halifax |
6% |
1% |
Source: Vancouver Fraser Port Authority, Prince Port Authority, Montreal Port Authority, Halifax Port Authority
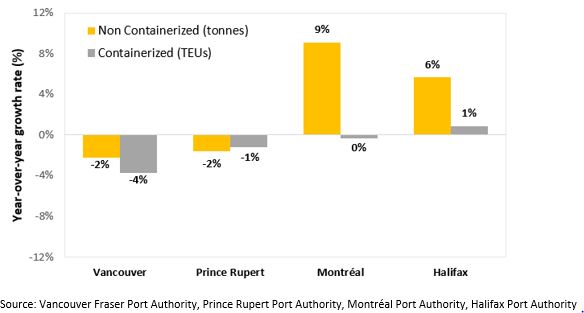
Containerized throughput (in twenty-foot equivalent units – TEU) decreased by 2.1% at the four largest Canadian container ports in 2022 compared to 2021.
On the West Coast, the demand for the return of empty containers to Asia has decreased significantly at the end of 2022, while loaded container exports volumes have not returned to pre-pandemic levels. These trends, combined with the impacts of the major floodings in British Columbia at the beginning of 2022 led to a 3.7% decrease of container throughput at the Port of Vancouver and a 1.2% decrease at the Port of Prince Rupert. On the East Coast, the Port of Montréal saw a slight decrease in container throughput (-0.3%). In contrast, container volume increased by 0.9% at the Port of Halifax. In 2022, the Port of Saint John handled over 100,000 TEUs notably due to investments in container terminal capacity which has attracted additional rail and marine services at the port.
Non-containerized throughput at the four largest Canadian Ports decreased by 0.5% in 2022 compared to 2021, with a large increase recorded at the Port of Montréal (+9%) and a slight decrease at the Port of Vancouver (-2%) mainly driven by dry bulk including grain (-23%) and forestry products (-7%).
Rail transportation
Text description
|
|
Total |
Intermodal |
Bulk |
|---|---|---|---|
|
Q1 |
-10% |
-10% |
-10% |
|
Q2 |
-1% |
0% |
-3% |
|
Q3 |
5% |
6% |
5% |
|
Q4 |
4% |
1% |
7% |
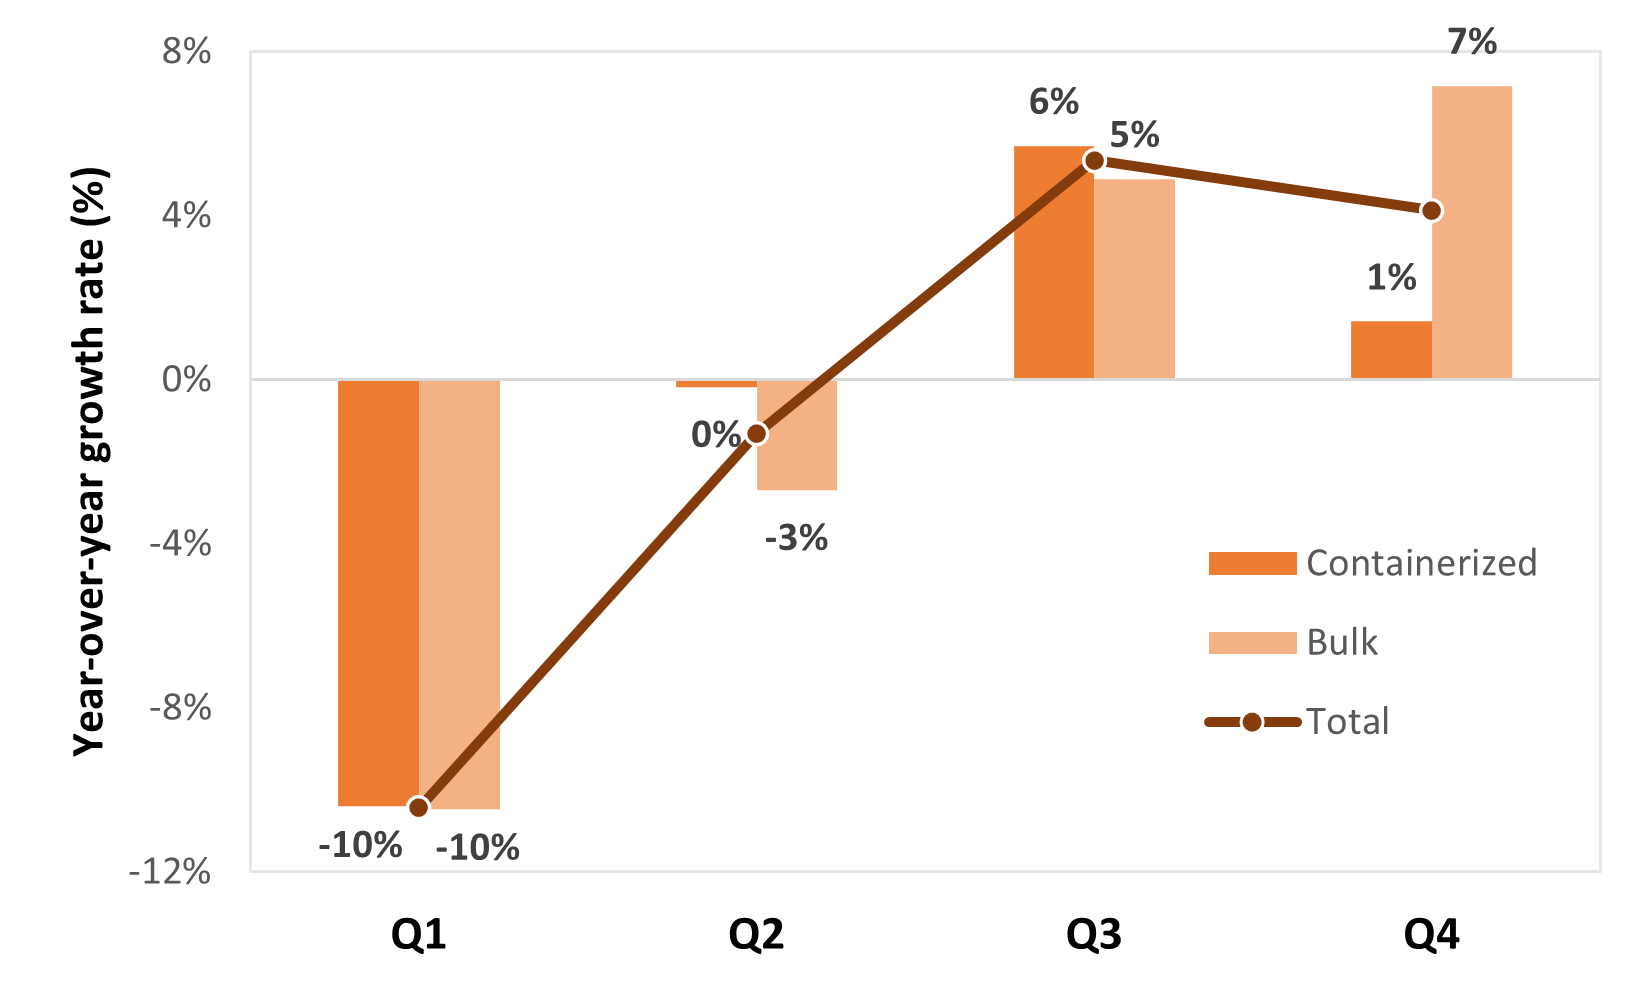
In 2022, system wide rail traffic of Class I railways remained slightly below 2021 levels (-0.7%).
Overall, bulk commodities slightly decreased in 2022 compared to 2021 (-0.5%), largely related to softer grain volumes in the first half of the year owing to a small crop size from the 2021-2022 crop-year. Rail traffic growth was recorded for bulk in the last two quarters, respectively 4.9% in Q3 and 7.2% in Q4, mainly driven by a strong demand for export bulk commodities such as the new crop of grain, auto and potash. Containerized rail traffic decreased by -0.9% in 2022 compared to 2021, as softer demand was reported at the end of 2022.
Rail shipments to and from Western Canada decreased by -2.3% in 2022 compared to 2021, amid impact of weather disruptive events and congestion issues in the first half of the year. On the other hand, Central and Eastern Canada saw increases in their overall rail shipments of respectively 2.9% and 0.8% in 2022 compared to 2021.
Road transportation
Text description
|
|
Western Canada |
Central Canada |
Total Quarterly Growth |
|---|---|---|---|
|
Q1 |
-4% |
-3% |
-3% |
|
Q2 |
0% |
3% |
2% |
|
Q3 |
-2% |
1% |
0% |
|
Q4 |
-11% |
-4% |
-5% |
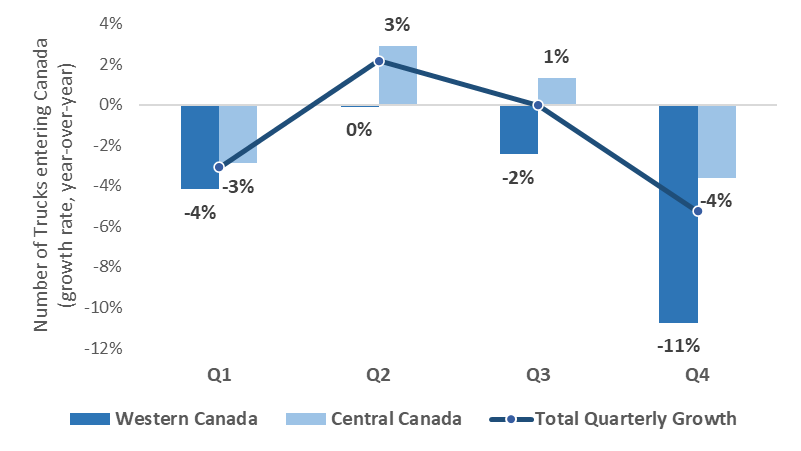
In 2022, truck border crossings decreased by 1.6% overall compared to 2021 and remains slightly below pre-pandemic levels (-2.5% compared to 2019). Truck border crossings were consistently below pre-pandemic levels throughout 2022 except for four months where traffic slightly exceeded 2019 levels. Trade by trucks to and from the U.S. is concentrated in Central Canada. Truck border crossings slightly declined by -0.6% in Central Canada, -4.3% in Western Canada, and -4.1% in Eastern Canada in 2022 compared to 2021.