
Transportation and warehousing is important to the Canadian economy. The traditional way of measuring gross domestic product (GDP) only includes economic activity linked directly to for-hire or commercial transportation. Transportation is key to activities not included in economic measures, like the value of personal travel and of own-account transportation activity (in other words, the shipper using a personal vehicle to move the goods). According to the Canadian Transportation Economic Account data from 2016, the transportation sector contributed $168.1 billion or 8% of GDP.
In 2016, household production of transportation services (in other words, the production of transportation services by the members of a household for their own consumption, such as driving a car to work) increased Canada’s GDP by $67.1 billion. Non-transportation industries (like manufacturing, wholesale trade and construction) produced $42.6 billion of own-account transportation services, or 30% of the total domestic supply of transportation.
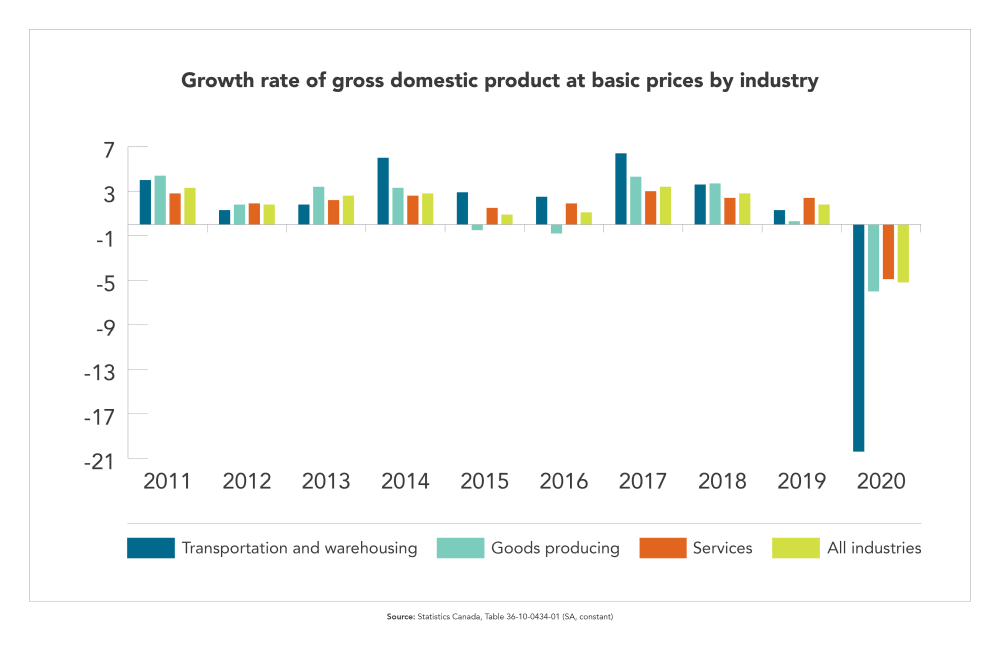
Image description: Growth rate of gross domestic product at basic prices by industry
The column chart shows the annual growth rate of gross domestic product at basic prices by industry, from 2011 to 2020.
| Industry | ||||
|---|---|---|---|---|
| Year | Transportation and warehousing | Goods | Services | Business |
| 2011 | 4.0% | 4.4% | 2.8% | 3.3% |
| 2012 | 1.3% | 1.8% | 1.9% | 1.8% |
| 2013 | 1.8% | 3.4% | 2.2% | 2.6% |
| 2014 | 6.0% | 3.3% | 2.6% | 2.8% |
| 2015 | 2.9% | -0.5% | 1.5% | 0.9% |
| 2016 | 2.5% | -0.8% | 1.9% | 1.1% |
| 2017 | 6.4% | 4.3% | 3.0% | 3.4% |
| 2018 | 3.6% | 3.7% | 2.4% | 2.8% |
| 2019 | 1.3% | 0.3% | 2.4% | 1.8% |
| 2020 | -20.4% | -6.0% | -4.9% | -5.2% |
Source: Statistics Canada, Table 36-10-0434-01
Using traditional measures of GDP, the sector made up 3.8% of GDP ($72 billion) in 2020. In the past year, the sector declined by 20.4%, falling at a much worse rate for all industries (-5.2%). However, the total annual growth rate of GDP in the transportation sector over the previous 5 years (3.4%) exceeded that of the entire economy (2.3%).
Although the transportation and warehouse industry accounts for only 3.8% of GDP, it supports activity in other industries. The manufacturing sector for example relies heavily on transportation services to bring input and deliver goods to markets. It is also the case for the wholesale and retail industries.
In 2020, total household spending on transportation (including insurance) amounted to $164.7 billion, second only to shelter in terms of major spending categories. Household consumption of transportation grew around 4.3% every year on average from 2015 to 2019, with overall spending growing at the same rate. Household spending for personal travel accounted for about 11% of the GDP.
In 2020, 950,200 employees (including self-employed people) worked in the transportation and warehousing sector, down 8.4% from 2019. Employment in the transportation and warehousing sector accounts for about 5% of total employment, a share that has stayed stable over the past 2 decades.
Labour shortages
The World Bank reported that skill shortages are a major threat for the transportation and warehousing sector. An aging workforce and retirement of baby boomers will likely add to labour shortages for certain occupations. Stakeholders have already raised these concerns and how it could negatively affect their ability to stay competitive.
The sector’s labour market is severely impacted by COVID-19; the unemployment rate jumped to 7.5% in 2020, compared to 3.2% in 2019 and a 10-year average of 4.1%. Although the sector’s unemployment rate compares favorably with the national average of 9.6%, that was not reflected in wage growth. While average weekly earnings in transportation and warehousing grew by 6.1% in 2020, they increased by 6.7% on average for all industries.
According to Employment and Social Development Canada, major gaps between labour demand and supply for some transportation occupations will develop in the next 10 years, especially for truck drivers. This is due to, among other things, older demographics of the industry. Truck drivers tend to be older than the national average, so a large number will retire in the next ten years.
According to the 2016 Census, 40% of the national labour force was between 45 and 64 years old, compared to 50% in the transportation sector. Workers under 25 made up 14% of all workers across all industries, although this share dropped to 7% in the transportation and warehousing sector.
Women are also significantly underrepresented in the transportation industry, with men making up more than 75% of the workforce. Immigrants, especially recent immigrants, and Indigenous people were also underrepresented in most jobs at risk of labour shortages including trucking, transit and air transportation.
The failure to fill jobs could negatively impact the transportation industry, but also Canadian industries that rely on the sector to access domestic and international markets.
Competitiveness
The World Economic Forum’s Global Competitiveness Index is a yearly indicator of a country’s performance, based on measures of productivity and economic growth. Transportation infrastructure is included in calculating the Index, and helps compare the quality of transportation infrastructure in Canada to other countries.
Overall, Canada ranked 14th in 2019 with a score of 79.6, close to the best performer’s score of 84.8, Singapore. Canada slipped 2 spots and lost 0.3 points compared to 2018. This is partly due to trade issues that have affected Canada’s ability to stay competitive.
In terms of transportation infrastructure, Canada ranked 32 and scored 65.7 (far below the 100 level, an ideal state where an index component ceases to be a constraint to productivity growth). This score highlights areas that need improvement, including the quality of roads, as well as the efficiency of train and seaport services. On the other hand, road connectivity (98.7) and airport connectivity (96.3) both scored very high with little room for improvement.
Productivity
Multifactor productivity measures how efficiently production inputs, like labour and capital, are being used in production. Statistics Canada monitors Canada’s multifactor productivity.
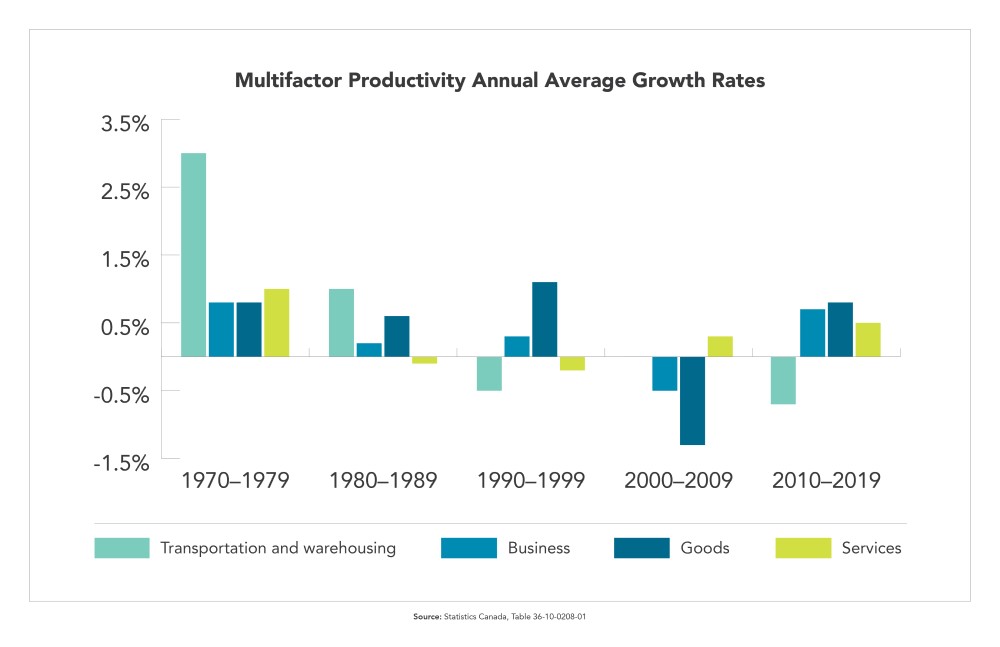
Image description: Multifactor productivity annual average growth rates
The column chart shows multifactor productivity annual average growth rates by industry, from 1970 to 2019. Multifactor productivity for the transportation and warehousing sector grew at an annual average of 3% from 1970 to 1979, way above the 0.8% growth rate for the business sector as a whole. The chart also shows that the annual average growth rate for the transportation and warehousing sector has been declining or plateauing since the 1990s.
| Industry | ||||
|---|---|---|---|---|
| Period | Transportation and warehousing | Business | Goods | Services |
| 1970-1979 | 3.0% | 0.8% | 0.8% | 1.0% |
| 1980-1989 | 1.0% | 0.2% | 0.6% | -0.1% |
| 1990-1999 | -0.5% | 0.3% | 1.1% | -0.2% |
| 2000-2009 | 0.0% | -0.5% | -1.3% | 0.3% |
| 2010-2019 | -0.7% | 0.7% | 0.8% | 0.5% |
Source: Statistics Canada, Table 36-10-0208-01
Recently, multifactor productivity in the transportation and warehousing sector has plateaued. Between 2010 and 2019, multifactor productivity decreased around 0.9% per year, compared to the 0.6% increase for the business sector as a whole.
In contrast, labour productivity in transportation and warehousing increased over the same period, at an annual rate of 1.1%. That is slightly slower compared with the overall business sector (1.2%). Labour productivity for some transportation and warehousing sub-sectors, like air and rail transportation, outperformed the business sector with average annual growth rates of 3.0% and 2.9%.