Financial Statements Highlights
The financial highlights presented within this DPR are intended to serve as a general overview of Transport Canada’s financial position and operations. The department’s financial statements can be found on Transport Canada's website.
| 2012-13 Planned Results (Restated)* | 2012-13 Actual | 2011-12
Actual (Reclassified)* |
$ Change (2012-13 Planned vs. Actual) | $ Change (2012-13 Actual vs. 2011-12 Actual) | |
|---|---|---|---|---|---|
| Total expenses | 2,252 | 1,609 | 1,552 | 644 | 57 |
| Total revenues | 84 | 88 | 88 | (4) | (1) |
| Net cost of operations before government funding and transfers | 2,169 | 1,521 | 1,467 | 647 | 54 |
| Departmental net financial position | 1,682 | 1,391 | 1,544 | 291 | (152) |
Note: Columns may not add up due to rounding.
* Please refer to the financial statements for further detail.
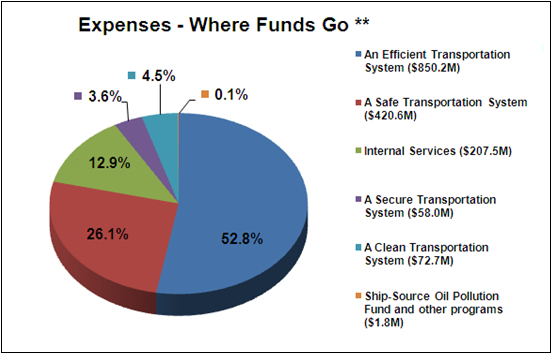
[Text version of graphic - Expenses - Where Funds Go**]
** Expenses – Where Funds Go represents the total amount paid. The total was reduced by expenses incurred on behalf of Government in the amount of $1.8M for net expenses of $1,609M paid by the Department.
Total expenses for Transport Canada were $1,611 million in 2012–2013. There was an increase of $56 million (3.6 percent) from the previous year’s expenses. The majority of funds, $1,271 million or 78.9 percent, were spent on transportation efficiency and safety, while other programs represented $340 million or 21.1 percent of total expenses.
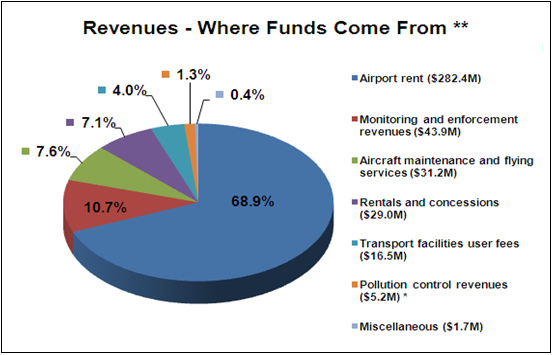
[Text version of graphic - Revenues - Where Funds Come From**]
* The Revenues from Pollution control are earmarked under legislation for specific expense purposes and are not available for Transport Canada spending.
** Revenues – Where Funds Come From represents the total amount received for respendable and non-respendable revenues.
The department’s total revenues amounted to $410 million for 2012–2013, of which $88 million was respendable. There was an increase of $8 million (2 percent) from the previous year’s revenue. Most of Transport Canada’s revenues were derived from airport rent, which was deposited directly into the Consolidated Revenue Fund.
.
| 2012-13 | 2011-12 | $ Change | |
|---|---|---|---|
| Total liabilities | 1,681 | 2,270 | (589) |
| Total net financial assets | 692 | 1,304 | (611) |
| Departmental net debt | 989 | 966 | 23 |
| Total non-financial assets | 2,380 | 2,509 | (129) |
| Departmental net financial position | 1,391 | 1,544 | (152) |
Note: Columns may not add up due to rounding.
[Text version of graphic - Revenues - Liabilities Type**]
Total liabilities were $1,681 million in 2012–13, a decrease of $589 million (25.9 percent) over the previous year’s total liabilities of $2,270 million. Accounts payable and lease obligations represent the largest portion of liabilities at $1,336 million or 79.5 percent of the total liabilities. The decrease is due to a reduction in accounts payable and accrued liabilities, where payables at year-end were lower mostly because of stricter accounting policies regarding claim payments to transfer payment recipients, and to a significant reduction of prior years’ accrued liabilities.
[Text version of graphic - Net Financial Assets by Type**]
Total net financial assets were $692 million at the end of 2012–13, a decrease of $611 million (46.9 percent) over the previous year’s total of $1,304 million. The amount due from the Consolidated Revenue Fund represents 90.5 percent of the total assets. The decrease in the amount due from the Consolidated Revenue Fund is related to the decrease of accounts payable and the decrease of prior years’ accrued liabilities.
Supplementary Information Tables
The supplementary information tables listed in the 2012-13 Departmental Performance Report are available in electronic format on Transport Canada’s website.
- Details on Transfer Payment Programs
- Greening Government Operations
- Horizontal Initiatives
- Internal Audits and Evaluations
- Response to Parliamentary Committees and External Audits
- Sources of Respendable and Non-Respendable Revenue
- Status Report on Major Crown/Transformational Projects
- Status Report on Projects Operating With Specific Treasury Board Approval
- User Fees Reporting
Tax Expenditures and Evaluation Report
The tax system can be used to achieve public policy objectives through the application of special measures such as low tax rates, exemptions, deductions, deferrals and credits. The Department of Finance publishes cost estimates and projections for these measures annually in the Tax Expenditures and Evaluations lxviii publication. The tax measures presented in the Tax Expenditures and Evaluations publication are the sole responsibility of the Minister of Finance.


