3.1 Financial Highlights
The financial highlights presented in this Departmental Performance Report are intended to serve as a general overview of Transport Canada's financial position and operations. The Department's financial statements can be found on Transport Canada's website. The presentation of the statements has been updated to reflect the new requirements in the Treasury Board Accounting Standards 1.2.
| Change % | 2011-12 | 2010-11 (Restated) | |
|---|---|---|---|
| Total liabilities | 11.2% | 2,269,691 | 2,040,786 |
| Total net financial assets | 15.3% | 1,303,861 | 1,130,988 |
| Departmental net debt | 6.2% | 965,830 | 909,798 |
| Total non-financial assets | -5.2% | 2,409,430 | 2,648,171 |
| Departmental net financial position | -11.2% | 1,543,600 | 1,738,373 |
| Change % | 2011-12 | 2010-11 (Restated) | |
|---|---|---|---|
| Total expenses | -0.3% | 1,555,154 | 1,560,290 |
| Total revenues | -2.4% | 88,399 | 90,569 |
| Net cost from continuing operations | -0.2% | 1,466,755 | 1,469,721 |
| Net cost of transferred operations | -66.1% | 3,997 | 11,788 |
| Net cost of operations before government funding and transfers | -0.7% | 1,470,752 | 1,481,509 |
| Government funding and transfers | -8.9% | 1,275,979 | 1,400,199 |
| Net cost of operations after government funding and transfers | 139.5% | 194,773 | 81,310 |
| Departmental net financial position - Beginning of year | -4.5% | 1,738,373 | 1,819,683 |
| Departmental net financial position - End of year | -11.2% | 1,543,600 | 1,738,373 |
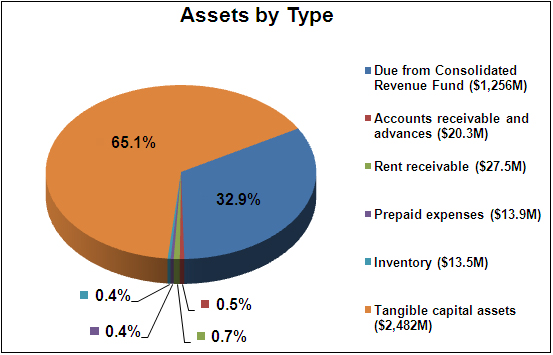
[Text version of graphic - Assets by Type]
Total assets were $3,813 million at the end of 2011-12, an increase of $34 million (0.9 percent) over the previous year's total assets of $3,779 million. Tangible capital assets represented the largest portion of total assets at $2,482 million or 65.1 percent of total assets.
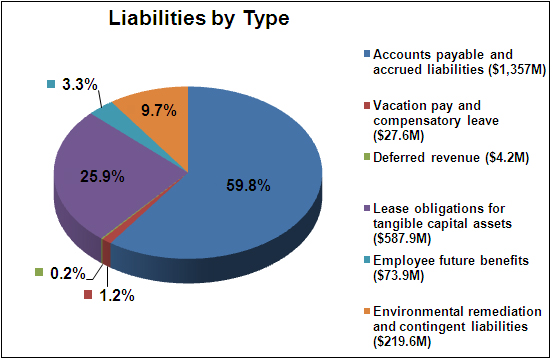
[Text version of graphic - Liabilities by Type]
Total liabilities were $2,270 million, an increase of $229 million (11.2 percent) over the previous year's total liabilities of $2,041 million. Accounts payable represents the largest portion of liabilities at $1,357 million or 59.8 percent of total liabilities.
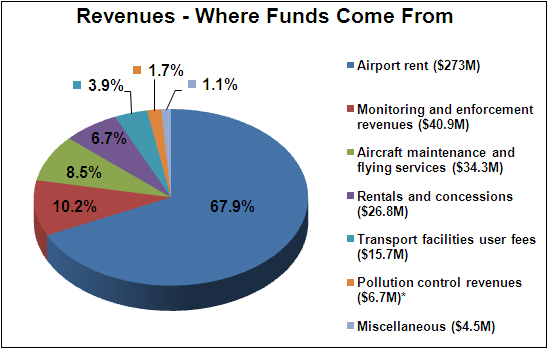
* The Revenues from Pollution control are earmarked under legislation for specific expense purposes and are not available for Transport Canada spending.
[Text version of graphic - Revenues - Where Funds Come From]
The Department's total revenues amounted to $402 million for 2011-12. There was an increase of $15 million (4 percent) from the previous year's revenue. Most of Transport Canada's revenues were derived from airport rent, which was deposited directly into the Consolidated Revenue Fund.
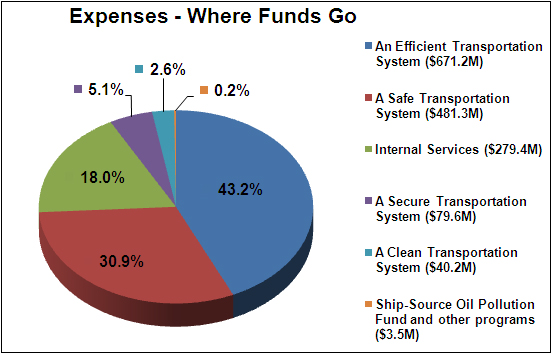
[Text version of graphic - Expenses - Where Funds Go]
Total expenses for Transport Canada were $1,555 million in 2011-12. There was a decrease of $5 million (0.3 percent) from the previous year's expenses. The majority of funds, $1,153 million or 74.1 percent, were spent on transportation efficiency and safety while other programs represented $403 million or 25.9 percent of total expenses.
3.2 Supplementary Information Tables
The supplementary information tables listed in the 2011-12 Departmental Performance Report are available in electronic format on Transport Canada's website.


