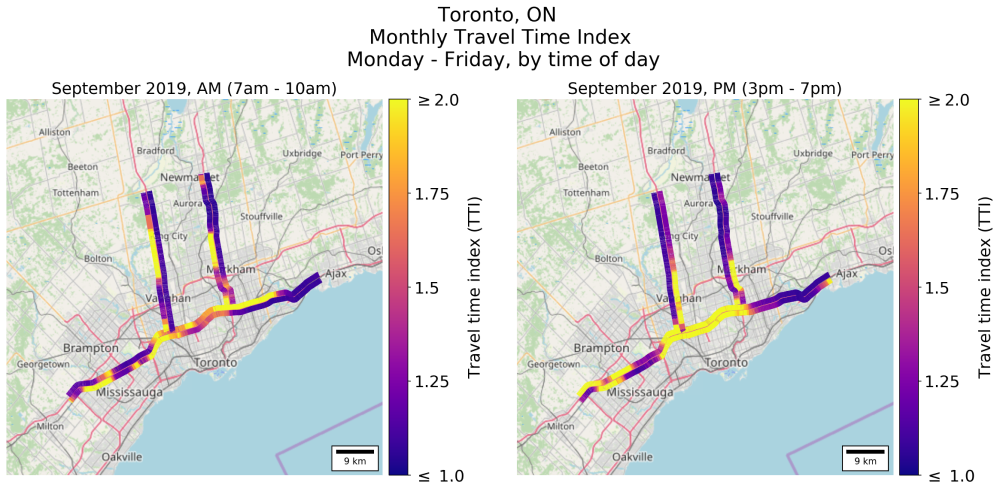
Since the beginning of the COVID-19 stay-at-home measures in March 2020, traffic in urban areas across the country was significantly reduced. In 2021, road traffic congestion levels increased week-over-week in most major urban areas until September and remained stagnant afterwards. At the end of 2021, congestion returned to 2019 levels in Vancouver and Montreal, but remained lower than the 2019 levels in Vancouver, Calgary, and Halifax. As of April 2022, in most major urban areas, road traffic congestion is greater than congestion measured one year ago and has returned to pre-pandemic levels.
Calgary (Alberta)
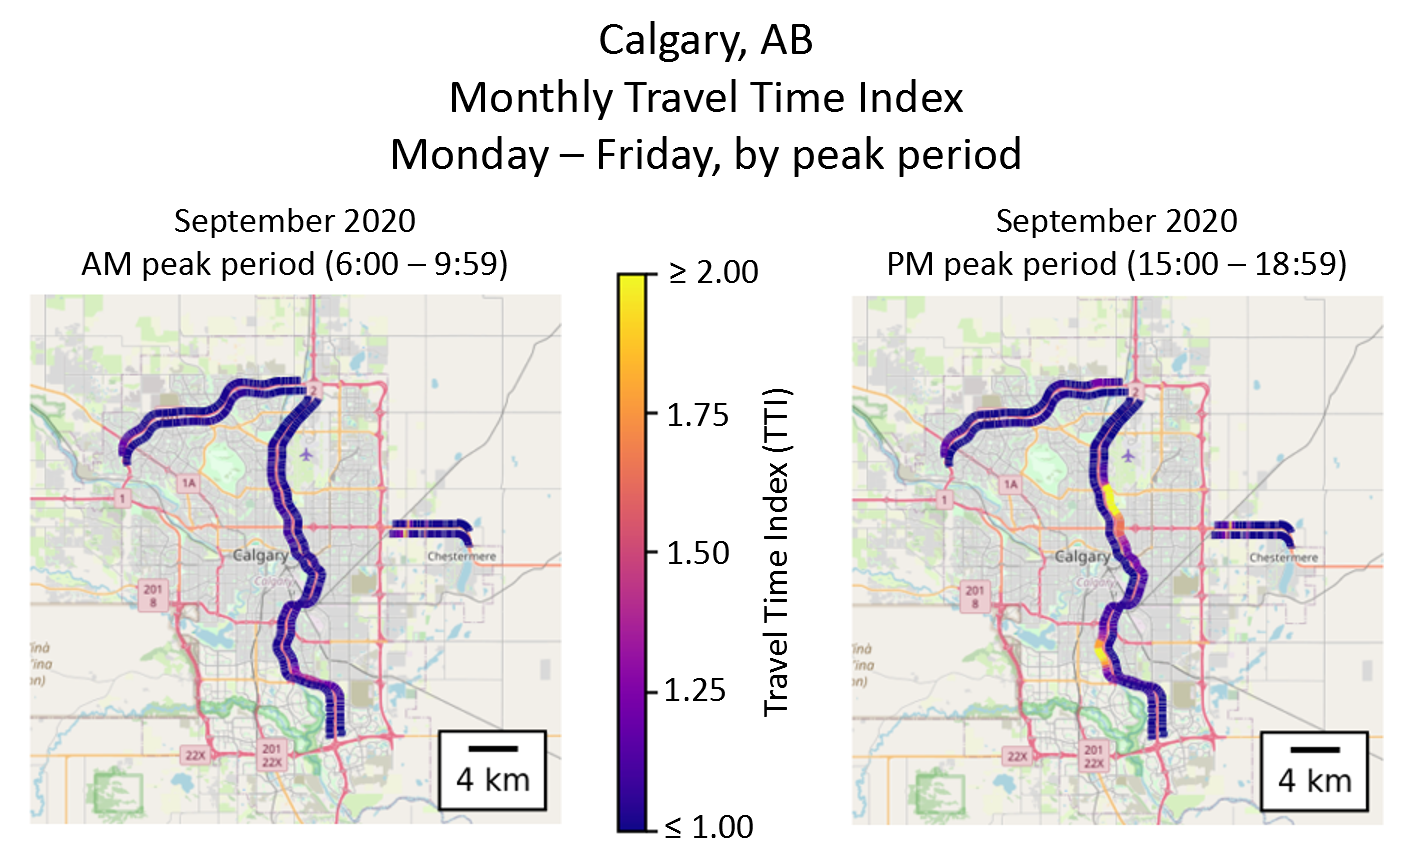
Map 2020: Monthly Travel Time Index for Calgary (Alberta), Monday-Friday by Peak Period
Map description: Urban mobility Calgary 2020
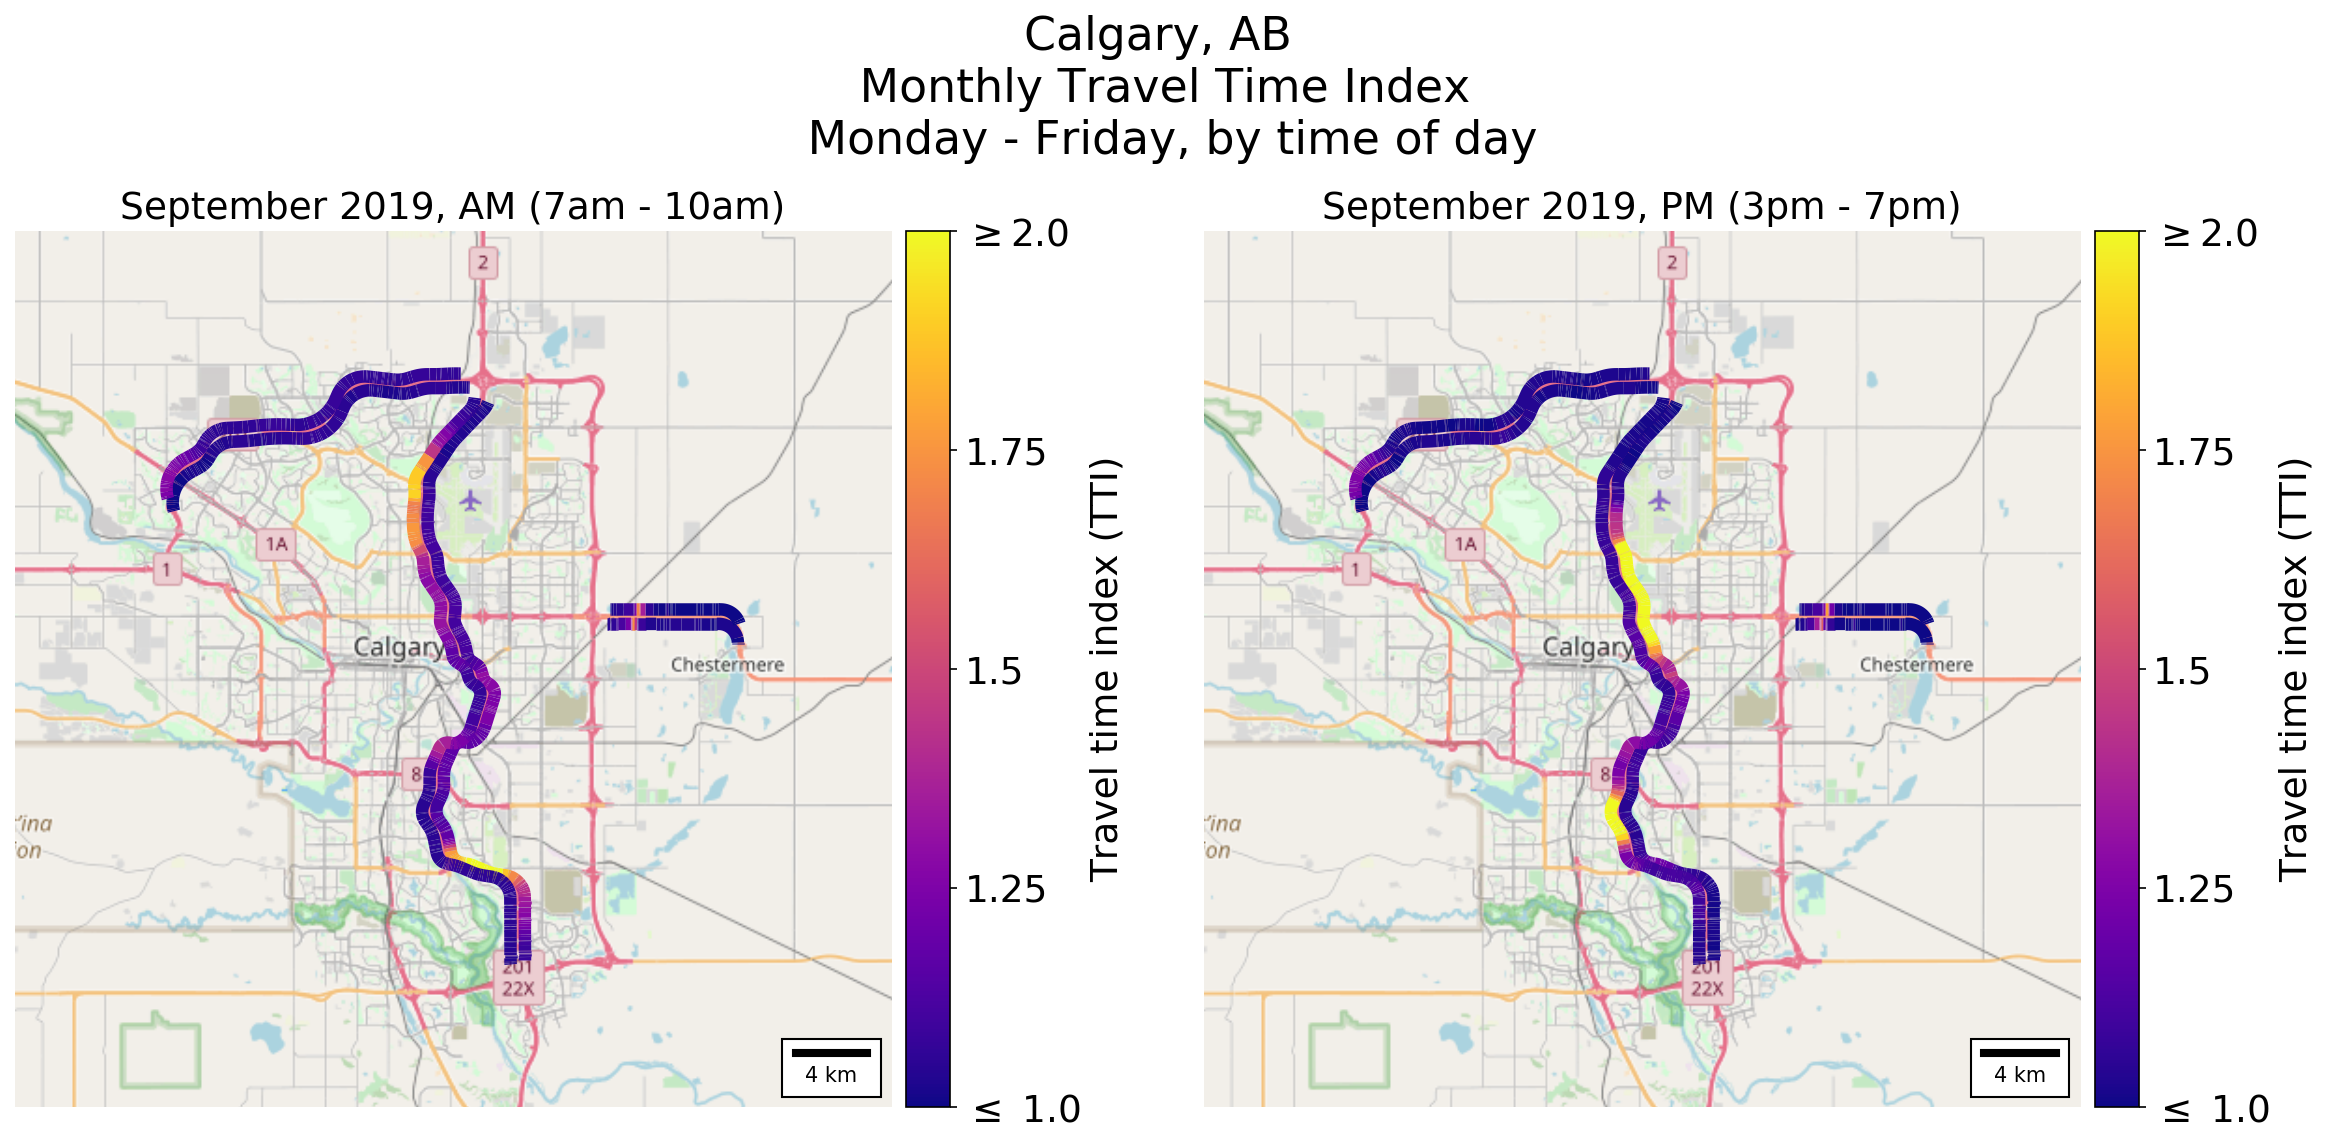
The figure shows two maps of Calgary side-by-side with travel time index for September 2020. Travel time index is ratio of peak period travel time to free-flow travel time, so an index of 1 means traffic is flowing freely, and an index of 2 means traffic is moving at half the free-flow speed. The left panel corresponds to the morning peak period (6:00-9:59) and the right panel corresponds to the afternoon peak period (15:00-18:59). On each map, the travel time index along the major corridors is indicated by colour. Brighter colour means higher travel time index, or more congestion. The map shows the location of congestion bottlenecks and how long and severe they are.
Map 2021: Monthly Travel Time Index for Calgary (Alberta), Monday-Friday by Peak Period
Map description: Urban mobility Calgary 2021
The figure shows two maps of Calgary side-by-side with travel time index for September 2021. Travel time index is ratio of peak period travel time to free-flow travel time, so an index of 1 means traffic is flowing freely, and an index of 2 means traffic is moving at half the free-flow speed. The left panel corresponds to the morning peak period (6:00-9:59) and the right panel corresponds to the afternoon peak period (15:00-18:59). On each map, the travel time index along the major corridors is indicated by colour. Brighter colour means higher travel time index, or more congestion. The map shows the location of congestion bottlenecks and how long and severe they are.
Montréal (Québec)
Map 2020: Monthly Travel Time Index for Montréal (Québec), Monday-Friday by Peak Period
Map description: Urban mobility Montréal 2020
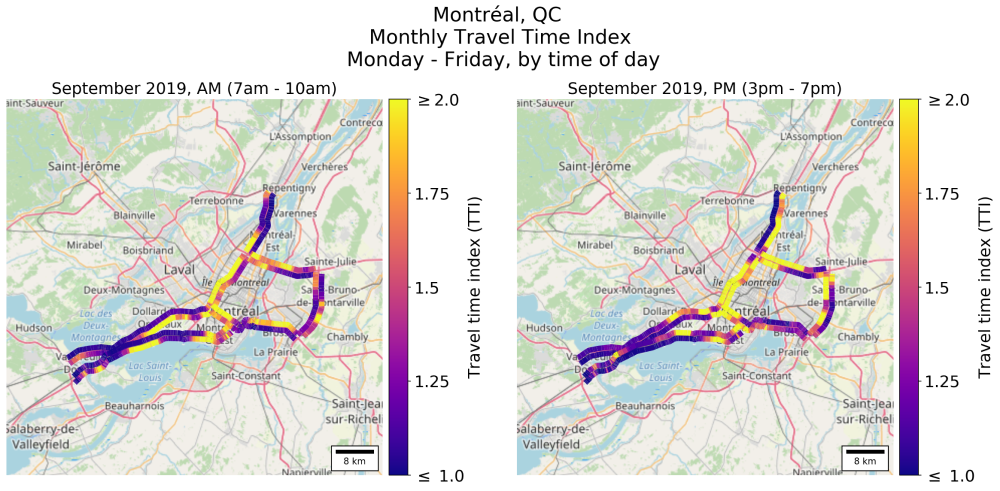
The figure shows two maps of Montréal side-by-side with travel time index for September 2020. Travel time index is ratio of peak period travel time to free-flow travel time, so an index of 1 means traffic is flowing freely, and an index of 2 means traffic is moving at half the free-flow speed. The left panel corresponds to the morning peak period (6:00-9:59) and the right panel corresponds to the afternoon peak period (15:00-18:59). On each map, the travel time index along the major corridors is indicated by colour. Brighter colour means higher travel time index, or more congestion. The map shows the location of congestion bottlenecks and how long and severe they are.
Map 2021: Monthly Travel Time Index for Montréal (Québec), Monday-Friday by Peak Period
Map description: Urban mobility Montréal 2021
The figure shows two maps of Montréal side-by-side with travel time index for September 2021. Travel time index is ratio of peak period travel time to free-flow travel time, so an index of 1 means traffic is flowing freely, and an index of 2 means traffic is moving at half the free-flow speed. The left panel corresponds to the morning peak period (6:00-9:59) and the right panel corresponds to the afternoon peak period (15:00-18:59). On each map, the travel time index along the major corridors is indicated by colour. Brighter colour means higher travel time index, or more congestion. The map shows the location of congestion bottlenecks and how long and severe they are.
Toronto (Ontario)
Map 2020: Monthly Travel Time Index for Toronto (Ontario), Monday-Friday by Peak Period
Map description: Urban mobility Toronto 2020
The figure shows two maps of Toronto side-by-side with travel time index for September 2020. Travel time index is a ratio of peak period travel time to free-flow travel time. An index of 1 means traffic is flowing freely, and an index of 2 means traffic is moving at half the free-flow speed. The left panel corresponds to the morning peak period (6:00-9:59) and the right panel corresponds to the afternoon peak period (15:00-18:59). On each map, the travel time index along the major corridors is indicated by colour. Brighter colour means higher travel time index, or more congestion. The map shows the location of congestion bottlenecks and how long and severe they are.
Map 2021: Monthly Travel Time Index for Toronto (Ontario), Monday-Friday by Peak Period
Map description: Urban mobility Toronto 2021
The figure shows two maps of Toronto side-by-side with travel time index for September 2021. Travel time index is a ratio of peak period travel time to free-flow travel time. An index of 1 means traffic is flowing freely, and an index of 2 means traffic is moving at half the free-flow speed. The left panel corresponds to the morning peak period (6:00-9:59) and the right panel corresponds to the afternoon peak period (15:00-18:59). On each map, the travel time index along the major corridors is indicated by colour. Brighter colour means higher travel time index, or more congestion. The map shows the location of congestion bottlenecks and how long and severe they are.
Vancouver (British Columbia)
Map 2020: Monthly Travel Time Index for Vancouver (British Columbia), Monday-Friday by Peak Period
Map description: Urban mobility Vancouver 2020
The figure shows two maps of Vancouver side-by-side with travel time index for September 2020. Travel time index is ratio of peak period travel time to free-flow travel time, so an index of 1 means traffic is flowing freely, and an index of 2 means traffic is moving at half the free-flow speed. The left panel corresponds to the morning peak period (6:00-9:59) and the right panel corresponds to the afternoon peak period (15:00-18:59). On each map, the travel time index along the major corridors is indicated by colour. Brighter colour means higher travel time index, or more congestion. The map shows the location of congestion bottlenecks and how long and severe they are.
Map 2021: Monthly Travel Time Index for Vancouver (British Columbia), Monday-Friday by Peak Period
Map description: Urban mobility Vancouver 2021
The figure shows two maps of Vancouver side-by-side with travel time index for September 2021. Travel time index is ratio of peak period travel time to free-flow travel time, so an index of 1 means traffic is flowing freely, and an index of 2 means traffic is moving at half the free-flow speed. The left panel corresponds to the morning peak period (6:00-9:59) and the right panel corresponds to the afternoon peak period (15:00-18:59). On each map, the travel time index along the major corridors is indicated by colour. Brighter colour means higher travel time index, or more congestion. The map shows the location of congestion bottlenecks and how long and severe they are.
