
Port volumes and performance
Despite a global pandemic, ensuing recession and a ramp up in demand, the total cargo volumes handled at the 17 Canada Port Authorities decreased by 0.5% in 2020, from 348.1 million tonnes in 2019 to 346.3 million tonnes in 2020 (see chart 4 below and Map 6 in the Annex).
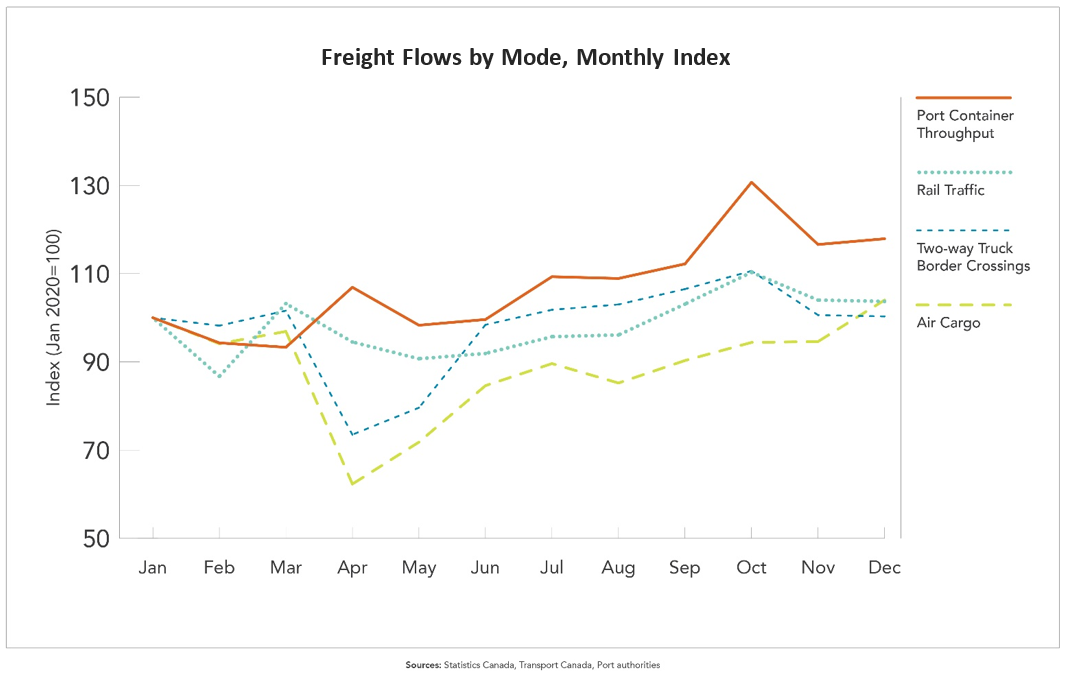
Image description - Freight flows by mode, monthly index
The line chart shows the Freight flows indicators by mode, for 2020. Freight flows indicators include the Port Container Throughput, Rail Traffic, Two-way Truck Border Crossings and Air Cargo.
| Month | Port Container Throughput | Rail Traffic | Two-way Truck Border Crossings | Air Cargo |
|---|---|---|---|---|
| Jan | 100.0 | 100.0 | 100.0 | 100.0 |
| Feb |
94.3 |
86.7 | 98.2 | 94.1 |
| Mar | 93.3 | 103.2 | 101.6 | 96.9 |
| Apr | 106.9 | 94.5 | 73.5 | 62.3 |
| May | 98.3 | 90.7 | 79.6 | 71.8 |
| Jun | 99.6 | 91.9 | 98.4 | 84.6 |
| Jul | 109.3 | 95.7 | 101.8 | 89.6 |
| Aug | 108.9 | 96.1 | 103.0 | 85.2 |
| Sep | 112.2 | 103.1 | 106.5 | 90.3 |
| Oct | 130.7 | 110.3 | 110.6 | 94.4 |
| Nov | 116.6 | 104.0 | 100.6 | 94.6 |
| Dec | 117.9 | 103.7 | 100.3 | 104.0 |
Sources: Statistics Canada, Transport Canada, Port authorities
In Western Canada, the Port of Vancouver, Canada’s busiest port, handled 0.9% more tonnes of freight in 2020 (145.5 million tonnes). In the first quarter of 2020, container and bulk volumes handled saw a large drop due to the railway blockades, the economic slowdown in Asian countries as measures were implemented to control the spread of COVID-19 as well as the decline in North American demand for consumer goods. Following the initial decline, higher volumes than usual in the fall and winter allowed for a complete recovery led by large rises in grain products, potash and fertilizers as well as petroleum products.
The Port of Prince Rupert, which experienced similar challenges in the beginning of the year as the Port of Vancouver, recovered more sizably and handled 9% more tonnes of freight in 2020 (32.4 million tonnes), with significant increases of coal, wood products and grain. Demand for coal to generate energy in Asia gave rise to mine developments in western Canada and increased rail flows to Prince Rupert, which saw its thermal coal shipments increase 67% in 2020.
In Central Canada, the Port of Montreal handled 13.5% less tonnes in 2020 (35.1 million tonnes). This significant annual decline can be explained by different events and factors. In the beginning of the year, the rail blockades as well as the drop in global consumption and production due to COVID impacted negatively cargo volumes handled at the port. In the summer, as the economy started recovering, the strike at the Port of Montreal hit and let to further declines.
In the St. Lawrence Seaway, both the amount of cargo and the number of vessel transit decreased in 2020, by 1.7% and 6.8% respectively, which followed declines in 2019. The drop in total cargo was led by large decreases of liquid and dry bulk as well as iron ore.

Image description - Cargo handled by Canadian Port Authorities, 2020 volumes and growth rates
The bubble chart shows cargo volume (bubble size) handled at major Canadian Port Authorities and 2020 growth rates (vertical axis). Vancouver-Fraser handled the most volume in 2020 (145.5 million tonnes).
| Canadian Port Authorities | Growth rate | Volume |
|---|---|---|
| Vancouver-Fraser | 0.9% | 145.5 |
| Montréal | -13.5% | 35.1 |
| Sept-Iles | 12.8% | 33.1 |
| Prince Rupert | 8.6% | 32.4 |
| Québec | -6.8% | 27.0 |
| Saint John | 2.4% | 26.0 |
| Hamilton-Oshawa | 2.5% | 10.9 |
| Thunder Bay | 9.7% | 10.2 |
| Halifax | -4.0% | 8.3 |
| Others | -16.0% | 17.9 |
Source: Tansport Canada, Canadian Port Authorities
Note: Volume is expressed in millions of tonnes
In Eastern Canada, a decrease of 4% in tonnes handled was recorded in 2020 at the Port of Halifax (8.3 million tonnes). The decline was mostly driven by containerized cargo exports as well as non-containerized imports. Volumes were soft in the first half of the year with large year-over-year declines because of softer economic conditions and railway blockades but were higher than usual in the last quarter of the year, which allowed for a partial recovery.
Rail traffic and performance
In 2020, railways moved a total of 324.7 million tonnes, a 1.7% decrease from 2019 (see rail flows in Canada at Map 6 in the Annex).Footnote 1 Rail traffic was impacted early in the year by the blockades and the COVID-19 pandemic but volumes recovered over the summer and the fall and allowed for a partial recovery.
The overall yearly decline in rail traffic was led by large decreases in shipments of specific commodities.
- The decline in shipments of motor vehicles and equipment (-22.0%) is attributable to the decline in consumption at the beginning of the year as well as public health measures and travel restrictions which reduced the need for personal vehicles
- For petroleum products and crude oil, large drops (-11.9% and -44.7%, respectively) are mostly due to the imposition of restrictions on air travel, the closure of the US-Canada border to non-essential travel as well as the shift from commuting to telework
- Shipments of coal fell (-7.5%) as a result of the long-term trend of phasing out coal fired power plants in Canada. Additionally, exports of coal suffered from the impact of the pandemic. Finally, the closure of the Neptune terminal at the port of Vancouver also led to a decrease of coal shipments
- Production and exports of forest products both increased which indicate that the decline in rail shipments of forest products (-5.7%) would likely be explained by a mode shift from rail to trucking
Shipments of containerized goods made a strong recovery from the initial decline, with consumers substituting from services to goods after the initial shock experienced in March and April, and ended the year slightly above 2019 levels (+0.4%).
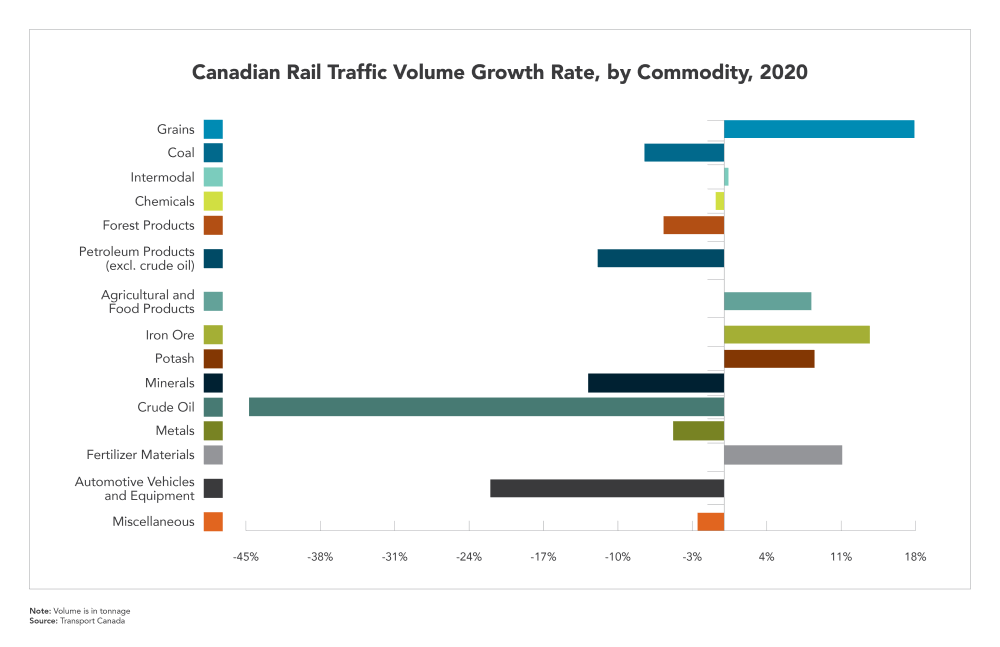
Image description: Canadian Rail Traffic Volume Growth Rate, by Commodity, 2020
The bar chart shows Canadian rail total traffic volume growth rate, by commodity, for the year 2020 for various products. Total traffic includes export, import, domestic and transhipments. In total, there was a 1.7% decrease in rail traffic volume for 2020.
| Commodity | Growth rate |
|---|---|
| Miscellaneous | -2.5% |
| Fertilizer Materials | 11.1% |
| Automotive | -22.0% |
| Metals | -4.8% |
| Crude Oil | -44.7% |
| Iron Ore | 13.7% |
| Minerals | -12.8% |
| Potash | 8.5% |
| Agri-Food Products | 8.2% |
| Chemicals | -0.8% |
| Forest Products | -5.7% |
| Other Petroleum Products | -11.9% |
| Grains | 17.9% |
| Intermodal | 0.4% |
| Coal | -7.5% |
Source: Transport Canada
Specific sectors (like grain, potash) were able to operate well throughout the different limitations this year brought, and took advantage of the improved utilization of assets and supply chain performance. Rail shipments of grain, fertilizers and potash were significantly higher than in 2019 (+17.9%, +11.1% and +8.5%, respectively). This large increase of grain movements can be attributed to a large Canadian harvest as well as lower harvests in competitor markets. Potash shipments benefited from contract settlements with China and efforts to make up for reduced applications in previous years.
Regional differences were observed. Total rail shipments in Western Canada were 1.4% lower than in 2019, supported by the strong recovery in import containers and export bulk, while they were 4% lower in Eastern Canada owing to the large drop in domestic manufacturing due to COVID-19 and blockades on the rail network.
Container supply chain performance
Despite the global pandemic, total container traffic handled at West coast ports remained steady compared to 2019. The Port of Vancouver recorded an increase in total container volumes (+2.0%), while volumes at the Port of Prince Rupert decreased by 5.7%.
Due to an increase in demand for consumer goods in North America, inbound container volumes rebounded in the spring which lead to an imbalance of inbound and outbound containers. In a period of high demand for containers, this led to challenges getting empty containers to be stuffed with export cargo such as forest products and grains. Moreover, the surge of inbound containers at the end of 2020 was much higher than usual which impacted the fluidity of the supply chain.
Transit time to ship a container from Shanghai to Toronto via West Coast portsFootnote 2 in the first half of 2020 was slightly above the three-year average benchmark, averaging 27.3 days. However, transit time reached 32.0 days in the second half of the year, 6.5 days above the three year average, as the transportation system was impacted by the ramp up in demand for consumer goods, higher than normal container throughput at Western Canada ports, and poor performance of ocean container carriers. Despite the volatile year, transit time for Western Canada ports remained competitive throughout the year compared to other U.S. ports, like Los Angeles/Long Beach and Seattle/Tacoma.
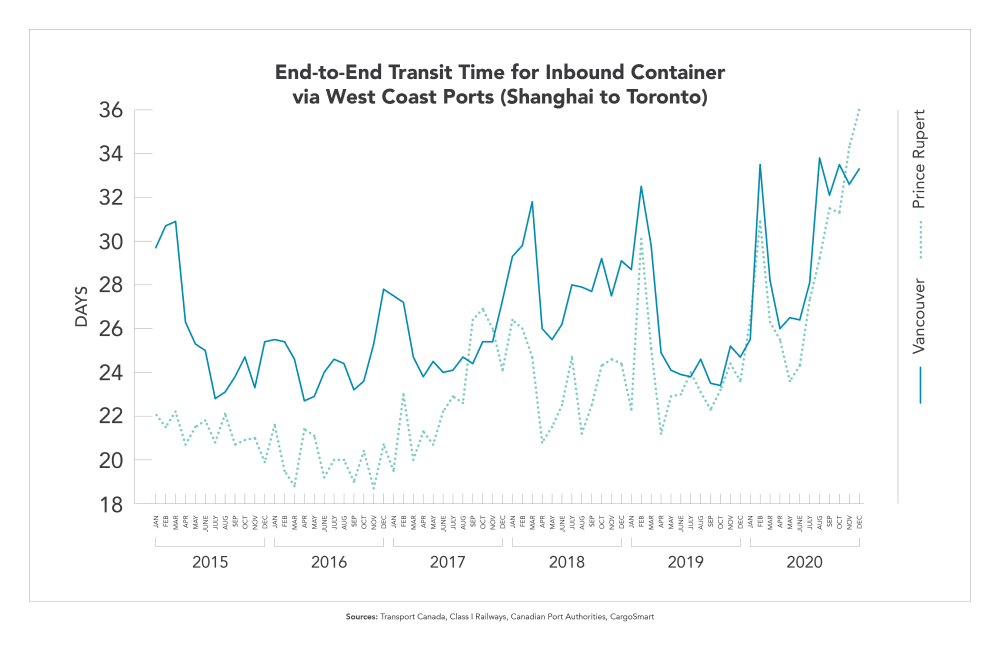
Image description - End-to-End Transit Time for Inbound Container via West Coast Ports (Shanghai to Toronto)
The line chart shows the end-to-end transit time of inbound containers from Shanghai to Toronto via two West Coast Ports (port of Vancouver and port of Prince Rupert) from 2015 to 2020. End-to-end transit time measures include the marine, port dwell and rail portions of the journey.
| Year | Month | Vancouver | Prince Rupert |
|---|---|---|---|
| 2015 | Jan | 29.2 | 22.1 |
| Feb | 30.9 | 22.3 | |
| Mar | 31.4 | 23.6 | |
| Apr | 26.7 | 21.1 | |
| May | 25.6 | 21.6 | |
| Jun | 25.6 | 21.9 | |
| Jul | 23.4 | 21.5 | |
| Aug | 23.7 | 23.0 | |
| Sep | 24.4 | 21.6 | |
| Oct | 25.1 | 21.8 | |
| Nov | 23.7 | 21.8 | |
| Dec | 25.7 | 20.7 | |
| 2016 | Jan | 26.0 | 22.6 |
| Feb | 25.8 | 20.4 | |
| Mar | 25.2 | 20.1 | |
| Apr | 23.2 | 22.2 | |
| May | 23.5 | 21.7 | |
| Jun | 24.7 | 20.0 | |
| Jul | 24.9 | 20.7 | |
| Aug | 25.1 | 20.7 | |
| Sep | 23.7 | 19.8 | |
| Oct | 23.9 | 21.1 | |
| Nov | 25.3 | 19.4 | |
| Dec | 28.1 | 21.7 | |
| 2017 | Jan | 27.8 | 20.6 |
| Feb | 27.8 | 23.8 | |
| Mar | 25.3 | 21.1 | |
| Apr | 24.4 | 22.4 | |
| May | 25.1 | 21.5 | |
| Jun | 24.8 | 23.2 | |
| Jul | 24.6 | 23.5 | |
| Aug | 25.2 | 23.7 | |
| Sep | 25.1 | 27.0 | |
| Oct | 25.4 | 26.8 | |
| Nov | 25.3 | 25.6 | |
| Dec | 27.9 | 24.4 | |
| 2018 | Jan | 29.6 | 26.5 |
| Feb | 30.0 | 26.1 | |
| Mar | 31.8 | 24.6 | |
| Apr | 26.0 | 21.1 | |
| May | 26.1 | 21.3 | |
| Jun | 26.6 | 22.2 | |
| Jul | 27.4 | 24.0 | |
| Aug | 28.4 | 21.7 | |
| Sep | 28.3 | 22.6 | |
| Oct | 29.7 | 24.3 | |
| Nov | 28.7 | 25.2 | |
| Dec | 29.7 | 24.2 | |
| 2019 | Jan | 30.4 | 22.8 |
| Feb | 33.3 | 30.3 | |
| Mar | 30.3 | 25.7 | |
| Apr | 25.0 | 21.3 | |
| May | 24.3 | 23.2 | |
| Jun | 24.4 | 23.3 | |
| Jul | 24.7 | 24.0 | |
| Aug | 25.3 | 23.3 | |
| Sep | 24.4 | 22.7 | |
| Oct | 24.3 | 23.4 | |
| Nov | 26.3 | 25.3 | |
| Dec | 25.4 | 24.3 | |
| 2020 | Jan | ||
| Feb | |||
| Mar | |||
| Apr | |||
| May | |||
| Jun | |||
| Jul | |||
| Aug | |||
| Sep | |||
| Oct | |||
| Nov | |||
| Dec |
Sources: Transport Canada, Class I Railways, Canadian Port Authorities, CargoSmart
On Canada’s East coast, total container volumes decreased by 7.1% compared to 2019. This was led by declines at the Port of Halifax (-7.2%) and the Port of Montreal (-7.9%) which is likely attributable to the decline in economic activity due to the pandemic as well as the strike that paralyzed the Port of Montreal in August. On the other hand, total container volumes increased at the Port of Saint John -+14.9%), which benefited from some diverted vessels from the Port of Montreal during the strike.
The supply chain was relatively fluid over the first half of 2020 with end-to-end transit time of containers from Antwerp to Toronto through the ports of Montréal and Halifax at 18.9 days, only slightly above the three year average of 18.2 days. However, the strike at the port of Montreal caused significant fluidity challenges, with transit time reaching 23.1 days in the second half of the year, 5.5 days above the three year average.
Western grain supply chain performance
In Western Canada, crop supply (production and carry-forward) reached 85.7 million tonnes for the 2020-21 crop year. This is slightly higher than the supply in 2019-20 of 85.1 million tonnes. The current crop year recorded higher than expected yield (production increased by 3.6%) and smaller carry forward stocks (-20.7%) compared to 2019-20. Large crop supply continued to lead to significant seasonal demand on the transportation system going into the fall and winter months.
From August (start of the crop year) to December 2020, there were large increases in volumes of grain shipped from the prairies (+18%), as well as exports from Western ports (+36%) compared to the same period last year. Those increases are explained in part by earlier than usual harvest as well as strong global demand for Canadian agri-products. Rail carriers also had more capacity to move grain due to a reduction in shipping demand for other commodities.
At the beginning of the crop year, vessel anchoring on the west coast was low, indicating the supply chain was fluid on the West Coast. However, in November 2020, there was a spike in vessel anchoring at the Port of Vancouver and in the Gulf Islands with up to 87% of anchorages occupied, and over 30 grain vessels anchored. This aligned with a softening of cargo export arriving by rail at the port and an increase in vessel arrivals. Following this spike, occupancy came down to 53% in late December, and less than 20 grain vessels anchored.
Overall, the grain supply chain was relatively fluid through the beginning of the 2020-21 crop year (August to December) despite significantly higher volumes of grain moved across Western Canada over that period. End-to-end transit time to ship grain from Saskatchewan to Asia through the Port of Vancouver remained on par with the three-year average. From Saskatchewan to China, the average transit time was 40.1 days while it took 34.6 days to ship grain from Saskatchewan to Japan. Transit times peaked in December 2020, but remained lower than the three-year average for both China and Japan.
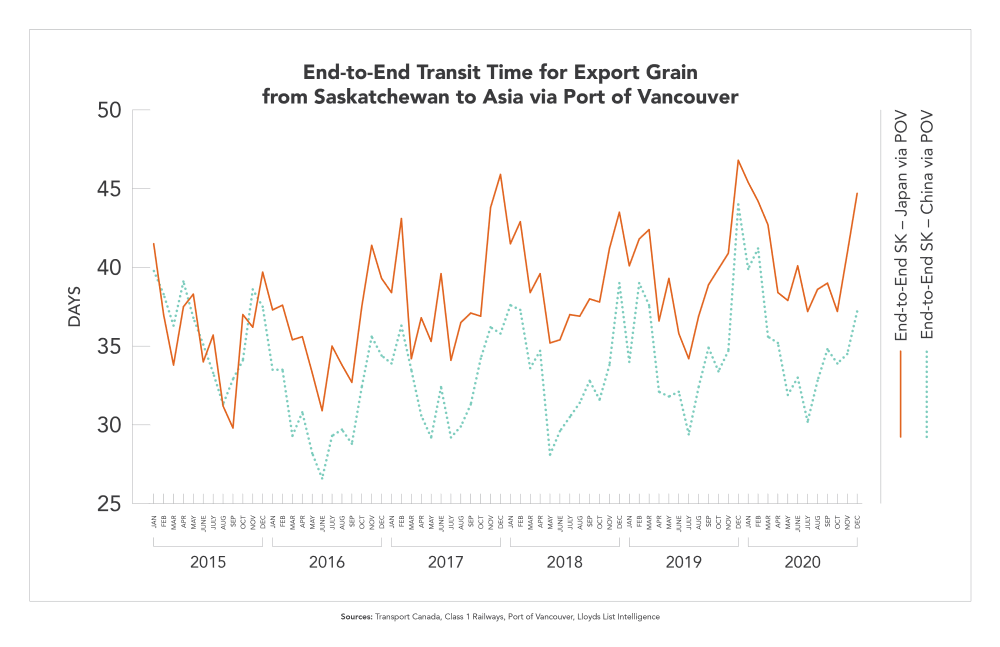
Image description: End-to-End Transit Time for Export Grain from Saskatchewan to Asia via Port of Vancouver
The line chart shows the end-to-end transit time for grain export from Saskatchewan to China and Japan via the Port of Vancouver from 2015 to 2020. End-to-end transit time measures include the marine, port dwell and rail portions of the journey.
| Year | Month | SK - China via POV | SK - Japan via POV |
|---|---|---|---|
| 2015 | Jan | 41.5 | 39.8 |
| Feb | 37.0 | 38.3 | |
| Mar | 33.8 | 36.3 | |
| Apr | 37.5 | 39.1 | |
| May | 38.3 | 36.8 | |
| Jun | 34.0 | 35.1 | |
| Jul | 35.7 | 33.3 | |
| Aug | 31.2 | 31.3 | |
| Sep | 29.8 | 32.9 | |
| Oct | 37.0 | 34.1 | |
| Nov | 36.2 | 38.6 | |
| Dec | 39.7 | 37.5 | |
| 2016 | Jan | 37.3 | 33.5 |
| Feb | 37.6 | 33.5 | |
| Mar | 35.4 | 29.3 | |
| Apr | 35.6 | 30.8 | |
| May | 33.3 | 28.2 | |
| Jun | 30.9 | 26.6 | |
| Jul | 35.0 | 29.3 | |
| Aug | 33.8 | 29.7 | |
| Sep | 32.7 | 28.8 | |
| Oct | 37.5 | 32.4 | |
| Nov | 41.4 | 35.6 | |
| Dec | 39.3 | 34.4 | |
| 2017 | Jan | 38.4 | 33.9 |
| Feb | 43.1 | 36.3 | |
| Mar | 34.2 | 33.5 | |
| Apr | 36.8 | 30.6 | |
| May | 35.3 | 29.2 | |
| Jun | 39.6 | 32.4 | |
| Jul | 34.1 | 29.2 | |
| Aug | 36.5 | 29.9 | |
| Sep | 37.1 | 31.3 | |
| Oct | 36.9 | 34.2 | |
| Nov | 43.8 | 36.2 | |
| Dec | 45.9 | 35.8 | |
| 2018 | Jan | 41.5 | 37.6 |
| Feb | 42.9 | 37.3 | |
| Mar | 38.4 | 33.6 | |
| Apr | 39.6 | 34.7 | |
| May | 35.2 | 28.1 | |
| Jun | 35.4 | 29.6 | |
| Jul | 37.0 | 30.5 | |
| Aug | 36.9 | 31.4 | |
| Sep | 38.0 | 32.8 | |
| Oct | 37.8 | 31.6 | |
| Nov | 41.2 | 33.8 | |
| Dec | 43.5 | 39.0 | |
| 2019 | Jan | 40.1 | 34.0 |
| Feb | 41.8 | 39.0 | |
| Mar | 42.4 | 37.6 | |
| Apr | 36.6 | 32.1 | |
| May | 39.3 | 31.8 | |
| Jun | 35.8 | 32.1 | |
| Jul | 34.2 | 29.4 | |
| Aug | 36.9 | 32.4 | |
| Sep | 38.9 | 34.9 | |
| Oct | 39.9 | 33.4 | |
| Nov | 40.9 | 34.7 | |
| Dec | 46.8 | 44.0 | |
| 2020 | Jan | 45.4 | 39.9 |
| Feb | 44.2 | 41.2 | |
| Mar | 42.7 | 35.6 | |
| Apr | 38.4 | 35.2 | |
| May | 37.9 | 31.9 | |
| Jun | 40.1 | 33.0 | |
| Jul | 37.2 | 30.2 | |
| Aug | 38.6 | 32.8 | |
| Sep | 39.0 | 34.8 | |
| Oct | 37.2 | 33.9 | |
| Nov | 40.9 | 34.5 | |
| Dec | 44.7 | 37.2 |
Sources: Transport Canada, Class 1 Railways, Port of Vancouver, Lloyds List Intelligence
Air cargo performance
In 2020, airports in Canada handled 1.18 million tonnes of cargo loaded and unloaded from domestic and foreign carriers, a 17.4% decrease from 2019.
The 3 busiest airports for air cargo were the Toronto Pearson International Airport (302.7 thousand tonnes or 35% less than in 2019), the Vancouver International Airport (230.1 thousand tonnes or 21.3% less than in 2019) and the Hamilton International Airport (123.4 thousand tonnes or 24.9% more than in 2019).
While the sector saw an overall decline in 2020, the import of certain goods witnessed unprecedented growth. Those which saw large increases related directly to the global pandemic, such as pharmaceuticals (including vaccines); which saw an increase of 4.9%; and textiles (including masks), which witnessed a staggering increase of 6604%.
Cross border traffic and performance
Truck traffic declined in 2020 (-7.8%), with 10.1 million 2-way trucking movements at Canada-US border points compared to 10.9 million 2-way trucking movements in 2019 (See Map 8 in Annex). It was also below the 3-year average (-8.7%).Despite stricter public health measures, truck border crossings had almost fully recovered by the end of the year, hovering close to 2019 levels. Trucking was deemed an essential service by governments which allowed the industry to continue to operate. Moreover, the consumer shift from services to goods had a positive impact on the demand for freight transportation.
Amid lower truck traffic at each of the top 15 border crossings monitored, the majority of border wait times for southbound trucks also declined in 2020. The average median wait time of southbound trucks at the 15 border crossings monitored was 10.1 minutes, a 15.3% decrease in wait times over the 3-year average, or 1.9 minutes faster.
Only Fort Erie, Ontario; St. Stephen, New Brunswick; and Pacific Highway, British Columbia displayed an average median wait time for southbound trucks which was higher than the historical 3-year average. Pacific Highway, British Columbia, and Lansdowne, Ontario had the longest southbound truck border wait times in 2020.
Urban mobility
Beginning in March 2020, due to COVID-19 stay-at-home measures, traffic in urban areas across the country was significantly reduced. April 2020 saw so little traffic that conditions were essentially free-flow on all major urban roads and highways in the country. By September, with partial reopening taking place at different rates across Canada, some traffic congestion had returned albeit at lower levels than the previous year.
In 2019, Highway 401 in Toronto was among the most congested urban corridors in Canada with up to 275% longer average peak period travel times on some segments in comparison to free-flow conditions. In September 2020, peak period travel times had decreased by 26% on average compared to 2019, and the average congestion remained below levels considered “severe”.
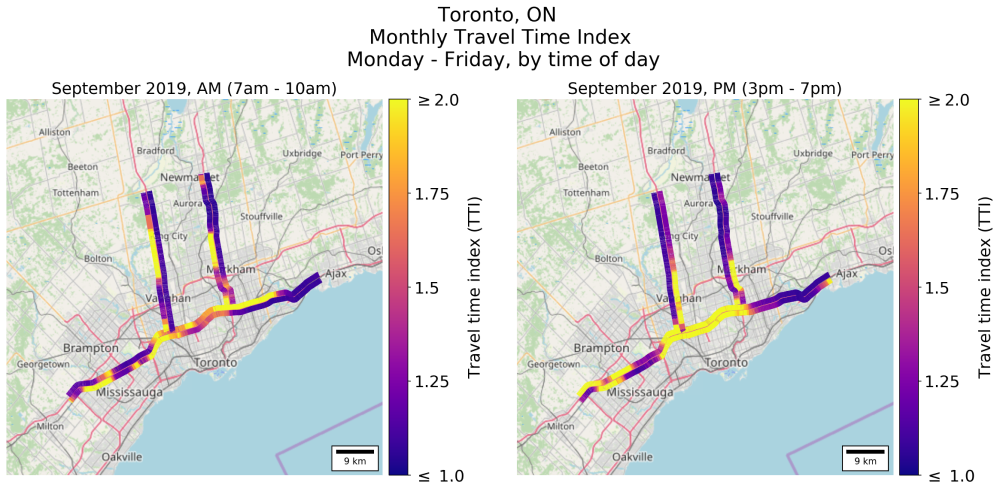
Image description - Map: Urban mobility Toronto
The figure shows two maps of Toronto side-by-side with travel time index for September 2019. Travel time index is a ratio of peak period travel time to free-flow travel time. An index of 1 means traffic is flowing freely, and an index of 2 means traffic is moving at half the free-flow speed. The left panel corresponds to the morning peak period (7-10am) and the right panel corresponds to the afternoon peak period (3-7pm). On each map, the travel time index along the major corridors is indicated by colour. Brighter colour means higher travel time index, or more congestion. The map shows the location of congestion bottlenecks and how long and severe they are.
In Montreal, the westbound highway A-40 saw an average 33% decrease in travel time between Blvd. Décarie and A-25 from September 2019 to September 2020. Despite the pandemic, peak period urban traffic in Montreal had twice the average travel time on some highways in September 2020 compared to free-flow conditions.
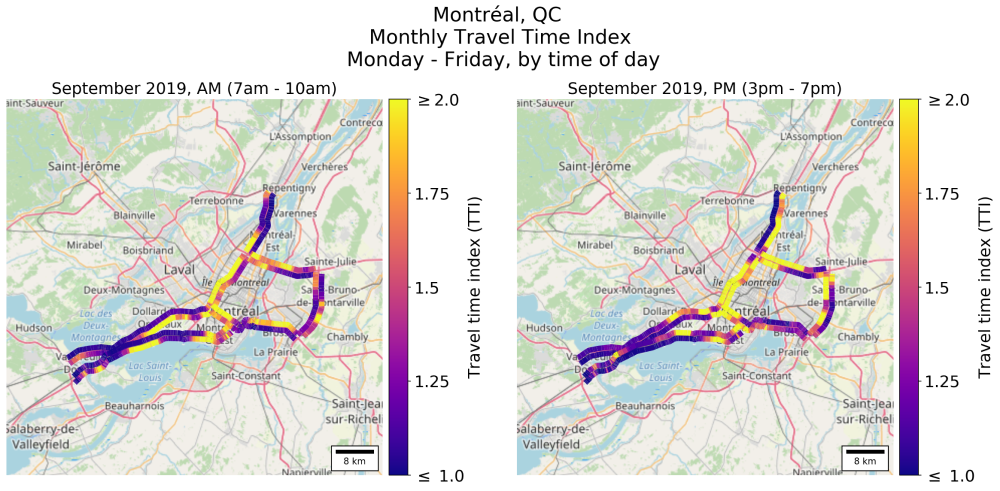
Image description - Map: Urban mobility Montréal
The figure shows two maps of Montréal side-by-side with travel time index for September 2019. Travel time index is ratio of peak period travel time to free-flow travel time, so an index of 1 means traffic is flowing freely, and an index of 2 means traffic is moving at half the free-flow speed. The left panel corresponds to the morning peak period (7-10am) and the right panel corresponds to the afternoon peak period (3-7pm). On each map, the travel time index along the major corridors is indicated by colour. Brighter colour means higher travel time index, or more congestion. The map shows the location of congestion bottlenecks and how long and severe they are.
In Western Canada, the Calgary-Edmonton corridor continues to be 1 of the most heavily used by passenger and commercial traffic. In Calgary, peak period travel times in September on northbound Highway 2 decreased by 26% compared with the same month of the previous year. In Vancouver, the peak period travel time on southbound Highway 99 decreased by an average of 33% from September 2019 to September 2020.
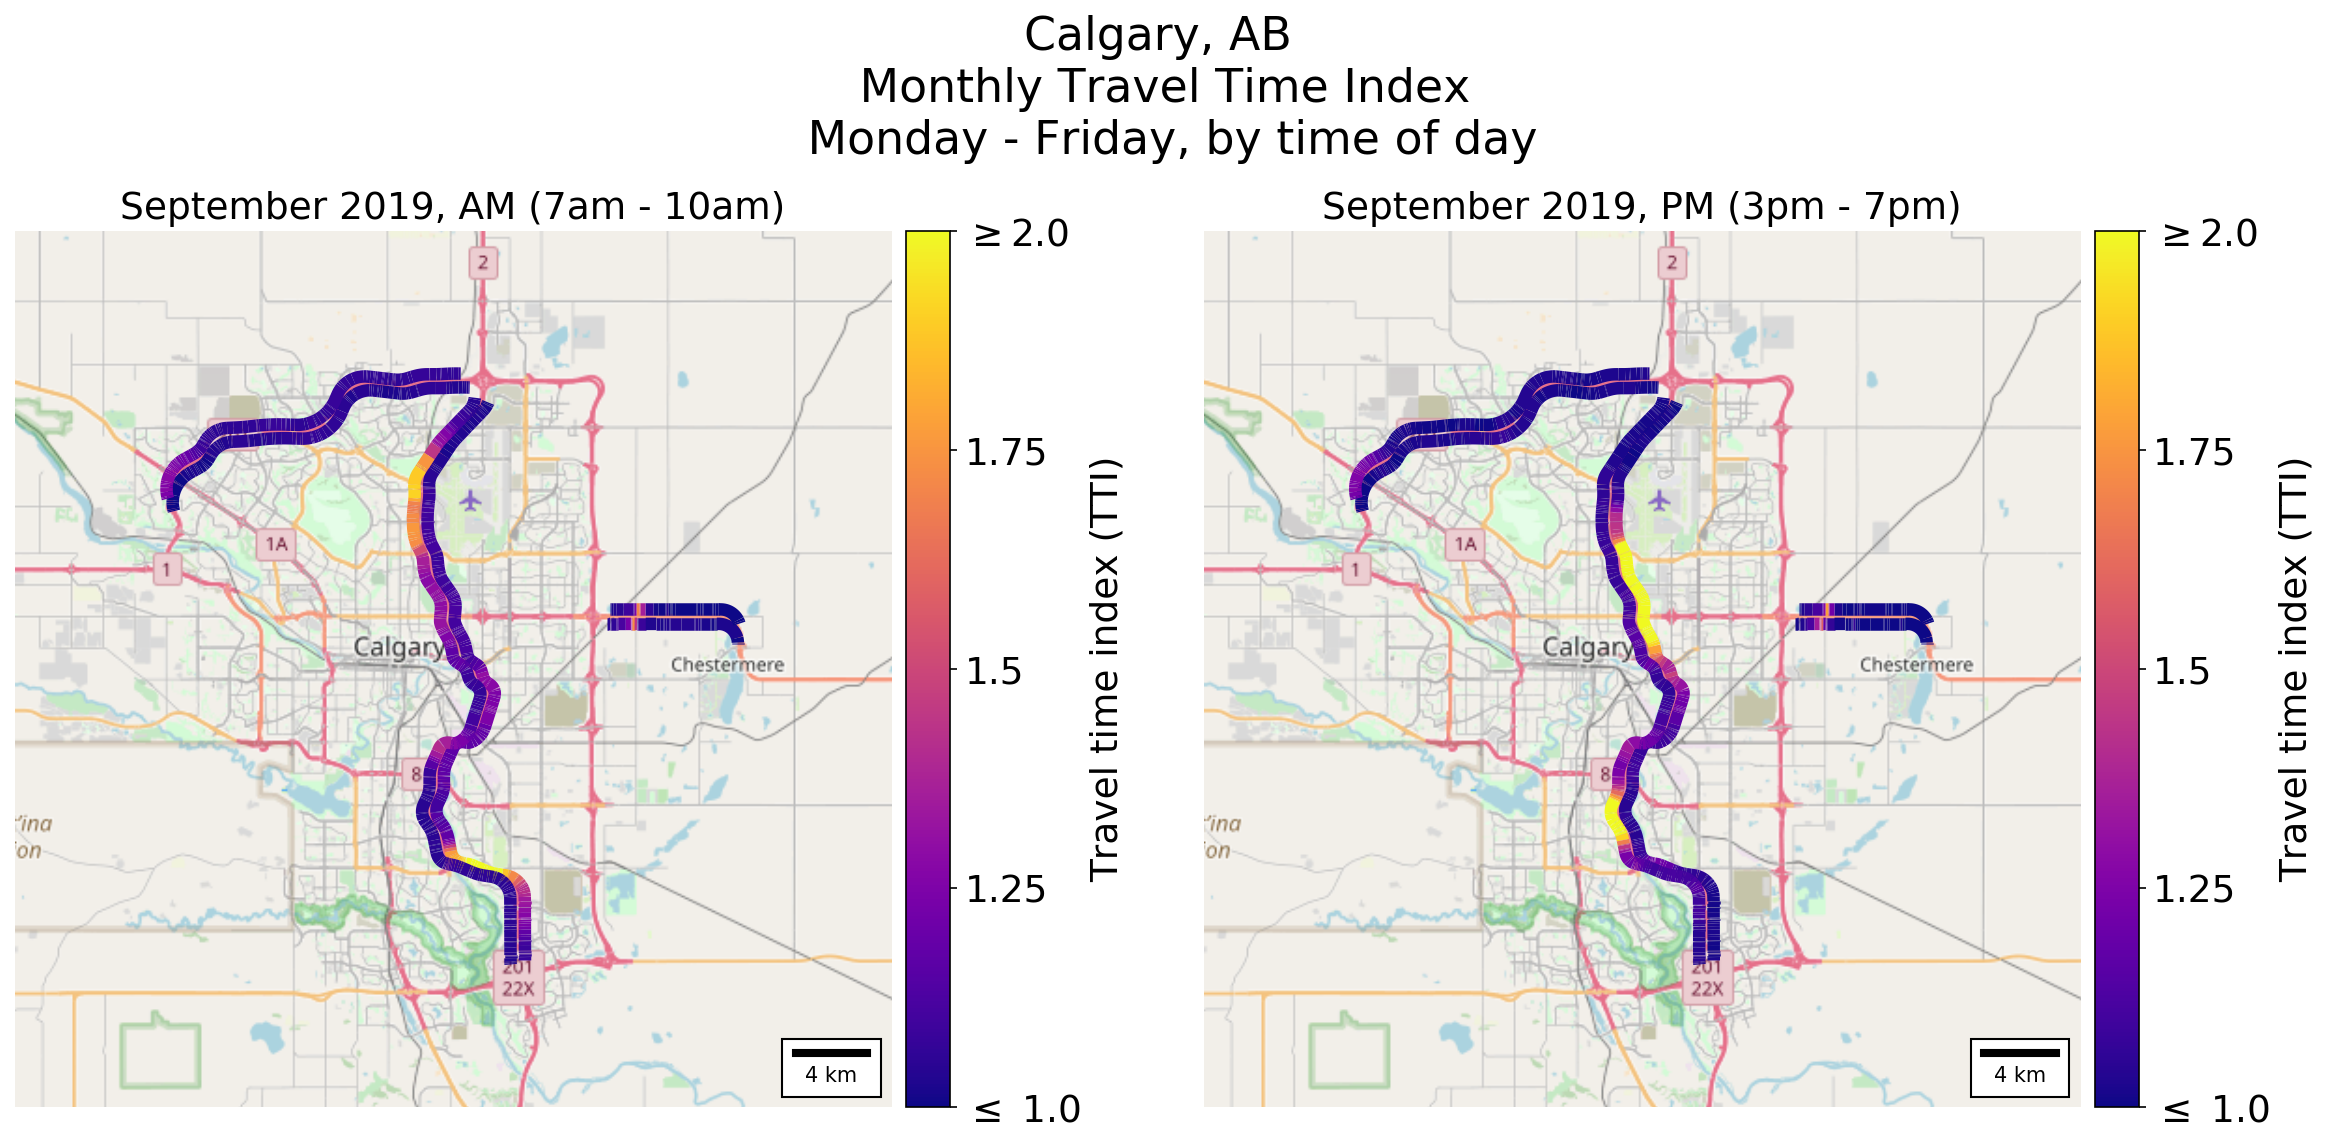
Image description - Map: Urban mobility Calgary
The figure shows two maps of Calgary side-by-side with travel time index for September 2019. Travel time index is ratio of peak period travel time to free-flow travel time, so an index of 1 means traffic is flowing freely, and an index of 2 means traffic is moving at half the free-flow speed. The left panel corresponds to the morning peak period (7-10am) and the right panel corresponds to the afternoon peak period (3-7pm). On each map, the travel time index along the major corridors is indicated by colour. Brighter colour means higher travel time index, or more congestion. The map shows the location of congestion bottlenecks and how long and severe they are.

Image description - Map: Urban mobility Vancouver
The figure shows two maps of Vancouver side-by-side with travel time index for September 2019. Travel time index is ratio of peak period travel time to free-flow travel time, so an index of 1 means traffic is flowing freely, and an index of 2 means traffic is moving at half the free-flow speed. The left panel corresponds to the morning peak period (7-10am) and the right panel corresponds to the afternoon peak period (3-7pm). On each map, the travel time index along the major corridors is indicated by colour. Brighter colour means higher travel time index, or more congestion. The map shows the location of congestion bottlenecks and how long and severe they are.
In the 4th quarter of 2020, travel time index across the country began to decline again as the COVID-19 pandemic situation worsened with the second wave. A return of stay-at-home orders and business closures caused a reduction in the traffic congestion in major urban areas to levels previously seen in the spring-summer of 2020. Highway-401 westbound across Toronto saw an afternoon TTI of 1.4 in December of 2020, a 24% reduction compared to 2019. Autoroute-40 eastbound through downtown Montreal saw an afternoon TTI of 2.0 in December of 2020, a 20% decrease relative to 2019.
Partnerships and collaboration
Transport Canada invests in multi-stakeholder partnership projects on data gathering and supply chain visibility to foster regional evidence-based dialogue, promote optimization of existing capacity, and support planning and coordination of private/public investments. Over the last decade, Transport Canada has been collaborating with government and industry partners, including Canadian Port Authorities, railways, and shippers to enhance data visibility and knowledge about supply chain fluidity and reliability.
For example, Transport Canada supports ports, railways, and other partners to plan their operations and manage fluidity by sharing the Canadian Border Services Agency advanced arrival information for inbound containerized cargo destined for select Canadian ports.
Supply chain visibility projects
Building on the success of the pilot project developed at the Port of Vancouver, Transport Canada invested an additional $6 million through the National Trade Corridor Fund to support the Port of Vancouver, the Port of Prince Rupert and other Pacific Gateway Partners to develop visibility for additional modes and commodities through the West Coast Supply Chain Visibility Program. The program will provide insight to inform decisions for infrastructure investments, policy decisions and day-to-day operations.
Transport Canada also recognizes the need to help support productivity, competitiveness and trade corridor fluidity in the urban context, and to this end is working with partners on supply chain visibility initiatives in Ontario’s Greater Toronto and Hamilton region. Using a mix of public and private data sets, the Smart Freight Centre, the Toronto Region Board of Trade, and the Hamilton Oshawa Port Authority and the McMaster Institute of Transportation and Logistics (Fluid Intelligence) have each launched individual projects (in collaboration with multiple partners) that focus on urban mobility, air cargo and marine trade and transportation.
The Ontario supply chain visibility initiatives are unique in that each of the 3 key organizations have responsibilities for specific sets of public or private transportation data, relevant to their distinct areas of research, analysis and collaboration, and undertaking initiatives that will serve to improve supply chains in the region and also contribute to the Canadian Centre for Transportation Data at Statistics Canada.
Commodity supply chain table
Collaboration among industry stakeholders is critical to ensure an efficient transportation system. To that end, the Commodity Supply Chain Table (the Table) brings together over 150 stakeholders from the freight rail industry such as producers, shippers, service providers and other supply chain partners involved in moving commodities by rail to identify and address transportation system issues. The Table is national and is an inclusive discussion forum that focuses on the resiliency, efficiency, effectiveness of Canada’s freight rail-base transportation system. Although facilitated by Transport Canada, participants are very active in the development of meeting agendas, presentations made during the meetings, etc. The Table focuses on the needs of the transportation stakeholders.
Although the Table meets twice a year since 2014, in 2020 Transport Canada organized 5 (5) meetings, all held virtually, in response to the needs of participants as the supply chain adjusted to the impacts of COVID, and other disruptions and challenges that occurred in parallel to the pandemic, such as shortage of containers for exports, winter challenges, blockades and strikes.
Among other things, Transport Canada, railways, shippers and marine stakeholders presented on and exchanged on the performance and challenges of their supply chains, economic projections and upcoming demand for transportation service, and/or mitigating actions for disruptions. In 2020, the Minister of Transport, the Deputy Minister and the Associate Deputy Minister of Transport Canada each individually attended 1 meeting and exchanged with the participants. Such collaboration and open dialogue between participants and with Transport Canada have helped improve monitoring, planning and coordination among supply chain partners and in turn, supported the timely delivery of essential goods and consumers’ freight, as well as exports of Canadian goods, supporting the Canadian economy and response to COVID.