
Overall, domestic transport-related greenhouse gas emissions have increased by 15% over the past decade (2009 to 2018). Canada’s National Inventory Report 1990-2018 indicates decreased emissions for marine transportation, and increased emissions for aviation, rail and road transportation (see chart below). For the latest historical emissions estimates for Canada, including for transportation, please consult https://www.canada.ca/en/environment-climate-change/services/climate-change/greenhouse-gas-emissions/inventory.html.
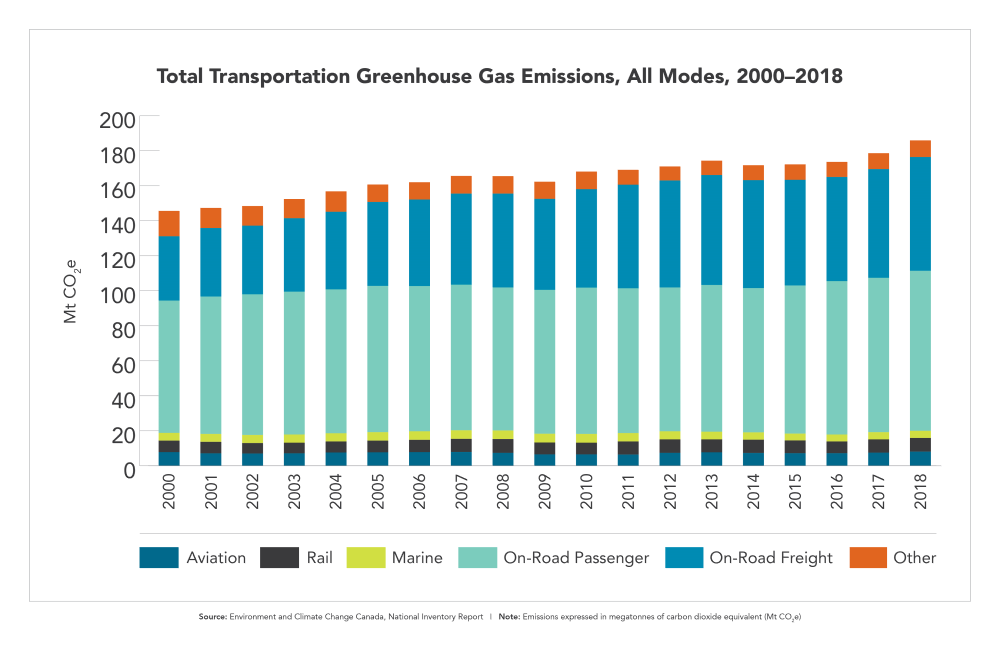
Image description: Total Transportation Greenhouse Gas Emissions
The chart shows the total metric tonnes of greenhouse gas emissions, as well as the share of that total across 6 modes (aviation, rail, marine, on-road passenger, on-road freight and other) from the year 2000 to 2018. In 2018, aviation represented 8,1Mt of emissions, rail represented 7.8Mt of emissions, marine represented 4.1Mt of emissions, on-road passenger represented 91.4Mt of emissions and on-road freight represented 65.0Mt of emissions.
| Mode | |||||||
|---|---|---|---|---|---|---|---|
| Year | Aviation | Rail | Marine | On-Road Passenger | On-Road Freight Other | Other | |
| 2000 | 7.8 | 6.6 | 5.0 | 75.6 | 36.7 | 14.5 | |
| 2001 | 7.1 | 6.6 | 5.5 | 78.5 | 39.1 | 11.5 | |
| 2002 | 7.0 | 6.0 | 5.5 | 80.4 | 39.2 | 11.2 | |
| 2003 | 7.1 | 6.1 | 6.4 | 81.6 | 41.9 | 11.0 | |
| 2004 | 7.6 | 6.3 | 6.8 | 82.2 | 44.3 | 11.6 | |
| 2005 | 7.7 | 6.7 | 6.5 | 83.6 | 47.9 | 10.0 | |
| 2006 | 7.8 | 7.0 | 6.0 | 83.0 | 49.3 | 9.8 | |
| 2007 | 7.8 | 7.5 | 6.6 | 83.2 | 51.9 | 10.1 | |
| 2008 | 7.4 | 7.9 | 6.4 | 81.7 | 53.5 | 9.9 | |
| 2009 | 6.5 | 6.8 | 6.6 | 82.2 | 51.9 | 9.7 | |
| 2010 | 6.5 | 6.6 | 6.9 | 83.6 | 56.1 | 10.1 | |
| 2011 | 6.4 | 7.5 | 5.7 | 82.8 | 59.0 | 8.4 | |
| 2012 | 7.4 | 7.7 | 5.7 | 82.3 | 61.0 | 8.0 | |
| 2013 | 7.7 | 7.4 | 5.3 | 83.9 | 62.7 | 8.1 | |
| 2014 | 7.3 | 7.6 | 4.9 | 82.6 | 61.6 | 8.4 | |
| 2015 | 7.3 | 7.2 | 4.8 | 85.1 | 60.5 | 8.7 | |
| 2016 | 7.2 | 6.7 | 3.7 | 88.4 | 59.7 | 8.5 | |
| 2017 | 7.5 | 7.6 | 4.1 | 88.2 | 62.1 | 9.1 | |
| 2018 | 8.1 | 7.8 | 4.1 | 91.4 | 65.0 | 9.5 | |
Source: Environment and Climate Change Canada, National Inventory Report
Note: Emissions expressed in megatonnes of carbon dioxide equivalent (Mt CO2e)
Air sector
In 2018, domestic aviation emitted 8.1 megatonnes of CO2e. This accounts for 4.4% of domestic transportation-related greenhouse gas emissions. While emissions from air travel have increased since 2005 owing to increased air traffic, reporting under Canada’s Action Plan to Reduce greenhouse gas Emissions from Aviation identifies a steady improvement in air carrier emission intensity performance, specifically a 2% average annual improvement or a cumulative improvement of 18.4% from 2008 to 2018Footnote 1. Between 2017 and 2018 Canadian air carriers improved their overall fuel efficiency by 3.3%.
Marine sector
In 2018, the domestic marine sector emitted 4.1 megatonnes of CO2e. This is 2.2% of domestic transportation-related greenhouse gas emissions. Over the 2005 to 2018 period, domestic marine greenhouse gas emissions decreased by 15%, in part as shippers have shifted to other modes such as trucks and rail.
In calendar year 2020, the National Aerial Surveillance Program flew a total of 3765 hours of surveillance over Canada’s 3 coasts, including 304 to monitor the North Atlantic right whale. During these patrols, 673 pollution incidents were detected and the quantity of oil observed in the marine environment was estimated at around 17,319 litres. Regular aerial surveillance flights contribute significantly to the decrease in oil discharges from commercial vessels at sea, as ships are increasingly aware their illegal polluting activities can be detected.
Rail Sector
In 2018, the rail sector emitted 7.8 megatonnes of CO2e. This is 4.2% of domestic transportation-related greenhouse gas emissions. Freight operations accounted for 98% of rail greenhouse gas emissions. According to the latest annual Locomotive Emissions Monitoring Report (2017), Canadian railways have reduced their greenhouse gas emission intensity by 2.45 kg CO2e per 1,000 revenue tonne kilometres compared to 2010Footnote 2. This has limited the net growth of greenhouse gas emissions in this sector to 0.2 MT CO2e from 2011 to 2017, despite freight traffic increasing by 19.4% (revenue tonne kilometres) and intercity passenger traffic increasing by 4.1% (passengers).
Road sector
In 2018, the road transportation sector emitted 156 megatonnes of CO2e, or 84% of transportation-related greenhouse gas emissions and 21% of total Canadian greenhouse gas emissions.
From 2005 to 2018, road transportation greenhouse gas emissions grew by 19%. Despite fuel efficiency improvements across all vehicle classes, this increase stems from:
- growth in passenger and freight activity
- a shift towards more greenhouse gas-intensive transportation, including heavy duty trucks and larger passenger vehicles (for example, SUVs and light trucks)
Greenhouse gas emissions from on-road freight vehicles increased by 35.8% between 2005 and 2018, from 48 to 65 megatonnes. Over the same period, road freight activity, measured in tonne-kilometres, also increased by around 35%.
Greenhouse gas emissions from on-road passenger vehicles increased by 9.3% between 2005 and 2018, from 84 to 91 megatonnes. Over the same period, road passenger activity measured in vehicle passenger-kilometres increased by about 17%.
Federal regulations have set progressively stricter greenhouse gas emission standards for both new passenger automobiles and light trucks of model years 2017 and beyond, and new heavy-duty vehicles and engines of model years 2021 to 2027. This builds on existing standards covering earlier model years.