
In 2020, all modes of passenger transportation faced tremendous challenges leading to drastic reductions of passenger flows and no meaningful recovery. The COVID-19 pandemic, but more specifically the restrictions put in place from various levels of governments to limit its spread have profoundly altered travel patterns. Air transportation was the most affected sector, along with the cruise industry which suffered from a ban in 2020. In contrast, public transportation, which is necessary for many of Canada’s essential workers, succeed in recovering a significant share of its lost ridership in the second half of 2020.
Air passenger flows and performance
The air passenger industry has been hit hard by the COVID-19 pandemic. Small gains were made throughout the year, but the recovery of Canada’s air passenger sector has been slow. In comparison, recovery in the US has been more significant, mainly driven by their larger market for domestic travel.
Overall, the pandemic, along with the restrictions put in place to control it, have resulted in Canadian airports reporting an estimate of 45.6 million air passengers. This represents a stark decrease of 71.8% over 2019 (see passenger flows for main Canadian airports on map 8 in Annex).
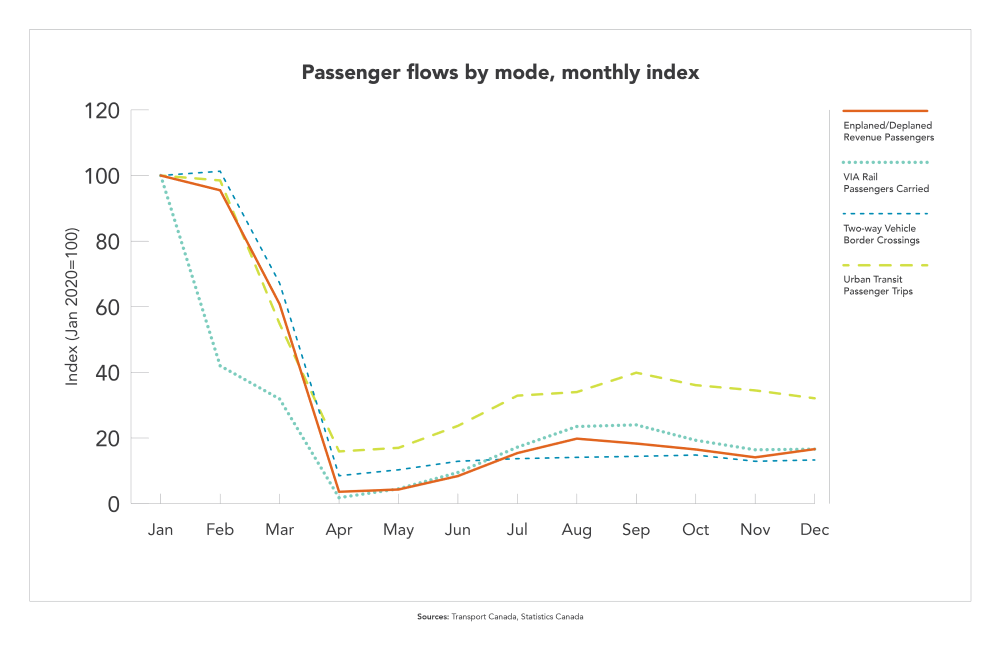
Image description - Passenger flows by mode, monthly index
The line chart shows the Passenger flows indicators by mode for 2020. Passenger flows indicators include the enplaned/deplaned revenue passengers, VIA Rail passengers carried, two-way vehicle border crossings and urban transit passenger trips data.
| Month | Enplaned/Deplaned Revenue Passengers | VIA Rail Passengers Carried | Two-way Vehicle Border Crossings | Urban Transit Passenger Trips |
|---|---|---|---|---|
| Jan | 100.0 | 100.0 | 100.0 | 100.0 |
| Feb |
95.5 |
42.0 | 101.3 | 98.5 |
| Mar | 60.8 | 31.9 | 67.2 | 54.8 |
| Apr | 3.6 | 1.8 | 8.5 | 15.9 |
| May | 4.3 | 4.5 | 10.3 | 17.0 |
| Jun | 8.4 | 9.5 | 12.9 | 23.7 |
| Jul | 15.4 | 17.2 | 13.7 | 32.9 |
| Aug | 19.8 | 23.5 | 14.1 | 34.0 |
| Sep | 18.3 | 24.0 | 14.4 | 39.9 |
| Oct | 16.5 | 19.3 | 14.8 | 36.1 |
| Nov | 14.1 | 16.4 | 12.9 | 34.5 |
| Dec | 16.6 | 16.6 | 13.3 | 32.1 |
Sources: Transport Canada, Statistics Canada
This reduced demand has left operators in a precarious position, having to resort to cost cutting tactics which only mildly softened the blow. Many airlines have had to cut back on services across the board, which has the potential to disconnect communities that lack other methods of travel to larger cities. Over 140 remote communities currently rely on air transportation to connect them to larger hubs.
In 2020, the air sector served:
- 28.4 million passengers on domestic services (69.3% less than in 2019)
- 7 million passengers on services between Canada and the US (78.1% less than in 2019)
- 10 million passengers on other international services (72.8% less than in 2019)
Around 89.4% (40.7 million) of the total air passenger traffic was handled at Canada’s Top 20 airports.
- Toronto Pearson International served 12.9 million passengers (73.7% annual decline), representing 28.3% of national air passenger traffic
- Vancouver International served 7 million passengers (72.2% annual decline), representing 15.5% of national air passenger traffic
- Montreal-Trudeau International served 5.1 million passengers (73.3% annual decline), representing 11.3% of national air passenger traffic
The Air Travel Performance Data Regulations came into force in December 2019 to accomplish 3 goals:
- assist in assessing and monitoring the effectiveness of the Canadian Transportation Agency’s Air Passenger Protection Regulations
- assess and monitor air passengers’ experience, and make evidence-based policy decisions, and
- monitor industry performance trends and inform consumers’ decision-making by publishing certain performance statistics via the Canadian Center for Transportation Data
These regulations require air carriers to report on operational performance: including on-time performance data (departures, arrivals, cancellations, and the causes of delay), data on tarmac delays, denied boarding, baggage data, and complaints data.
Marine sector
During the onset of the pandemic, the world bore witness to COVID-19 outbreaks on a number of cruise ships around the world, ultimately leading to the cessation of the cruise industry in Canada. In response, there was no cruise ship traffic at Canada’s major ports over 2020. The ban on cruise ships entering Canadian ports is currently extended to February 28, 2022.
Ferries have also been effected by restrictions put in place by multiple levels of government. While the majority of domestic ferries are still operational, traffic levels have declined significantly as they adjust to accommodate physical distancing measures, passenger limits, and service level adjustments.
In 2020, BC Ferries transported 13,972,264 passengers, 37.4% fewer than 2019. Looking at passenger numbers from April 1-December 31 shows an even larger reduction in ridership of 42.1%.
International ferries face more complex issues in their recovery, and while some remained operational in the first quarter of 2020, most ceased operations when additional restrictions limiting border crossings to essential travel came into effect. However, 1 international ferry remained in operation throughout 2020, though at a greatly reduced service rate. This is the ferry route between St-Pierre-et-Miquelon, France and Newport, Newfoundland and Labrador.
Rail sector
The volume of passengers traveling by rail was significantly impacted by the COVID-19 pandemic. VIA Rail’s annual passenger traffic declined 76.8% to around 1.2 million in 2020. The Quebec City - Windsor corridor, historically the busiest part of VIA Rail’s network, witnessed a decrease of 77.1% from 2019, at just 1.1 million passengers.
The pandemic also resulted in the suspension of many important routes throughout Canada. Suspended routes ranged from popular routes such as Vancouver-Toronto, to less frequented routes such as Windsor-Churchill. In light of this, VIA Rail opted to use this downtime to accelerate inspection and repair programs.
In 2020, 13 thousands passengers used rail carriers to cross Canada-US border points, down 93.6% from 2019. The number of travelers entering or returning to Canada by rail in January 2020 was 11.7% higher than in January 2019. For February and March 2020, the number of travelers had fallen by 51.1% compared to the same period in 2019. Over the remaining of the year, there were no travelers entering or returning to Canada by rail.
Road sector
Unlike commercial vehicle movements, the number of 2-way passenger vehicle movements recorded at Canada-US border crossings in 2020 was down 76% compared to 2019, at 12.9 million. The imposition of restrictions on non-essential services explain this decline and the lack of significant recovery. In December 2020, the number of 2-way passenger vehicle movements was still 89% lower than in December 2019.
The travel time index presented in the freight section is also a good indicator of passenger travel performance, with higher values indicating more traffic and congestion on the urban road network, which is used by both freight and passenger vehicles.
Public transportation sector
There was a drastic reduction in public transportation ridership throughout 2020. In 2020, public transit systems carried around 849 million passengers, a 55% decrease from 2019.
During the early stages of the pandemic the loss of ridership was much larger, reaching upwards of 90%. The sector began a period of recovery during the summer months, when daily COVID-19 cases were low, with consecutive months of growth from June-September. Following this rebound, ridership declined again as the country entered the second wave of cases. December marked the tenth month of decline year-over-year, with networks carrying 52.5 million passengers, down 65.8% from December 2019.
Recovery has differed across Canada’s regions. In Quebec and Ontario, ridership declined 79% from 161 million passengers in February to 26 million in April. The region finished the year with 33 million riders in December, a decline of 69% year-over-year.
The western provinces and territories followed a similar path as Quebec and Ontario, with ridership also declining by 79% during the onset of the pandemic. December saw a 60% decline in passengers versus the same period in 2019.
Atlantic Canada saw ridership levels drop 77% from 2.6 million passenger trips in February to 600,000 in April. Since then, ridership increased to 1.3 million trips in December, 48% of their pre-pandemic levels. The Atlantic region has experienced the highest levels of recovery throughout the country.
Transit Agencies have been taking steps to adapt to the situation. For example, in Ontario, the Metrolinx Go Transit system has faced ridership declines of more than 90%. It has responded by reducing frequency – such as the express line which connects Toronto’s Union Station to Toronto-Pearson Airport – and replacing some of the more heavily effected routes with buses.