
Domestic transport-related greenhouse gas emissions have increased by 2.8% from 2010 to 2019. However, they decreased by 11.8.% from 2019 to 2021 because of the COVID-19 pandemic. Canada’s National Inventory Report 2000-2021 noted lower emissions for aviation transportation, and higher emissions for marine, rail and road transportation (see Figure).
For the latest historical emissions estimates for Canada, including for transportation, please see Canada’s official greenhouse gas inventory.
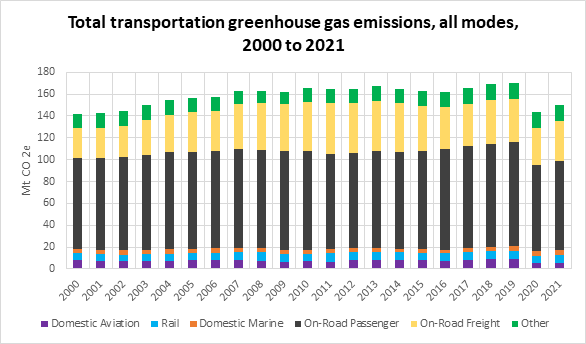
Figure 8: Total Transportation Greenhouse Gas Emissions, All Modes, 2000 to 2021
Description
The chart shows the total metric tonnes of greenhouse gas emissions, as well as the share of that total across 6 modes (aviation, rail, marine, on-road passenger, on-road freight and other) from the year 2000 to 2021. In 2021, aviation represented 5.83Mt of emissions, rail represented 7.00Mt of emissions, marine represented 4.56Mt of emissions, on-road passenger represented 81.74Mt of emissions and on-road freight represented 36.51Mt of emissions.
| Year | Domestic Aviation | Rail | Domestic Marine | On-Road Passenger | On-Road Freight | Other |
|---|---|---|---|---|---|---|
| 2000 |
7.86 |
6.64 | 3.74 | 83.17 | 27.90 | 12.93 |
| 2001 | 7.23 | 6.59 | 3.83 | 83.58 | 27.90 | 13.22 |
| 2002 | 7.10 | 6.09 | 3.92 | 85.14 | 28.43 | 13.81 |
| 2003 | 7.21 | 6.13 | 3.98 | 87.09 | 31.54 | 13.60 |
| 2004 | 7.71 | 6.30 | 4.07 | 88.93 | 33.70 | 13.59 |
| 2005 | 7.80 | 6.71 | 4.16 | 88.57 | 36.08 | 13.48 |
| 2006 | 7.83 | 7.03 | 4.10 | 88.68 | 36.99 | 13.02 |
| 2007 | 7.92 | 7.54 | 4.07 | 90.50 | 40.62 | 12.00 |
| 2008 | 7.57 | 7.96 | 4.01 | 89.72 | 42.36 | 11.60 |
| 2009 | 6.76 | 6.82 | 3.95 | 90.49 | 42.75 | 11.26 |
| 2010 | 6.81 | 6.65 | 3.88 | 90.51 | 45.29 | 12.36 |
| 2011 | 6.73 | 7.40 | 3.77 | 87.33 | 46.18 | 13.01 |
| 2012 | 7.75 | 7.58 | 3.66 | 86.94 | 45.64 | 13.05 |
| 2013 | 8.03 | 7.29 | 3.52 | 89.15 | 45.59 | 13.53 |
| 2014 | 7.73 | 7.46 | 3.40 | 88.11 | 45.17 | 12.83 |
| 2015 | 7.74 | 7.11 | 3.27 | 89.75 | 41.36 | 13.36 |
| 2016 | 7.68 | 6.53 | 3.45 | 92.30 | 38.14 | 14.28 |
| 2017 | 8.12 | 7.44 | 3.64 | 93.14 | 38.27 | 14.77 |
| 2018 | 8.89 | 7.61 | 3.66 | 94.50 | 29.73 | 14.96 |
| 2019 | 8.82 | 7.65 | 4.49 | 95.29 | 38.95 | 14.96 |
| 2020 | 4.98 | 7.10 | 4.02 | 79.06 | 34.19 | 13.87 |
| 2021 | 5.83 | 7.00 | 4.56 | 81.74 | 36.51 | 14.48 |
Source: Environment and Climate Change Canada, National Inventory Report, 2023
Note: Emissions expressed in megatonnes of carbon dioxide equivalent (Mt CO2e)
Air Sector
In 2021, domestic aviation emitted 5.8 megatonnes of CO2e. This is 3.9% of Canada’s transportation-related greenhouse gas emissions. Emissions from air travel have increased since 2005 because of increased air traffic. However, reports note a steady improvement in air carrier emission intensity performance.
Marine sector
In 2021, the domestic marine sector in Canada emitted 4.6 megatonnes of CO2e. This is 3.0% of the country's transportation-related greenhouse gas emissions. This is a 9.7% increase in emissions from 2005 to 2021. However, oil discharges from commercial vessels at sea have reduced. This is because of the increased use of regular aerial surveillance, which has made ships more aware that illegal polluting activities can be detected.
Rail sector
In 2021, the rail sector emitted 7.0 megatonnes of CO2e. This is 4.7% of domestic transportation-related greenhouse gas emissions.
According to the 2021 annual Locomotive Emissions Monitoring Report, published in 2023, the total greenhouse gas emissions from rail operations in Canada decreased by 2.8% between 2020 and 2021. This decrease was from emission intensity improvements of Class 1 freight railways (1.2% compared to 2020) and less traffic.
In 2021, the COVID-19 pandemic continued to affect greenhouse gas emissions intensities of intercity and commuter passenger railways. This is because of decreased ridership relative to pre-pandemic levels.
Road sector
In 2021, the road transportation sector emitted 118 megatonnes of CO2e (carbon dioxide equivalent). This was 79% of Canada’s transportation related greenhouse gas emissions, and 18% of all Canadian greenhouse gas emissions.
From 2005 to 2021, greenhouse gas emissions from road transportation decreased by 5%. On-road activity and emissions were significantly reduced in 2021 from 2019 because of the COVID-19 pandemic and related travel restrictions. Despite fuel efficiency gains across all vehicle classes, the increase from 2005 to 2019 is from:
- a growth in passenger and freight activity
- a shift towards more greenhouse gas-intensive transportation, including heavy-duty trucks and larger passenger vehicles (like SUVs and light trucks)
Greenhouse gas emissions from on-road freight vehicles experienced a slight 1% increase between 2005 and 2021, from 36.1 to 36.5 megatonnes. Over the same period, road freight activity, measured in tonne-kilometres, grew by 16.5%. This shows how important improved fuel efficiency and technology adoption gains are in the sector.
Greenhouse gas emissions from on-road passenger vehicles decreased by 8% between 2005 and 2021, from 89 to 82 megatonnes. Over the same period, road passenger activity measured in vehicle passenger-kilometres increased by about 7%. The decrease in emissions in 2020-21 is because of personal travel reductions related to the COVID-19 pandemic, vehicle fuel efficiency improvements and an increased share of zero-emission vehicles on the road.
Federal regulations have set greenhouse gas emission standards that are getting stricter for both new passenger automobiles and light trucks of model years 2017 to 2026, and new heavy-duty vehicles and engines of model years 2021 to 2027. This builds on existing standards covering earlier model years. In December 2023, the Government released the Electric Vehicle Availability Standard.
This created annual zero-emission vehicle requirements for manufacturers and importers of new lightduty vehicles for the purpose of sale. Requirements include 20% in model year 2026, 60% in model year 2030, and 100% in model year 2035 and beyond. The Government also announced its goal to have 35% of total medium- and heavy-duty vehicle sales to be zero-emission by 2030. It plans to require 100% to be zero-emission by 2040 for a subset of vehicle types based on feasibility.