Freight
The ongoing war in Ukraine, Panama Canal drought restrictions and Red Sea disruptions have generated a great level of uncertainty for Canadian and global supply chains.
In Canada, the past year had slow economic growth, tightening monetary policy and high inflation. Several climate and labour related disruptions also impacted the transportation network. Nova Scotia, Québec, Ontario, the Northwest Territories, Alberta, and British Columbia all experienced devastating wildfires during the summer. These impacted the fluidity of the transportation sector and the movement of key commodities.
Regionally, work stoppages at West Coast Ports (Vancouver and Prince Rupert) and at the St. Lawrence Seaway Management Corporation in Eastern Canada also disrupted the movement of goods domestically, as well as internationally for various transportation stakeholders.
Despite these disruptions, the Canadian transportation system remained resilient throughout 2023 and adapted quickly to meet demand. For example, during the summer wildfires, the network continued to move freight across Canada by road and rail. It adapted as needed to rebuild affected areas of the transportation network.
In 2023, volume and performance levels were mixed across the Canadian transportation sector. There was a low volume of commodities sensitive to cycles like imported containerized goods, wood products and crude oil. Rising interest rates impacted consumer spending habits and reduced residential construction. This lowered the demand for containerized goods and wood products respectively.
Demand for crude oil was impacted by weaker than expected demand in Asia, combined with high levels of production in Canada. Demand for the export of certain bulk commodities such as autos, coal and grain remained strong. Demand for vehicle sales remained consistent because of mobility needs. Coal exports were driven by stable demand in Asia. Limited global supplies of grain and recovery of Canadian production after a poor harvest led to strong demand for grain exports.
Softer demand of commodities has contributed to easing overall supply chain pressure. Various transportation performance indicators have returned to pre-pandemic levels, notably schedule integrity and inventory levels at the marine ports, and rail sector productivity and traffic (tonnage). However, some challenges remain. These include low connectivity at Canadian airports and ports, high container dwell times at ports, lower train speeds and higher delays in the rail sector. On the passenger side, performance indicators on international passenger traffic in the air sector have largely returned to prepandemic levels.
Air cargo
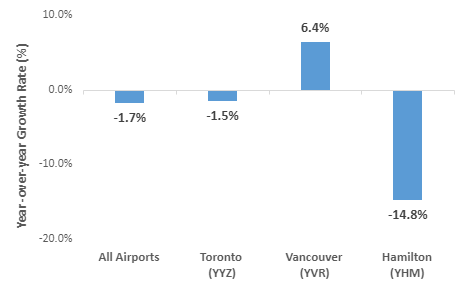
Figure 4: Air Cargo Volume Growth Rates
Description
Air Cargo Volume Growth Rates
Year-over-year growth presented as a percentage.
| All Airports | Toronto (YYZ) |
Vancouver (YVR) |
Hamilton (YHM) |
|
|---|---|---|---|---|
| 2023 vs 2022 | -1.7% | -1.5% | 6.4% | -14.8% |
Source: ECATS
After a strong emergence of e-commerce during the pandemic, softer macroeconomic conditions have slightly reduced overall demand for air cargo in 2023. Airports in Canada oversaw 1.5 million tonnes of cargo loaded and unloaded from domestic and foreign carriers in 2023, a slight 1.7% decrease compared to 2022 volumes.
The 3 busiest airports for air cargo were:
-
Toronto Pearson International Airport (423,400 tonnes in 2023, 1.5% less than in 2022)
-
Vancouver International Airport (290,400 tonnes in 2023, 6.4% more than in 2022)
-
Hamilton International Airport (139,300 tonnes in 2023, a significant change at 14.8% less than in 2022)
Marine
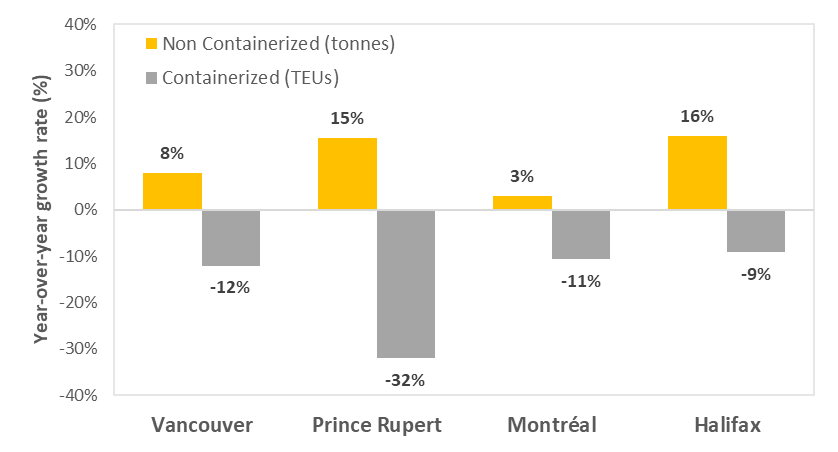
Figure 1: Port Volume Growth Rate
Description
Port Volume Growth Rate
| Non Containerized (tonnes) | Containerized (TEUs) | |
|---|---|---|
| Vancouver | 7.8% | -12.1% |
| Prince Rupert | 15.5% | -32.0% |
| Montréal | 2.9% | -10.7% |
| Halifax | 15.9% | -9.2% |
| Saint John | 1.7% | 2.2% |
| Total | 8.1% | -14.5% |
Sources: Vancouver Fraser Port Authority, Prince Rupert Port Authority, Montréal Port Authority, Halifax Port Authority.
Containerized throughput (in 20-foot equivalent units – TEU) decreased by 14.5% at the 4 largest Canadian container ports in 2023. This is after a peak during the pandemic caused by a surge in consumer spending. This decrease in demand for containerized goods has also been impacted by the macroeconomic context, namely the high inflation and monetary policy tightening, as well as high inventory levels built by retailers in 2022.
There were also several supply chain disruptions, including the major wildfires across British Columbia and Alberta and the longshoremen strike at West Coast ports in the summer of 2023. These trends and supply chain disruptions impacted Western Canadian ports, a key gateway for marine trade with Asia. This led to a 12.1% decrease of container throughput at the Port of Vancouver, and a large 32% decrease at the port of Prince Rupert.
Eastern Canadian ports are a key entry and exit gateway for marine trade with European, Mediterranean, and Southeast Asian countries. In 2023, the port of Montréal saw a large 10.7% decrease in container throughput. Halifax had a similar 9.2% decrease. The major United States ports of New York-New Jersey, Savannah, Long Beach, and Los Angeles also recorded similar declines in container throughputs in 2023.
While containerized throughput decreased, non-containerized throughputs at the four largest Canadian Ports increased by 8.1% in 2023 compared to 2022. On the West Coast, the Port of Vancouver recorded an increase of 7.8%, mostly from dry bulk such as grain and coal. A large 15.5% increase was observed at the Port of Prince Rupert, also because of an increase in coal and grain. On the East Coast, The Port of Halifax saw a large 15.9% increase of non-containerized throughput, largely based on the growth of liquid bulk commodities. The Port of Montreal had an increase of 2.9%, mostly from growth in crude, fuel, and diesel oil year-over-year.
Rail
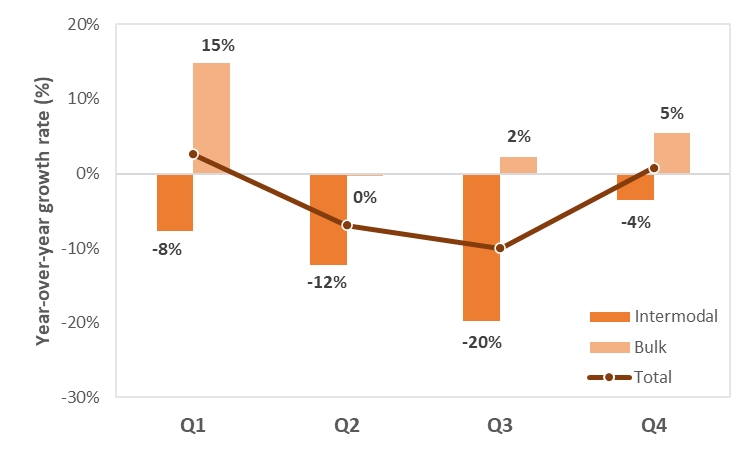
Figure 2: Rail Volume Growth Rates
Description
Rail Volume Growth Rates
Year-over-year growth rate presented as a percentage.
| Total | Intermodal | Bulk | |
|---|---|---|---|
| Q1 | 3% | -8% | 15% |
| Q2 | -7% | -12% | 0% |
| Q3 | -10% | -20% | 2% |
| Q4 | 1% | -4% | 5% |
Source: Transport Canada, Class I Railways
In 2023, system-wide rail traffic of Class I Railways was below 2022 levels (-3.6%).
Overall, bulk commodity volumes increased 5.3% in 2023 compared to 2022 thanks to the strong demand for grain and coal exports. In contrast, containerized rail traffic decreased by 11.2% in 2023 compared to 2022, largely because of the macroeconomic context impacting the demand for containerized goods.
The Western Canada rail corridor is the main trade corridor supporting the export of bulk natural resources such as grain, coal and potash to overseas markets and the United States. It also moves imported containerized goods from Asia to Central Canada and the United States.
In 2023, rail shipments to and from Western Canada decreased by -3.1% in 2023 compared to 2022. This was during a longshoremen strike at West Coast ports and the impact of wildfires in several provinces during the summer. In Central Canada, the Greater Toronto Area is the main destination for containerized rail imports from West Coast ports. In 2023, this region had a 3.5% decrease in rail shipments. For Eastern Canada, rail shipments decreased by 4% over the same period.
Road
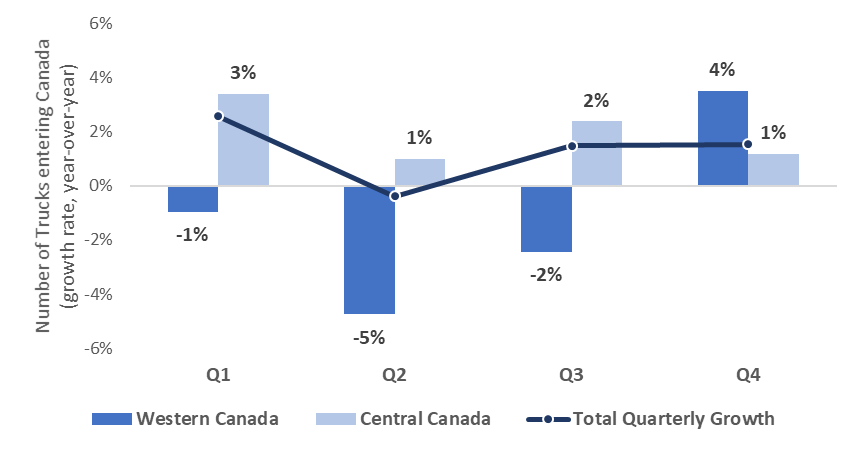
Figure 3: Trucking Volume Growth Rates (2023 vs 2022)
Description
Trucking Volume Growth Rates (2023 vs 2022)
Year-over-year growth presented as a percentage.
| Western Canada | Central Canada | Total Quarterly Growth | |
|---|---|---|---|
| Q1 | -1% | 3% | 3% |
| Q2 | -5% | 1% | 0% |
| Q3 | -2% | 2% | 1% |
| Q4 | 4% | 1% | 2% |
Source: Statistics Canada, Table 24-10-0052-01
In 2023, truck border crossings in Canada increased by 1.3% compared to 2022. Trade by truck to and from the United States is concentrated in Central Canada. The Québec-Windsor corridor remains the busiest trucking corridor. Truck border crossings increased by 2.0% in Central Canada and decreased by 1.3% in Western Canada in 2023 compared to 2022.
Border crossing flows in both directions remained fluid throughout 2023 with an average of 9 minutes for the top 15 busiest crossings. This is about a 2% decrease in wait times overall when comparing to the 3-year historical average. Sarnia and Fort-Erie/Peace Bridge were the only two border crossings that showed an increase in wait times greater than 1 minute in 2023 when compared to the 3-year historical average. They had median border wait times of 12.9 minutes and 15.6 minutes, respectively.
