

Air
The air industry has continued to recover from the pandemic in 2023, with the number of passengers in 2023 remaining below pre-pandemic levels:
- 85 million passengers on domestic services (compared to 73 million in 2022),
- 29 million passengers on services between Canada and the U.S. (compared to 21 million in 2022), and
- 39 million passengers on other international services (compared to 27 million in 2022).
Around 92.7% (142.1 million) of all air passenger traffic was managed at Canada’s Top 20 airports. Of those, the top 4 airports oversaw roughly 70.2% (82.4 million) of Canada’s total enplaned/deplaned passengers in 2022:
- Toronto Pearson International served 44.9 million passengers, representing 29.3% of national air passenger traffic.
- Vancouver International served 24.3 million passengers, representing 15.9% of national air passenger traffic.
- Montréal-Trudeau International served 21.3 million passengers, representing 13.9% of national air passenger traffic.
- Calgary International served 13.8 million passengers, representing 11.8% of national air passenger traffic.
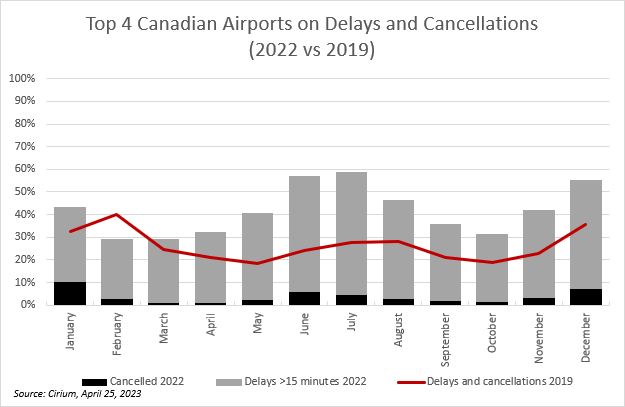
Flight delays decreased incrementally in 2023. 33.4% of all flights were delayed, compared to 40.7% in 2022. Despite this improvement, the delay rate remained approximately 10% higher than the 2019 average of 24.7%. This could partly be explained by multiple challenges in the air sector in Canada, namely climate-related weather events such as wildfires.
In summer 2023, Canada experienced its worst wildfire season on record, shutting down some airports and affecting operations at others because of smoke causing low visibility. Extreme weather events, such as severe thunderstorms and floods, also caused disruptions.
Figure 7: Top 4 Canadian Airports on Delays and Cancellations (2022 vs 2019)
Description
Bar chart showing the percentage of flights from the top four Canadian airports with delays and cancellations in 2019 and 2022. Flight delays decreased incrementally in 2023. 33.4% of all flights were delayed, compared to 40.7% in 2022. Despite this improvement, the delay rate remained approximately 10% higher than the 2019 average of 24.7%.
Marine
The cruise industry in Canada displayed strong growth in 2023, with around 3.1 million passengers in 2023, compared to 2.2 million passengers in 2022. This growth has put the industry in a strong position and ridership is above pre-pandemic levels (2.7 million in 2019).
Rail
VIA rail carried 4.1 million passengers in 2022, a 25% increase from the 3.3 million passengers in 2022. Ridership reached 82% of the pre-pandemic level of 5 million in 2019. The Québec City-Windsor corridor was the busiest segment of VIA Rail’s network, handling 96% of total passengers in 2022.
Road
Passenger counts at Canada’s land borders experienced an increase of 33.9% in 2023, with 359,000 passengers entering the country.
The travel time index in the freight section is also a useful indicator of passenger travel performance. The index’s values show the changes in traffic and congestion on the urban road network, which is used by both freight and passenger vehicles.
Public transportation
In 2023, Canada's urban transit networks continued to recover. There were an estimated 1.5 billion total passenger trips taken, up from 1.2 billion in 2022. However, this represents only 77.4% of the total ridership from 2019. Although typical pre-pandemic activities have resumed, public commuting behaviour is still changed. While Canada’s population has grown by almost 2.5 million between 2019 and 2023, there were 426.3 million fewer trips taken in 2023 vs 2019.
Total operating revenues for urban transit networks are improving, with an increase of 25.5% when comparing December 2023 to December 2022. Operating revenues have reached similar levels to 2019 while reporting fewer passenger trips. This is most likely because of cost increases per trip.