

Container supply chain
The supply chain of import containers improved in fluidity in 2023, largely because of the cooling of macroeconomic conditions. However, it was also challenged by disruptions, notably the longshoremen strike at West Coast ports.
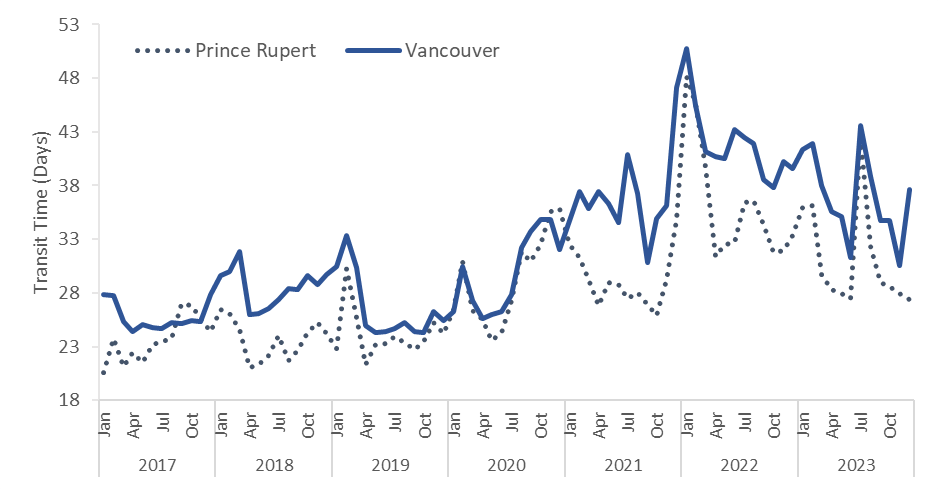
The average end-to-end transit time to import a container from Shanghai to Toronto via West Coast ports improved significantly in 2023 compared to the 2022 levels. However, it remains higher than pre-pandemic levels. On average, the end-to-end transit time for import containers was 35.0 days in 2023. This is lower than the 2022 average (39.9 days) but remains slightly above the 3-year average of 34.7 days.
Transit times peaked in July 2023 during the 13-day longshoremen strike at West Coast Ports in the late summer 2023. Transit times averaged 42.5 days when transiting through the port of Vancouver and 43.62 days through the port of Prince Rupert. The strike stopped vessel unloading and rail activity at the ports. This caused congestion and a backlog of cargo transiting through the port. Despite these challenges, Canadian ports remained time competitive with their U.S. counterparts.
On Canada’s East Coast, import container end-to-end transit time from Antwerp to Toronto averaged 21.1 days in 2023. This is slightly below the 3-year average of 21.7 days. Lower import container volumes at East Coast ports also help explain improved end-to-end transit time.
Container freight rates on key Canadian routes have returned to pre-pandemic levels after record peaks at the end of 2021 and beginning of 2022. There is lower demand for import containers and overcapacity of ocean liners. Import container freight rates on the West Coast remained close to pre-pandemic levels throughout 2023. On the East Coast, import container freight rates remained high at the beginning of 2023 and saw a large decrease and hovered close to pre-pandemic levels at the end of 2023.
Figure 5: End-to-end transit time for inbound containers via West Coast ports (Shanghai to Toronto)
Description
| Prince Rupert | Vancouver | West Coast Ports | ||
|---|---|---|---|---|
| 2016 | Jan | 23 | 26 | 25.30 |
| Feb | 20 | 26 | 24.65 | |
| Mar | 20 | 25 | 24.23 | |
| Apr | 22 | 23 | 22.94 | |
| May | 22 | 23 | 23.08 | |
| Jun | 20 | 25 | 23.76 | |
| Jul | 21 | 25 | 23.94 | |
| Aug | 21 | 25 | 24.28 | |
| Sep | 20 | 24 | 22.93 | |
| Oct | 21 | 24 | 23.39 | |
| Nov | 19 | 25 | 24.31 | |
| Dec | 22 | 28 | 26.83 | |
| 2017 | Jan | 21 | 28 | 26.27 |
| Feb | 24 | 28 | 27.03 | |
| Mar | 21 | 25 | 24.45 | |
| Apr | 22 | 24 | 24.06 | |
| May | 21 | 25 | 24.33 | |
| Jun | 23 | 25 | 24.36 | |
| Jul | 23 | 25 | 24.39 | |
| Aug | 24 | 25 | 24.91 | |
| Sep | 27 | 25 | 25.52 | |
| Oct | 27 | 25 | 25.79 | |
| Nov | 26 | 25 | 25.37 | |
| Dec | 24 | 28 | 27.11 | |
| 2018 | Jan | 26 | 30 | 28.87 |
| Feb | 26 | 30 | 29.05 | |
| Mar | 25 | 32 | 30.25 | |
| Apr | 21 | 26 | 24.83 | |
| May | 21 | 26 | 24.97 | |
| Jun | 22 | 27 | 25.50 | |
| Jul | 24 | 27 | 26.63 | |
| Aug | 22 | 28 | 26.95 | |
| Sep | 23 | 28 | 26.86 | |
| Oct | 24 | 30 | 28.40 | |
| Nov | 25 | 29 | 28.00 | |
| Dec | 24 | 30 | 28.35 | |
| 2019 | Jan | 23 | 30 | 28.54 |
| Feb | 30 | 33 | 32.72 | |
| Mar | 26 | 30 | 29.21 | |
| Apr | 21 | 25 | 24.06 | |
| May | 23 | 24 | 23.95 | |
| Jun | 23 | 24 | 24.15 | |
| Jul | 24 | 25 | 24.50 | |
| Aug | 23 | 25 | 24.71 | |
| Sep | 23 | 24 | 23.96 | |
| Oct | 23 | 24 | 24.09 | |
| Nov | 25 | 26 | 25.95 | |
| Dec | 24 | 25 | 25.08 | |
| 2020 | Jan | 26 | 26 | 26.29 |
| Feb | 31 | 30 | 30.59 | |
| Mar | 26 | 27 | 27.11 | |
| Apr | 26 | 26 | 25.56 | |
| May | 24 | 26 | 25.49 | |
| Jun | 24 | 26 | 25.81 | |
| Jul | 27 | 28 | 27.73 | |
| Aug | 32 | 32 | 32.11 | |
| Sep | 31 | 34 | 32.97 | |
| Oct | 32 | 35 | 34.07 | |
| Nov | 36 | 35 | 34.99 | |
| Dec | 36 | 32 | 32.94 | |
| 2021 | Jan | 33 | 35 | 34.08 |
| Feb | 31 | 37 | 35.32 | |
| Mar | 29 | 36 | 34.02 | |
| Apr | 27 | 37 | 34.72 | |
| May | 29 | 36 | 33.92 | |
| Jun | 29 | 35 | 32.39 | |
| Jul | 27 | 41 | 36.03 | |
| Aug | 28 | 37 | 34.28 | |
| Sep | 27 | 31 | 29.79 | |
| Oct | 26 | 35 | 32.13 | |
| Nov | 29 | 36 | 34.03 | |
| Dec | 35 | 47 | 43.55 | |
| 2022 | Jan | 48 | 51 | 49.97 |
| Feb | 46 | 45 | 45.48 | |
| Mar | 40 | 41 | 40.74 | |
| Apr | 31 | 41 | 37.72 | |
| May | 32 | 41 | 37.70 | |
| Jun | 33 | 43 | 39.10 | |
| Jul | 36 | 42 | 40.22 | |
| Aug | 37 | 42 | 39.61 | |
| Sep | 34 | 39 | 36.69 | |
| Oct | 32 | 38 | 36.51 | |
| Nov | 32 | 40 | 37.60 | |
| Dec | 33 | 40 | 37.16 | |
| 2023 | Jan | 36 | 41 | 39.46 |
| Feb | 36 | 42 | 39.66 | |
| Mar | 30 | 38 | 35.56 | |
| Apr | 28 | 36 | 33.47 | |
| May | 28 | 35 | 33.14 | |
| Jun | 28 | 31 | 30.13 | |
| Jul | 42.45 | 43.62 | 42.87 | |
| Aug | 32 | 39 | 36.92 | |
| Sep | 29 | 35 | 33.08 | |
| Oct | 29 | 35 | 32.81 | |
| Nov | 28 | 31 | 29.30 | |
| Dec | 27 | 38 | 33.39 |
Source: Transport Canada, Class 1 Railways, Canadian Port Authorities
Grain supply chain
Challenging growing conditions in Western Canada led to a smaller harvest, which led to reduced demand for transportation by rail and truck. The harvest for the 2023-2024 crop year was 67.2 million tonnes, around 10% less than what Western Canada grew in 2022-2023. Shipments from the Prairies were down by 9.7%, and the amount of grain exported from Western ports was 11.8% lower in the first 21 weeks of the 2023-2024 crop year.
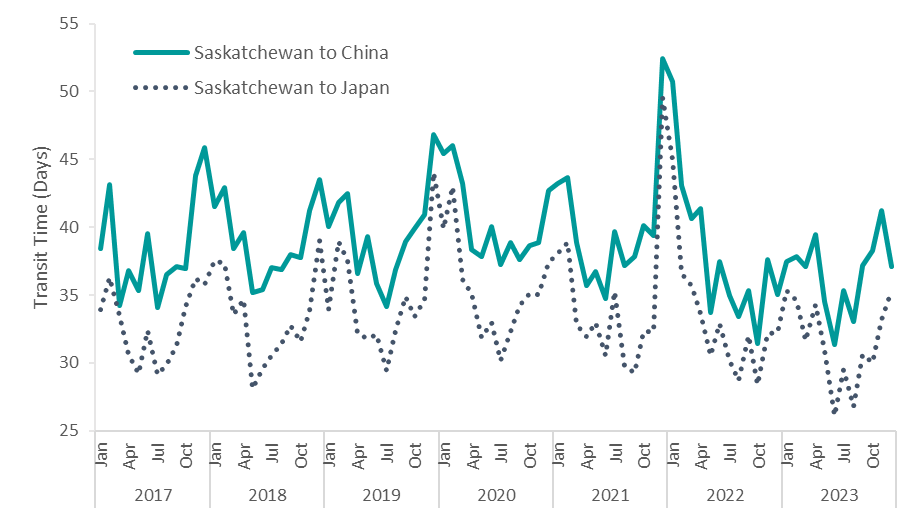
Western grain supply chain performance has stayed relatively stable over the last couple of years. There are some seasonal changes, such as transit times peaking during the winter months. It is measured using the end-to-end transit time to ship grain from Saskatchewan to Asia through the Port of Vancouver.
During Winter 2023, transportation performance was not impacted by any major supply chain or weather-related disruptions. This led to similar transit time results from the previous year. End-to-end transit times for grain from Saskatchewan to China via the Port of Vancouver averaged 36.7 days in 2023, slightly below the 3-year average of 39.4 days. For grain going to Japan, the 2023 end-to-end transit time averaged 31.5 days, just below the 3-year average of 34.3 days.
Figure 6: End-to-end transit time for grain from Saskatchewan to Asia via the Port of Vancouver
Description
End-to-end transit time for grain from Saskatchewan to Asia via the Port of Vancouver
Transit time is shown in days.
| Saskatchewan to China | Saskatchewan to Japan | ||
|---|---|---|---|
| 2016 | Jan | 37.3 | 33.5 |
| Feb | 37.6 | 33.5 | |
| Mar | 35.4 | 29.3 | |
| Apr | 35.6 | 30.8 | |
| May | 33.3 | 28.2 | |
| Jun | 30.9 | 26.6 | |
| Jul | 35.0 | 29.3 | |
| Aug | 33.8 | 29.7 | |
| Sep | 32.7 | 28.8 | |
| Oct | 37.5 | 32.4 | |
| Nov | 41.4 | 35.6 | |
| Dec | 39.3 | 34.4 | |
| 2017 | Jan | 38.4 | 33.9 |
| Feb | 43.1 | 36.3 | |
| Mar | 34.2 | 33.5 | |
| Apr | 36.8 | 30.6 | |
| May | 35.3 | 29.2 | |
| Jun | 39.6 | 32.4 | |
| Jul | 34.1 | 29.2 | |
| Aug | 36.5 | 29.9 | |
| Sep | 37.1 | 31.3 | |
| Oct | 36.9 | 34.2 | |
| Nov | 43.8 | 36.2 | |
| Dec | 45.9 | 35.8 | |
| 2018 | Jan | 41.5 | 37.6 |
| Feb | 42.9 | 37.3 | |
| Mar | 38.4 | 33.6 | |
| Apr | 39.6 | 34.7 | |
| May | 35.2 | 28.1 | |
| Jun | 35.4 | 29.6 | |
| Jul | 37.0 | 30.5 | |
| Aug | 36.9 | 31.4 | |
| Sep | 38.0 | 32.8 | |
| Oct | 37.8 | 31.6 | |
| Nov | 41.2 | 33.8 | |
| Dec | 43.5 | 39.0 | |
| 2019 | Jan | 40.1 | 34.0 |
| Feb | 41.8 | 39.0 | |
| Mar | 42.4 | 37.6 | |
| Apr | 36.6 | 32.1 | |
| May | 39.3 | 31.8 | |
| Jun | 35.8 | 32.1 | |
| Jul | 34.2 | 29.4 | |
| Aug | 36.9 | 32.4 | |
| Sep | 38.9 | 34.9 | |
| Oct | 39.9 | 33.4 | |
| Nov | 40.9 | 34.7 | |
| Dec | 46.8 | 44.0 | |
| 2020 | Jan | 45.5 | 39.9 |
| Feb | 46.0 | 43.0 | |
| Mar | 43.2 | 36.1 | |
| Apr | 38.4 | 35.1 | |
| May | 37.9 | 31.9 | |
| Jun | 40.1 | 33.0 | |
| Jul | 37.2 | 30.2 | |
| Aug | 38.8 | 32.3 | |
| Sep | 37.6 | 34.3 | |
| Oct | 38.7 | 35.1 | |
| Nov | 38.8 | 35.1 | |
| Dec | 42.7 | 37.4 | |
| 2021 | Jan | 43.2 | 38.0 |
| Feb | 43.7 | 38.9 | |
| Mar | 38.9 | 32.8 | |
| Apr | 35.7 | 31.9 | |
| May | 36.7 | 33.0 | |
| Jun | 34.7 | 30.5 | |
| Jul | 39.7 | 35.2 | |
| Aug | 37.2 | 29.7 | |
| Sep | 37.8 | 29.3 | |
| Oct | 40.2 | 32.3 | |
| Nov | 39.4 | 32.3 | |
| Dec | 52.5 | 49.6 | |
| 2022 | Jan | 50.7 | 45.0 |
| Feb | 43.0 | 36.6 | |
| Mar | 40.6 | 35.7 | |
| Apr | 41.4 | 33.6 | |
| May | 33.7 | 30.5 | |
| Jun | 37.5 | 32.9 | |
| Jul | 34.9 | 30.2 | |
| Aug | 33.4 | 28.7 | |
| Sep | 35.4 | 32.0 | |
| Oct | 31.5 | 28.4 | |
| Nov | 37.6 | 32.2 | |
| Dec | 35.0 | 32.3 | |
| 2023 | Jan | 37.5 | 35.3 |
| Feb | 37.8 | 34.6 | |
| Mar | 37.1 | 31.6 | |
| Apr | 39.4 | 34.3 | |
| May | 34.5 | 30.9 | |
| Jun | 31.4 | 26.1 | |
| Jul | 35.3 | 29.5 | |
| Aug | 33.0 | 26.8 | |
| Sep | 37.2 | 30.6 | |
| Oct | 38.3 | 30.1 | |
| Nov | 41.3 | 33.2 | |
| Dec | 37.1 | 35.3 |
Source: Transport Canada, Class 1 Railways, Port of Vancouver, Lloyds List intelligence