Article 10 - Design Considerations
10.0.1 Design Vehicle
The design of a grade crossing and its approaches depends greatly on the design vehicle's length and its braking and acceleration characteristics. Together with the gradient of the road approach and the length of the grade crossing clearance distance, the design vehicle characteristics are vital for determining the stopping sight distance (SSD), the sightlines along the railway right-of-way and in advance of the warning system, and the advance warning time and gate descent time requirements for the grade crossing's warning system. A grade crossing design vehicle must be established for all crossings for vehicular use. This has been mandatory for all existing grade crossings since the GCRcame into force (GCR57 and 72).
The design of a grade crossing for pedestrians, cyclists and persons using assistive devices, including its approaches, depends on the abilities of the users of the crossing and the types of devices they use. Consideration should therefore be given to the slowest users.
10.0.2 Vehicle Classification
The Transportation Association of Canada (TAC) Geometric Design Guide, cited at the beginning of this Handbook, sets out the various classes of design vehicles and their characteristics.
Table 10-5 below, lists these various design vehicles and their respective descriptions and lengths. The Geometric Design Guide provides further details on these vehicles, as well as listing four categories of special design vehicles whose dimensions and characteristics are not specified. The most common of these are listed in Table 10-6 of this document, there are still other special design vehicles, not described in the Geometric Design Guide, that routinely operate over certain private and public grade crossings, such as those used in the agricultural, industrial, and natural resources sectors. The most common of these special vehicles are described in Table 10-7. As with the vehicles of Table 10-6, the dimensions of these vehicles are not specified, so each vehicle needs to be measured, as their length can vary significantly.
10.0.3 Selecting a Grade Crossing Design Vehicle
It is not practical to design every public grade crossing for all road vehicles. In selecting the grade crossing's design vehicle, consideration should be given to the most restrictive design vehicles expected to routinely use the grade crossing. For public grade crossings, this responsibility falls to the road authority; for private grade crossings, this responsibility falls to the railway company. For public grade crossings, a traffic study may be useful in selecting the design vehicle, whereas for private crossings, the landowner or appropriate authority should be contacted to guide this selection.
Table 10-7 may be used as a guide for selecting a grade crossing's design vehicle. However, direct observation or a traffic study is the preferred and more accurate way of determining the proper design vehicle for a given location.
10.0.4 Changing Design Vehicle
If the road authority determines that there is a need to change the design vehicle, for example because of a change in the way the road is being used, written notice must be provided to the railway company, no later than 60 days before the date on which the change begins, outlining the details of the change and including the information referred to in subsection 12(1) of the GCRrelating to the change (GCR91).
A Temporary Design Vehicle Notice should also be provided to the railway company for any oversized vehicle permits that may be issued (dimensional loads).
Upon receipt of a dimensional load permit application, efforts should be made to communicate to the affected railway company, information on the route to be used. This information will allow for adequate measures to be put in place to protect the temporary design vehicle. Section 102 of the GCRmust be applied (see Article 22 of this Handbook).
If the design vehicle changes, the period during which the warning system must operate before railway equipment reaches the crossing surface must meet 16.1 (GCR 91).
Should the railway decide to change the design vehicle at a private grade crossing, notice should be provided to the private authority no later than 60 days before the change takes place, to give them the opportunity to accept or refute the change.
10.0.5 Stopping Sight Distance
The perception-reaction time refers to the interval of time between the occurrence, or appearance, of a signal (usually a visual stimulus) and the driver's physical reaction to it. A complex, unexpected situation requiring several possible courses of action results in a considerably longer reaction time than a simple, anticipated situation. The longer the reaction time, the shorter the time available to attend to other information, thus compounding the chance of error. Perception-reaction time is generally considered to consist of four elements:
- detection
- identification
- decision
- response
Stopping sight distance (SSD) is one of several types of sight distance used in road design. It is the minimum distance a vehicle driver needs to be able to see to have room to stop before colliding with something within the road approach, such as railway tracks, pedestrians, traffic control devices, a stopped vehicle or road debris. Insufficient SSD can adversely affect the safety of railway operations.
SSD is the total distance travelled during perception-reaction time and therefore the braking distance for a selected design vehicle. Braking distance is the distance it takes to stop the vehicle once the brakes have been applied.
Braking distance (“d” shown in the formula below) depends on the type and condition of the vehicle, the gradient of the road, the available traction, and numerous other factors. Direct measurement is often the most accurate way of determining braking distance.
The following tables and formulae are taken from the Geometric Design Guide and are applicable to the general grade crossing design vehicles listed in Table 10-5. The SSD for the special vehicles listed in Table 10-6 or for any other vehicle, are to be calculated in accordance with the principles set out in the Geometric Design Guide or as mentioned earlier, through direct measurement.
[Geometric Design Guide Formula 1.2.5.2]
where:
d = braking distance (m)
V = maximum road operating speed (km/h)
f = coefficient of friction between tires and the roadway [Table 10-8]
g = 9.81 m/s2
then:
[Geometric Design Guide Formula 1.2.5.2]
where:
SSD = stopping sight distance (m)
Table 10-9 provides the minimum SSD on level grade and wet pavement for the general design vehicles listed in Table 10-5. These values are used to design road approaches and to determine SSDs for existing grade crossings, sightlines, and the placement and alignment of signs and grade crossing warning signals.
The SSDs in Table 10-9 may need to be increased or decreased for a variety of reasons, including grade, vehicle braking capability and road surface condition.
10.0.6 Variation for Trucks
Because they are seated higher, drivers of trucks can generally see farther than drivers of cars. In some instances, however, the driver's height is a disadvantage. For example, a downgrade vertical curve where visibility is cut off by an overpass can dramatically reduce visibility. Also, a truck's braking characteristics vary according to the load being carried (in the case of a bus, the number of passengers). Effective braking distance must be considered when determining SSD.
10.0.7 The Effect of Grade on Braking Distance
Braking distance increases on downgrades and decreases on upgrades. When the roadway is on a grade, whether positive or negative, the braking distance can be calculated using the following formula (keeping in mind that, as mentioned earlier, direct measure is often the most reliable means of obtaining this value):
[Geometric Design Guide Formula 1.2.5.3]
where:
G = the percent grade divided by 100 (up is positive, down is negative, as observed from SSD); if unknown, G can be obtained using the following formula:
G = rise/run
V = maximum road operating speed (km/h)
f = coefficient of friction between tires and the roadway [Table 10-8].
10.0.8 Acceleration Curves for General Design Vehicles
The assumed acceleration curves for general design vehicles and long-load logging trucks, starting from a stopped position on level and smooth roads, can be found in the Geometric Design Guide and are reproduced in Table 10-2. These can be used to assist in the determination of the time required for general design vehicles and long-load logging trucks to cross the grade crossing clearance distance.
The acceleration curve for single-unit trucks may be used for standard single-unit buses (B-12) and intercity buses (I-BUS), and the acceleration curve for tractor-trailers and long combination vehicles may be used for articulated buses (A-BUS).
10.0.9 Grade Crossing Conditions
The acceleration curves provided in Figure 10-2 are for crossings with smooth and continuous road surfaces and are provided for guidance only. A greater number of tracks, super elevated tracks, surface roughness, unevenness created by the crossing angle, and restrictions on shifting gears while crossing tracks all increase acceleration time. Such factors must be considered when calculating acceleration time, plus time accordingly added to the acceleration curves provided in Figure 10-2, as applicable.
10.0.10 Effect of Road Gradient on Acceleration
The effect of road gradient should be factored into the design vehicle's acceleration time by multiplying its acceleration time on level ground by the acceleration ratio for that vehicle on that gradient. Acceleration ratios for general and special design vehicles on continuous grades of -4%, -2%, 0%, 2% and 4% are provided in the Geometric Design Guide and reproduced in Table 10-1 and can be used to determine the time it takes such vehicles to cross the grade crossing clearance distance.
The road approach gradient (in percentage) is the average of the gradients measured within the stopping sight distance (SSD). The road approach gradient is always measured in the same direction: approaching the grade crossing from the start of the SSD. A positive (+) value represents an ascending grade, and a negative (-) value represents a descending grade. The gradient must be determined for each road approach. This is done by the road authority.
Once the average road approach gradient has been determined, the ratio in Table 10-1 is applied only to the travel time through the portion of the road at that gradient and using the maximum gradient in any area of transition for the direction of travel.
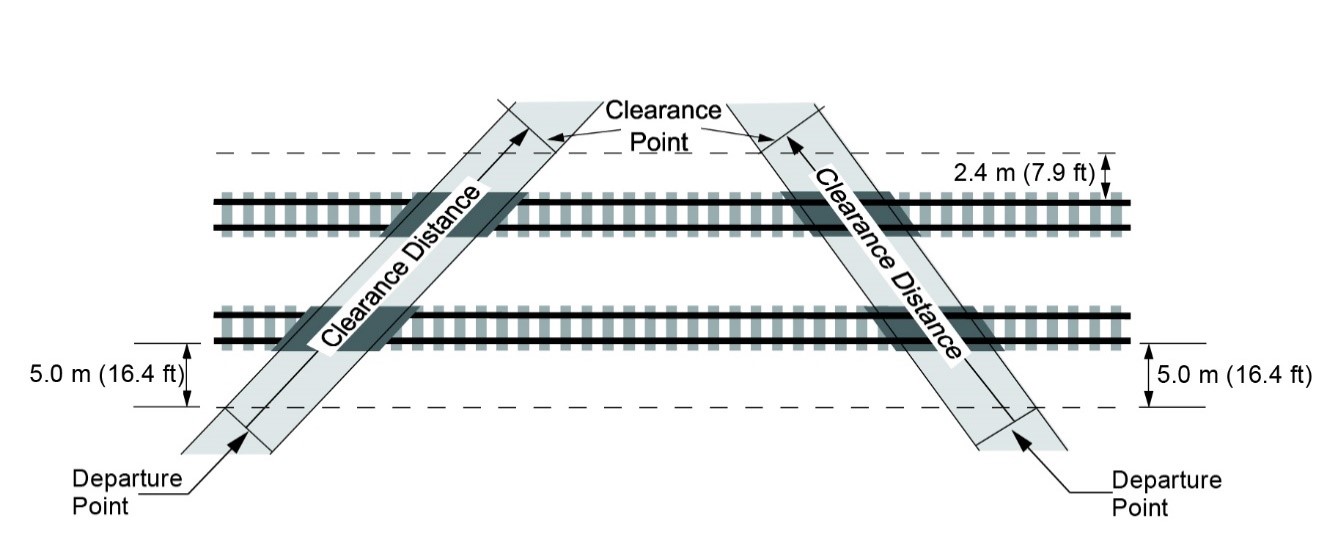
10.1 Grade Crossing Clearance Distance (cd)
10.1.1 The grade crossing clearance distance (cd) is the distance between the departure point (normally 5 meters or more from the nearest rail; but this can vary, depending on the layout of the Railway Crossing signs or warning signal masts) to a point (called the clearance point) 2.4 meters beyond the farthest rail, as shown in Figure 10-1. Crossing characteristics that increase clearance distance include:
- a crossing angle greater or less than 90°.
- multiple tracks.
- greater-than-standard spacing between multiple tracks; and
- the presence of a Railway Crossing sign, signal, stop sign, or pavement stop line.
10.1.2 The clearance point is the point 2.4 meters beyond the outside edge of the rail farthest from the departure point, measured perpendicularly to the rail. The departure points for drivers, pedestrians, cyclists, and persons using assistive devices is 5 meters before the nearest rail or 2 meters before a Stop sign, Railway Crossing sign, warning signal or gate arm.
Normally, where the crossing angle is 90°, a Railway Crossing sign, warning signals, or gate arm is located 3 meters from the nearest rail, measured perpendicularly to the rail, and the stopped position of the front of a vehicle is 2 meters beyond that, therefore 5 meters from the nearest rail. This departure point is used to calculate the clearance distance, although it can vary, depending upon the layout of the Railway Crossing signs or warning signal masts,
Where the crossing angle is greater or less than 90°, the distance along the road between such devices and the nearest rail will be greater than 3 meters, and the stopped position of the front of a vehicle will therefore be greater than 5 meters for the calculation of clearance distance. See Figure 10-1 for an illustration of clearance distance.
10.2 Vehicle Travel Distance(s)
10.2.1 The vehicle travel distance is calculated using the following formula:
s = cd + L
where:
s = distance the road vehicle must travel to pass through the grade crossing clearance distance (m)
cd = grade crossing clearance distance [Figure 10-1]
L = length of the grade crossing design vehicle [Table 10-5]
Figure 10-1 Clearance Distance for Grade Crossings
a) For Grade Crossings with a Warning System or Railway Crossing sign

b) For Grade Crossings without a Warning System or Railway Crossing sign
Source: Grade Crossings Standards, January 1, 2019
10.3 Departure Time – General
Departure time (TD) is the greater of either the time required for the design vehicle to pass completely through the clearance distance from a stopped position or the time required for pedestrians, cyclists or persons using assistive devices to pass completely through the clearance distance (TP). Departure time is essential for determining how far along the railway right-of-way sightlines need to be cleared to provide road users with enough time to decide whether it is safe to traverse the grade crossing.
A vehicle's acceleration from a stopped position and the time it takes to pass over the grade crossing depend on a number of factors:
- The road surface, including the crossing surface, must be in good condition. Clearance of snow and treatment of ice is required for proper vehicle traction on the road surface.
- The rates of acceleration of design vehicles vary greatly according to their mass/power ratios.
- Certain factors at grade crossings may increase the time required for vehicles to travel the grade crossing clearance distance. These factors may include:
- condition of the road surface.
- super elevated track.
- an intersection on the far side of the grade crossing where vehicles are required to stop, which will slow vehicle acceleration over the crossing.
- restrictions on gear shifting while passing over the grade crossing.
- non-standard placement of stop line pavement markings.
- the road gradient from where the vehicle is stopped and throughout the crossing clearance distance will affect vehicle acceleration, and therefore departure time.
10.3.1 Ratio of Acceleration Times on Grades of Design Vehicles
Table 10-1 , below, expresses the effect of road gradient on the design vehicle's acceleration time as a ratio. Departure time on a given road gradient is obtained by multiplying the design vehicle's acceleration time on level ground (t), which is the clearance distance + the length of the design vehicle, by the ratio of acceleration time (G) for that vehicle on that gradient.
|
Grade Crossing Design Vehicle |
Road Grade (%) |
||||
|---|---|---|---|---|---|
|
-4 |
-2 |
0 |
+2 |
+4 |
|
|
Source: Geometric Design Guide for Canadian Roads, Transportation Association of Canada, September 1999. |
|||||
|
Passenger car |
0.7 |
0.9 |
1.0 |
1.1 |
1.3 |
|
Single-unit truck or bus |
0.8 |
0.9 |
1.0 |
1.1 |
1.3 |
|
Tractor-semitrailer |
0.8 |
0.9 |
1.0 |
1.2 |
1.7 |
10.3.2 Departure Time – Design Vehicle (TD)
The design vehicle departure time depends on the clearance distance, the length of the design vehicle, and the vehicle's acceleration.
The departure time is the total time, in seconds, the design vehicle must travel to pass completely through the clearance distance (cd) and is calculated using the following formula:
[Equation 10.3a from the GCS]
where:
J = perception-reaction time, in seconds (e.g., the time it takes the crossing user to look in both directions, shift gears, if necessary, and prepare to start); a minimum of 2 seconds; and
T = the time, in seconds, that it takes the grade crossing design vehicle to travel through the vehicle travel distance (s), considering the road gradient at the grade crossing.
Note: T may be obtained by measuring the time it takes for the selected design vehicle to travel the grade crossing clearance distance either at the actual grade crossing or by using the following formula:
[Equation 10.3b of the GCS]
where:
t = the time, in seconds, that it takes the design vehicle to accelerate through the vehicle travel distance (S) on level ground, as per Figure 10-2, Assumed Acceleration Curves; and
G = the ratio of acceleration times based on the gradients from Table 10-1, Ratios of Acceleration Times on Grade.
The road gradients indicated in Table 10-1 are the maximum road gradients over the distance the design vehicle must travel, measured from the rear of the design vehicle when at the stopped position to the clearance point (e.g., point at which the rear of the vehicle is said to be clear of the crossing surface by 2.4 m). This value can be different for each road approach to the grade crossing. The road approach gradient is always measured from the stopped position towards the crossing. A positive (+) value represents an ascending slope, and a negative (-) value represents a descending slope. To calculate the design vehicle departure time, the road approach gradient should be determined for both approaches. The value used for G should be the higher of the two.
Note: For one-way roads, use the actual maximum road gradient (+ or -) within the vehicle travel distance, where; S = L + cd to calculate the departure time from the stopped position.
Values for t and G should be calculated by a qualified person.
Note: When an oversized load or a longer design vehicle applies for an oversized load permit to traverse certain roads comprising of a grade crossing, or when a railway wide load is scheduled to travel over the grade crossing, the road authority or railway company, as applicable, must notify the other party of the date and time on which the move is scheduled to take place so that the proper temporary protection measures can be put in place. (GCR102).
Figure 10-2 Assumed Acceleration Curves for Grade Crossings with Smooth Approaches and Continuous Road Surfaces – General Design Vehicles (Geometric Design Guide)
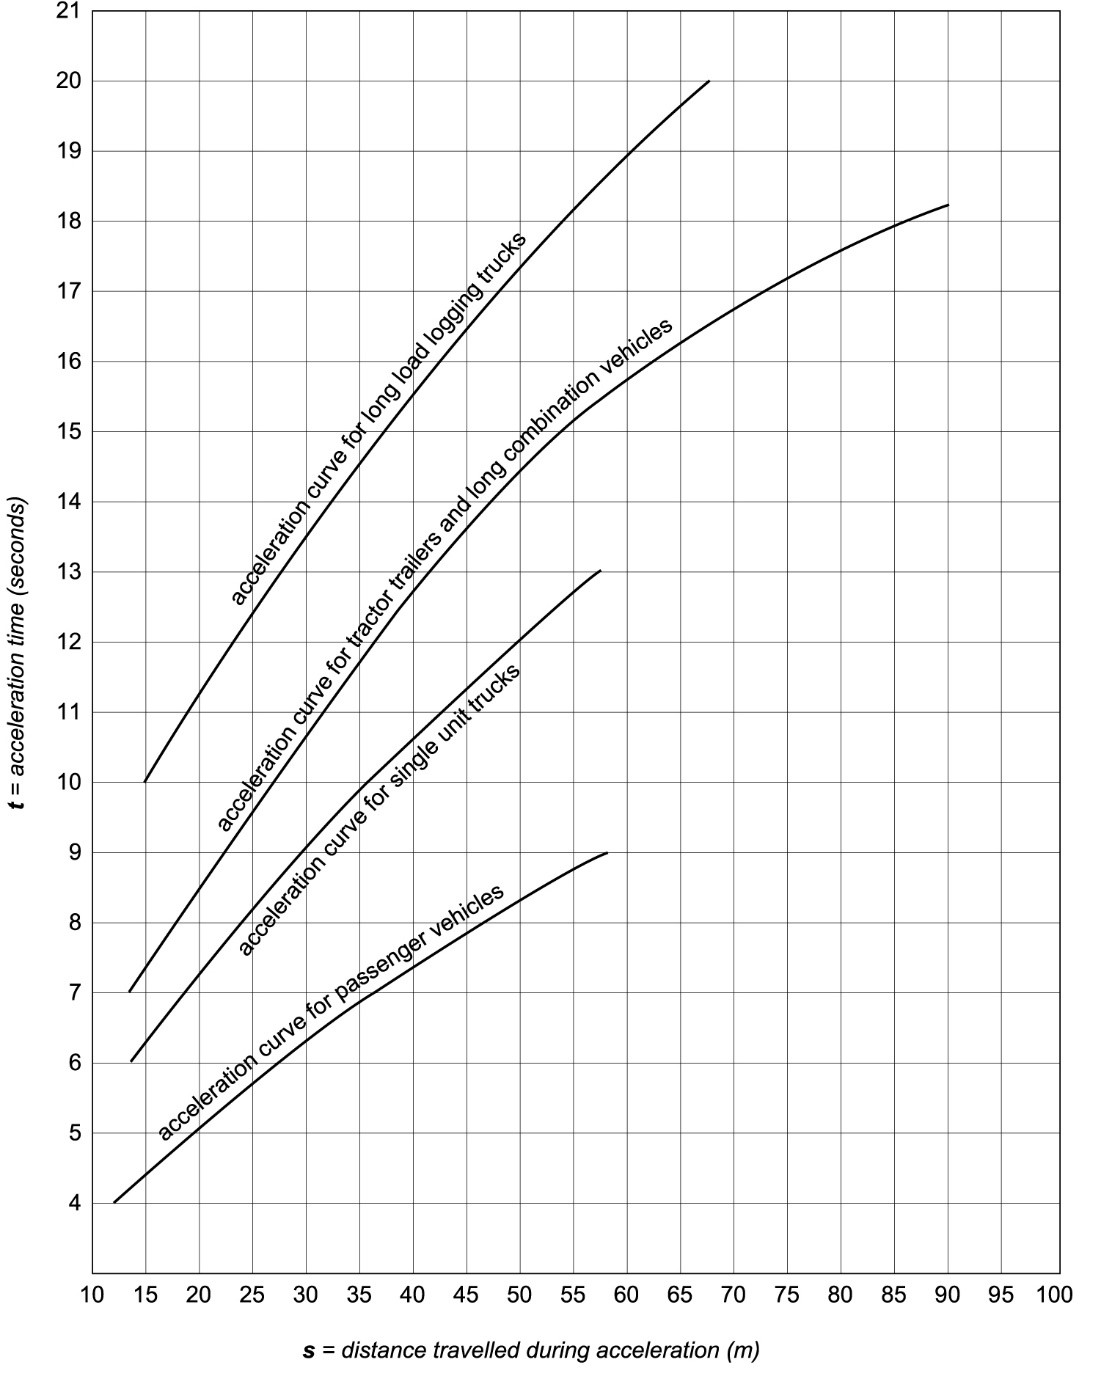
Source: Geometric Design Guide for Canadian Roads, Transportation Association of Canada, September 1999.
10.3.3 Departure Time – Pedestrians, Cyclists and Persons Using Assistive Devices (TP)
The amount of time, in seconds, that it takes pedestrians, cyclists and persons using assistive devices to pass completely through the clearance distance () is calculated using the formula below.
Note: Because warning system gates on sidewalks, paths or trails must extend across the full width of the sidewalk path or trail, the clearance distance for such crossings equipped with gates should be measured from the point, marking 2 meters in advance of the nearest gate to the gate arm on the far side (clearance side) of the grade crossing. This is to prevent pedestrians from being trapped on the crossing surface by the horizontal gates (GCS 12.1(f)(i)).
[Equation 10.3c of the GCS]
where:
cd= the clearance distance, in meters (Article 10.1); and
Vp = the average travel speed, in meters per second (m/s), for pedestrians, cyclists, and persons using assistive devices (to a maximum value of 1.22 m/s).
Note: While the Grade Crossings Standards (GCS) allow up to a maximum value of 1.22 m/s for the variable Vp, practitioners may wish to consult additional guidance material such as the 6th Edition of the TAC MUTCDC which provides recommendations/guidance on pedestrian walking speeds ranging from 0.8 m/s to 1.0 m/s. The TAC Geometric Design Guide for Canadian Roads (June 2017 Edition) also provides further guidance on design speeds for cyclists and for walking speeds for persons using assistive devices.
Practitioners should use consistent practice in their own jurisdictions and apply engineering judgment to determine whether the above walking speeds are to be used to calculate the crossing time at the intersection or are to be applied specifically to the calculation of the pedestrian clearance interval only.
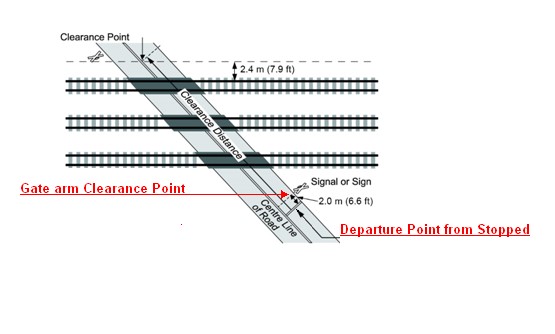
10.4 Gate Arm Clearance Time
10.4.1 Gate Arm Clearance Time for a Roadway
Gate arm clearance time (GACT) is the time required for the design vehicle to travel the entire gate arm clearance distance (cdGstop) from either the stopped position or the SSD, whichever is greater. The gate arm clearance point is the point at which the rear end of the vehicle is said to be clear of the gate arm, as shown in Figure 10-3 below.
Warning: GACT should only be adjusted when site-specific design parameters (design vehicle, road speed, etc.) at the grade crossing change or are deemed inadequate. These site-specific design parameters are established by the road authority, who shares a responsibility for ensuring that GACT is adequate for the characteristics of the grade crossing. GACT must therefore never be adjusted by the railway company without first communicating the change to the road authority.
The time required for vehicles to stop or accelerate on a descending or ascending grade must be considered. Refer to the Geometric Design Guide and Article 10.0.5 to calculate the effect of gradient on stopping sight distance or acceleration, and to calculate the gate delay requirement for special vehicles.
Note: Where a warning system equipped with four-quadrant gates is interconnected with traffic signals at a grade crossing, advance pre-emption should be considered, as additional operating time is required for the GACT. In most cases, GACT and maximum pre-emption time are concurrent with queue clearance time. It is critical to ensure that an appropriate amount of time is provided for right-of-way transfer, queue clearance, separation, and gate arm clearance. See Part E for more information on device interconnection.
Figure 10-3 Gate Arm Clearance Point
Gate Arm Clearance Time from the SSD position
Gate arm clearance time from the SSD is the greater of TG SSD or TGstop and represents the time, in seconds, that it takes the design vehicle to travel from either the stopping sight distance (SSD) or the stopped position to the point past the gate arm, whichever is greater.
Gate arm clearance time from the SSD position ( ) is calculated as follows:
[Equation 10.3c of the GCS]
= the road crossing design speed over the crossing, in kilometers per hour (km/h); and
where:
SSD is the stopping sight distance, in meters, and is calculated using the following formula:
where:
d = braking distance (m) (found in Article 10.0.5)
V = initial speed (km/h)
L = the total length, in meters, of the design vehicle
Gate Arm Clearance Time from the stopped position
This means the time it takes the grade crossing design vehicle to accelerate and travel across the full gate clearance distance from the stopped position. A driver decides to proceed only after perceiving that the warning lights are not flashing, at which point he/she normally begins to move without delay. There should be sufficient time for the vehicle to cross the gate arm clearance distance before the gate arm descends.
Gate arm clearance time for stopped vehicles should be calculated concurrently with the design vehicle departure time for that crossing, as per Article 10.3.
Gate Arm Clearance Time from the Stop position ( ) is calculated as follows:
where:
J = 2 seconds, which is the perception-reaction time needed for a crossing user to look in both directions, shift gears, if necessary, and prepare to start; and
G = the ratio of acceleration time as per Table 10-1, Ratios of Acceleration Times on Grade, or as measured directly; and
TcdG stop = the time, in seconds, required for the design vehicle to accelerate through the gate arm clearance distance (cdG stop) on level ground as per Figure 10-2, Assumed Acceleration Curves (Note; (cdG stop) is used in place of (s) and (tcdG stop) is used in place of (t) from Figure 10-2); and
where:
L = the total length, in meters, of the design vehicle.
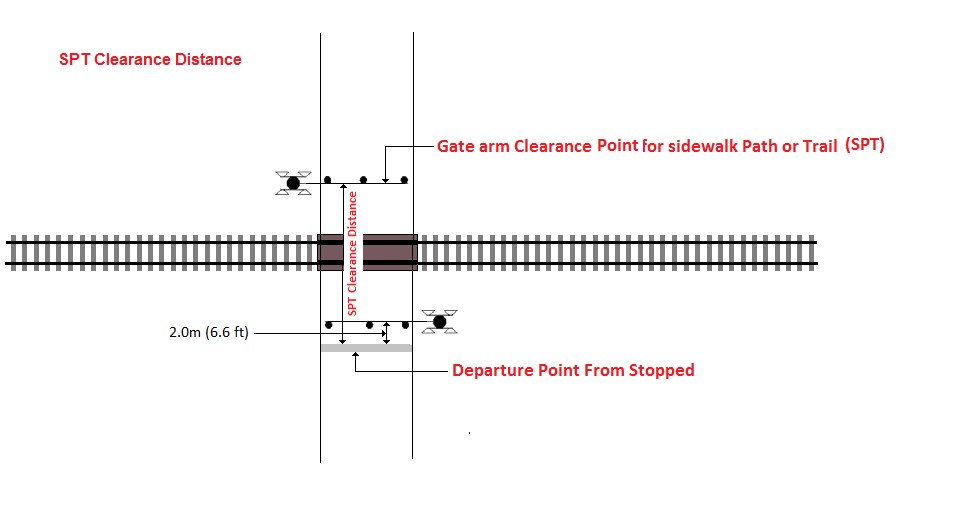
10.4.2 Gate Arm Clearance Time for stand-alone sidewalks, paths, or trails
This means the time, in seconds, that it takes pedestrians, cyclists and persons using assistive devices to travel across the full clearance distance (cd) on a sidewalk path or trail (SPT), as shown in Figure 10-4
Note: The gate arm clearance time for stand-alone sidewalks, paths or trails should be measured from 2 meters in advance of the nearest gate to the gate on the far side (clearance side) of the grade crossing. Because GCS 12.1(f)(i) specifies that warning system gates on sidewalks, paths or trails must extend across the full width of the sidewalk path or trail, gate arm clearance time must be properly calculated to prevent pedestrians from being trapped on the crossing surface by the gate.
Gate Arm Clearance Time for stand-alone Sidewalks, Paths, or Trails ( ) is calculated as follows:
where:
= the clearance distance, in metres, measured from 2 metres in advance of the nearest gate to the farthest gate; and
= the average travel speed, in metres per second (m/s), of pedestrians, cyclists, and persons using assistive devices (to a maximum value of 1.22 m/s).
Figure 10-4 Gate arm Clearance Time for Stand Alone Sidewalk Paths or Trails
10.5 Effect of Design Vehicle
For maximum accuracy, it is recommended that the departure time for a given design vehicle be measured directly. Figure 10-2 and Table 10-1 above, should be used to determine departure time at a given grade crossing only when a single design vehicle is used at that crossing.
|
Specifications |
|
||
|---|---|---|---|
|
Column A |
Column B |
Column C |
|
|
|
|
|
|
|
Rural |
Local |
Divided |
|
|
Collector |
|||
|
Urban |
Not Divided |
||
|
Arterial |
|||
|
|
Rural Locals |
Rural Collectors |
Rural Arterials |
Rural Freeways |
|---|---|---|---|---|
|
Source: Geometric Design Guide for Canadian Roads, published by the Transportation Association of Canada, September 1999 |
||||
|
Service function |
Traffic movement secondary consideration |
Traffic and land access of equal importance |
Traffic movement primary consideration |
Optimum mobility |
|
Land service |
Land access primary consideration |
Traffic movement and land access of equal importance |
Land access secondary consideration |
No access |
|
Traffic volume vehicles per day (typically) |
<1000 AADT |
<5000 AADT |
<1 2000 AADT |
>8000AADT |
|
Flow characteristics |
Interrupted flow |
Interrupted flow |
Uninterrupted flow except at |
free flow (grade separated) major intersections |
|
Design speed (km/h) |
50 – 110 |
60 – 110 |
80 – 130 |
100 – 300 |
|
Average running speed (km/h) (free flow conditions) |
50 – 90 |
50 – 90 |
60 – 100 |
70 – 110 |
|
Vehicle type |
Predominantly passenger cars, light to medium trucks and occasional heavy trucks |
All types, up to 30% trucks in the 3 t to 5 t range |
All types, up to 20% trucks |
All types, up to 20% heavy trucks |
|
Normal connections |
Locals collectors |
Locals collectors arterials |
Collectors arterials freeways |
Arterials freeways |
Note: The terms urban and rural are to be interpreted in the same manner as in the Geometric Design Guide. They refer to the predominant characteristics of the road (referred to in Table 10-3 and Table 10-4).
|
|
Public Lanes |
Locals |
Collectors |
Arterials |
Expressways |
Freeways |
||||
|---|---|---|---|---|---|---|---|---|---|---|
|
Residential |
Commercial |
Residential |
Indust / Comm. |
Residential |
Indust/ Comm |
Minor |
Major |
|||
|
Traffic service function |
Traffic movement not a consideration |
Traffic movement secondary consideration |
Traffic movement and land access of equal importance |
Traffic movement major consideration |
Traffic movement primary consideration |
Traffic movement primary consideration |
Optimum mobility |
|||
|
Land service/ access |
Land access only function |
Land access primary function |
Traffic movement and access of equal importance |
Some access control |
Rigid access control |
No access |
no access |
|||
|
Traffic volume (veh/day) (typical) |
<500 |
<1000 |
<1000 |
<3000 |
<8000 |
1000 – 12 000 |
5000 – 20 000 |
10 000 – 30 000 |
>10000 |
<20 000 |
|
Flow characteristics |
Interrupted flow |
Interrupted flow |
Interrupted flow |
Uninterrupted flow except at signals and crosswalks |
Uninterrupted flow except at signals |
Free flow (grade separation) |
||||
|
Design speed (km/h) |
30 – 40 |
30 – 50 |
50 – 80 |
40 – 60 |
50 – 90 |
80 – 110 |
80 – 120 |
|||
|
Average Running speeds (km/h) (off-peak) |
20 – 30 |
20 – 40 |
30 – 70 |
40 – 60 |
50 – 90 |
60 – 90 |
70 – 110 |
|||
|
Vehicle type |
Passenger and service vehicles |
All types |
Passenger and service vehicles |
All types |
Passenger and service vehicles |
All types |
All types |
All types up to 20% trucks |
All types up to 20% trucks |
All types up to 20% trucks |
|
Desirable connections |
Public lanes, locals |
Public lanes, locals, collectors |
Locals, collectors, arterials |
Collectors, arterials, expressways, freeway |
Arterials, expressway, freeways |
Arterials, expressways, freeways |
||||
|
Transit service |
Public lanes, locals |
Public lanes, locals, collectors |
Locals, collectors, arterials |
Express and local busses permitted |
Express buses only |
Express buses only |
||||
|
Accommodation of cyclists |
No restriction or special facilities |
No restriction or special facilities |
No restriction or special facilities |
Lanes widening or separate facilities desirable |
prohibited |
prohibited |
||||
|
Accommodation of pedestrians |
Pedestrian permitted, no special facilities |
Sidewalks normally on one or both sides |
Sidewalks provided where required |
Sidewalks provided both sides |
Sidewalks provided where required |
Sidewalks may be provided, separation for traffic lanes preferred |
Pedestrian Prohibited |
Pedestrian Prohibited |
||
|
Parking (typically) |
Some restrictions |
No restrictions or restrictions one side only |
Few restrictions other than peak hour |
Peak hour restriction |
Prohibited or peak hour restriction |
prohibited |
prohibited |
|||
|
Min. Intersection spacing1 (m) |
As needed |
60 |
60 |
200 |
400 |
800 |
1600 (between interchanges) |
|||
|
Right-of-way width (m) (typically) |
6 – 10 |
15 – 22 |
20 – 24 |
202 – 453 |
>453 |
>603 |
||||
Source: Geometric Design Guide for Canadian Roads, Transportation Association of Canada, September 1999.
|
General Vehicle Descriptions |
Length (m) |
Design Vehicle Class |
|---|---|---|
|
Source: Geometric Design Guide for Canadian Roads, Transportation Association of Canada, September 1999. |
||
|
1. Passenger Cars, Vans, and Pickups (P) |
5.6 |
Passenger Car |
|
2. Light Single-unit Trucks (LSU) |
6.4 |
Truck |
|
3. Medium Single-unit Truck (MSU) |
10.0 |
Truck |
|
4. Heavy Single-unit Truck (HSU) |
11.5 |
Truck |
|
5. WB-19 Tractor-Semitrailers (WB-19) |
20.7 |
Truck |
|
6. WB-20 Tractor-Semitrailers (WB-20) |
22.7 |
Truck |
|
7. A-Train Double (ATD) |
24.5 |
Truck |
|
8. B-Train Double (BTD) |
25.0 |
Truck |
|
9. Standard Single-Unit Buses (B-12) |
12.2 |
Bus |
|
10. Articulated Buses (A-BUS) |
18.3 |
Bus |
|
11. Inter-city Buses (I-BUS) |
14.0 |
Bus |
|
Design Vehicle Description |
Length (m) |
Width (m) |
|---|---|---|
|
Source: Geometric Design Guide for Canadian Roads, Transportation Association of Canada, September 1999. |
||
|
Agriculture machinery |
To be determined in the detailed safety assessment. |
To be assessed for the area. To be determined in the detailed safety assessment. |
|
Special trucks such as long-load logging trucks and long combination vehicles (LCVs) |
To be determined in the detailed safety assessment. May be up to 38 m in length in Canada |
Standard road width |
|
Recreational vehicles (RVs) and towed recreational trailers |
To be determined in the detailed safety assessment. |
Standard road width |
|
Industrial equipment, including quarrying, sand and gravel, mining. |
To be determined in the detailed safety assessment. |
To be determined in the detailed safety assessment and assessed for the area. |
|
Road Use |
Description |
Design Vehicle(s) |
|---|---|---|
|
Source: Draft RTD 10, October 24, 2002. |
||
|
Local roads serving seasonal residences |
summer and winter areas |
single-unit trucks |
|
Tourist area |
self-propelled or towed recreational vehicles |
single-unit trucks, special vehicles – recreation |
|
Agricultural area, e.g., farm to farm |
private road grade crossing serving agricultural use or local public roads within the area |
single-unit trucks, buses, truck tractors with semitrailers, combination vehicles with B train doubles, or special vehicles such as farm tractors with trailers, towed cultivating or harvesting equipment, or large self-propelled cultivating and harvesting machinery |
|
Access roads to residential property |
where the traffic stream is almost exclusively residential use |
passenger car, light van, and pickup |
|
where the users have large trucks or special vehicles |
single-unit trucks, truck tractors with semitrailers, or special vehicles – recreational |
|
|
Industrial |
private roads |
single-unit trucks, truck tractors with semi-trailers, A or B train doubles, or special vehicles – machinery or long combination vehicle |
|
public grade crossings within an industrial area |
combination vehicles |
|
|
resource road |
single-unit trucks, tractor trailers, combination vehicles, special vehicles – off road mining, long load logging trucks |
|
|
Local residential road |
regular use by commercial delivery vehicles, moving vans, road maintenance vehicles and garbage trucks |
single-unit trucks, buses |
|
Residential collector |
regular use by commercial delivery vehicles, moving vans, road maintenance vehicles, garbage trucks, or buses |
single-unit trucks, buses |
|
Urban and rural arterial roads |
|
combination vehicles, buses |
|
Designated truck route |
|
combination vehicles |
|
Designated special or vehicle route, e.g.oversized or dimensional loads |
|
special vehicles – long-load logging trucks or long combination vehicles |
|
Maximum Road Operating Speed (km/h) |
Coefficient of Friction (f) |
|
|---|---|---|
|
Source: Geometric Design Guide for Canadian Roads, Transportation Association of Canada, September 1999. |
||
|
0 – 30 |
0.40 |
|
|
31 – 40 |
0.38 |
|
|
41 – 50 |
0.35 |
|
|
51 – 62 |
0.33 |
|
|
63 – 69 |
0.31 |
|
|
70 – 76 |
0.30 |
|
|
77 – 84 |
0.30 |
|
|
85 – 90 |
0.29 |
|
|
91 – 97 |
0.28 |
|
|
98 – 120 |
0.28 |
|
|
Road Crossing Design Speed (V) (km/hr) |
Stopping Sight Distance (SSD) (m) |
||||||||||||||||||||||
|---|---|---|---|---|---|---|---|---|---|---|---|---|---|---|---|---|---|---|---|---|---|---|---|
|
Road Approach Gradient |
|||||||||||||||||||||||
|
-10% |
-9% |
-8% |
-7% |
-6% |
-5% |
-4% |
-3% |
-2% |
-1% |
0% |
1% |
2% |
3% |
4% |
5% |
6% |
7% |
8% |
9% |
10% |
|||
|
Source: Transport Canada Guideline for Determining Minimum sightlines at Grade Crossings: A Guide for Road Authorities and Railway Companies (Table 2) |
|||||||||||||||||||||||
|
10 |
8 |
8 |
8 |
8 |
8 |
8 |
8 |
8 |
8 |
8 |
8 |
8 |
8 |
8 |
8 |
8 |
8 |
8 |
8 |
8 |
8 |
||
|
20 |
21 |
21 |
21 |
21 |
21 |
21 |
20 |
20 |
20 |
20 |
20 |
20 |
20 |
20 |
20 |
20 |
19 |
19 |
19 |
19 |
19 |
||
|
30 |
33 |
33 |
32 |
32 |
32 |
31 |
31 |
31 |
30 |
30 |
30 |
30 |
30 |
29 |
29 |
29 |
29 |
29 |
29 |
28 |
28 |
||
|
40 |
51 |
50 |
49 |
49 |
48 |
48 |
47 |
46 |
46 |
45 |
45 |
45 |
44 |
44 |
43 |
43 |
43 |
42 |
42 |
42 |
42 |
||
|
50 |
76 |
75 |
73 |
72 |
71 |
70 |
69 |
68 |
67 |
66 |
65 |
64 |
63 |
63 |
62 |
61 |
61 |
60 |
60 |
59 |
59 |
||
|
60 |
104 |
101 |
99 |
97 |
95 |
93 |
91 |
89 |
88 |
86 |
85 |
84 |
83 |
81 |
80 |
79 |
78 |
77 |
77 |
76 |
75 |
||
|
70 |
140 |
135 |
132 |
128 |
125 |
122 |
119 |
117 |
114 |
112 |
110 |
108 |
106 |
105 |
103 |
101 |
100 |
99 |
97 |
96 |
95 |
||
|
80 |
182 |
176 |
171 |
166 |
161 |
157 |
153 |
149 |
146 |
143 |
140 |
137 |
135 |
132 |
130 |
128 |
126 |
124 |
122 |
121 |
119 |
||
|
90 |
223 |
216 |
209 |
202 |
197 |
191 |
186 |
182 |
178 |
174 |
170 |
167 |
163 |
160 |
157 |
155 |
152 |
150 |
148 |
145 |
143 |
||
|
100 |
281 |
271 |
262 |
253 |
245 |
238 |
232 |
226 |
220 |
215 |
210 |
205 |
201 |
197 |
194 |
190 |
187 |
184 |
181 |
178 |
175 |
||
|
110 |
345 |
331 |
318 |
307 |
296 |
287 |
278 |
270 |
263 |
256 |
250 |
244 |
239 |
234 |
229 |
224 |
220 |
216 |
212 |
209 |
205 |
||
Notes:
- This table may be used as a guide reference for all design vehicle classes in Table 1-8 of the Geometric Design Guide for Canadian Roads, TAC: 2017.
- Table 10-9 was generated using the formulas contained in Article 7.2 of the Grade Crossing Standards.
Article 11 - Location of Grade Crossings
The purpose of this requirement is to help ensure clear storage space for vehicular road users at all grade crossings. When clear storage space cannot be provided, there is a risk of vehicles queuing over the railway tracks, putting them at significant risk of collision with a train.
If a minimum of 30 meters of clear storage space cannot be provided at a vehicular grade crossing, the installation of a warning system and interconnecting that system with the traffic signals (if present) should be considered. See Part E of this Handbook for interconnection requirements.
Grade crossings that existed before the GCR came into force, are grandfathered; that is, they are not required to meet the standards set out below (GCS article 11) until warranted changes are made. However, it is recommended that these locations be reviewed as per Article 13 of the GCS, and they may nonetheless be required to have additional light units installed for intersecting roads or entrance ways.
If the location, gradient or crossing angle of a grade crossing changes, articles 6 and 11 of the GCS must be applied in a manner that improves the overall safety of the grade crossing (GCR 88).
This requirement also applies to grade crossings constructed after the coming to force of the GCR. (See Article 2 for more information on amendments to the GCR timelines)
Note: this requirement does not apply to a public grade crossing that is a standalone sidewalk, path or trails, or access is for the exclusive use of pedestrians and non-motor vehicles.
Standalone sidewalk, path or trail is as defined in Article 1 of this Handbook.
11.1 Proximity to an intersection
A public grade crossing at which the railway design speed is greater than 25 km/h (15 mph) must be constructed so that no part of the travelled way of an intersecting road or entrance way (other than a railway service road), is closer than 30 meters to the nearest rail of the grade crossing (defined as “D” in Figure 11-1, below).
A person may construct a new road intersection or an access road on a road approach to a public grade crossing if:
- The railway design speed is 25 km/h (15 mph) or less; or
- The location of the grade crossing meets the standards set out in article 11 of the GCS. (GCR 101)
Grade crossings that are separated by more than 30 meters between lines of railway shall be considered separate grade crossings (GCR definition of “grade crossing”).
For the purposes of the GCR, two adjacent and separate roads that are used by motor vehicles and that cross one or more lines of railway are considered to be separate grade crossings.
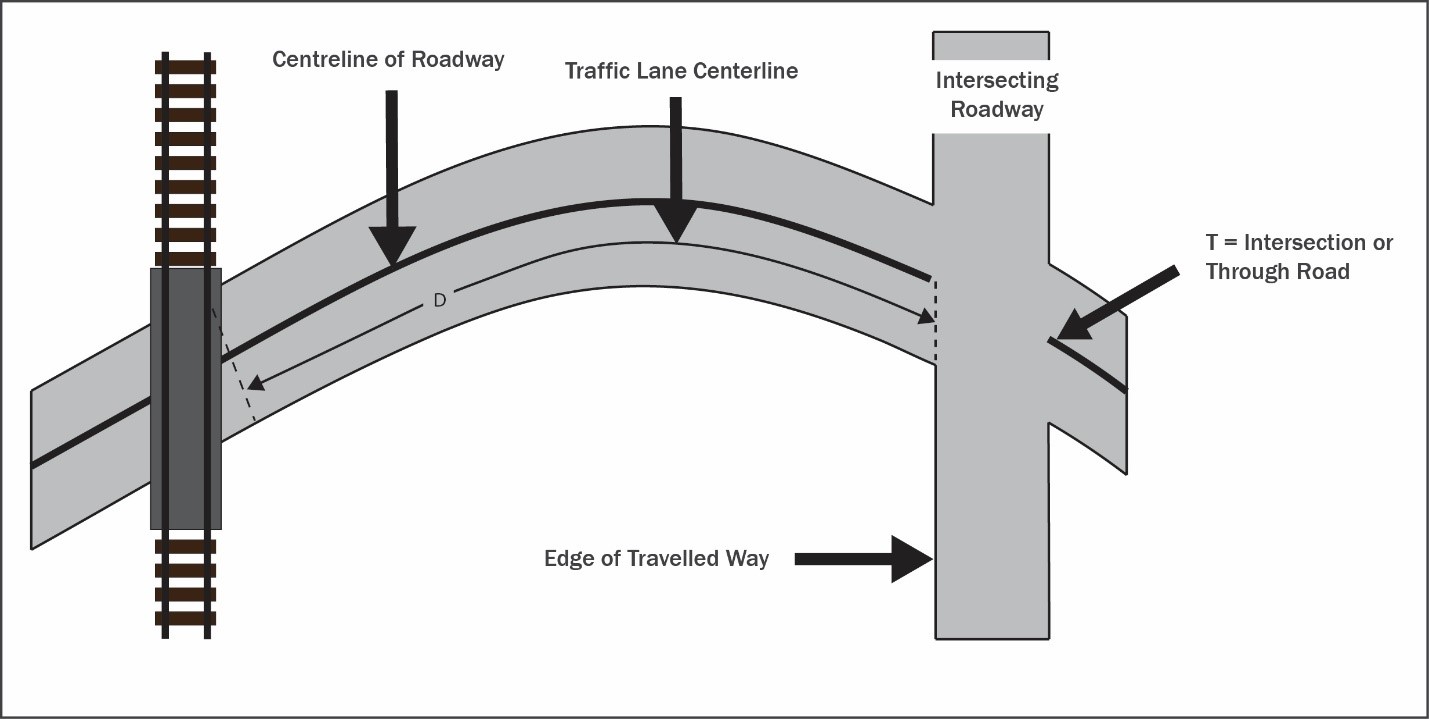
In cases where the road approach is curved, the D measurement must be taken from along the centerline of the roadway. (Defined as “D” in Figure 11-2, below).
11.2 Grade Crossings Within or In Close Proximity to Circular Intersections
At circular intersections, such as roundabouts and traffic circles, that include or are within close proximity to a grade crossing, a queue of vehicular traffic could cause highway vehicles to stop on the grade crossing.
Where circular intersections include or are within 60 meters (200 feet) of a grade crossing, an engineering study should be conducted to determine if queuing could impact grade crossing safety. If such is the case, provisions should be made to clear highway traffic from the grade crossing prior to the arrival of rail traffic (GCR 100).
Among the actions that can be taken to keep the grade crossing clear of traffic or to clear traffic from the grade crossing prior to the arrival of rail traffic are the following:
- Elimination of the circular intersection.
- Revision of the geometric design.
- Installation of grade crossing regulatory and warning devices.
- Installation of highway traffic signals.
- Installation of traffic metering devices.
- Installation of “Prepare to stop at Railway Crossing” signs.
- A combination of these or other actions.
Figure 11-1 Restrictions on the Proximity of Intersections and Entranceways to Grade Crossings
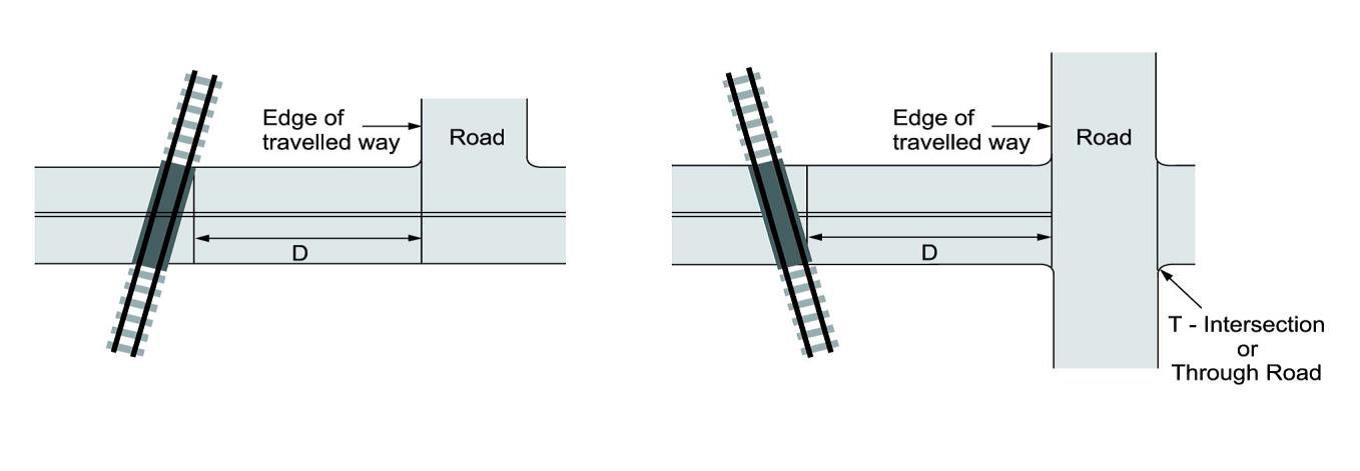
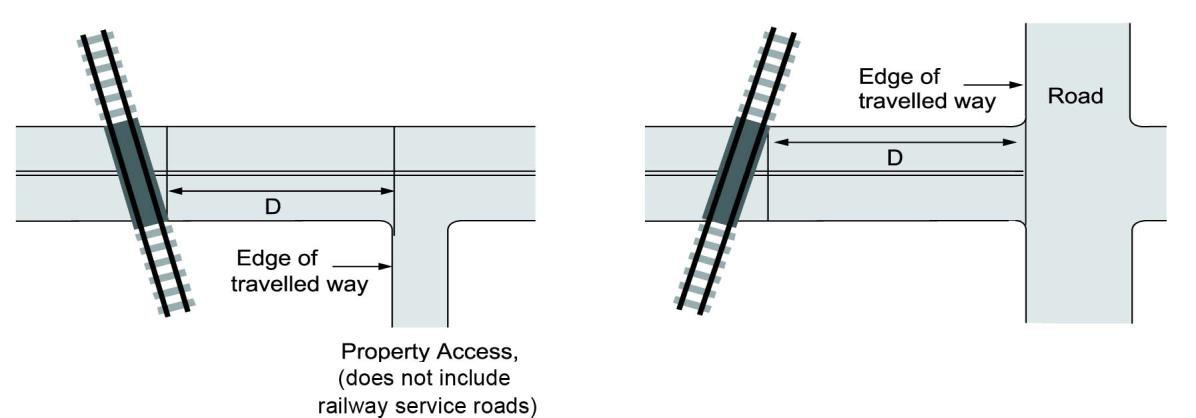
Source: Grade Crossings Standards, January 1, 2019
Figure 11-2 Intersection with a Curved Roadway